Risk Analysis in Bridge Construction Projects
B.Vidivelli 1, E. Vidhyasagar 2, K.Jayasudha 3
Professor, Department of Civil and Structural Engineering, Annamalai University, Chidambaram, India1
P.G. Student, Department of Civil and Structural Engineering, Annamalai University, Chidambaram, India2
Research Scholar, Department of Civil and Structural Engineering, Annamalai University, Chidambaram, India3
ABSTRACT: Construction of bridge projects were initiated in complex and dynamic problems resulting in circumstances of high uncertainty and risk, which were compounded by demanding many constrains. The general methodology was to study relies largely on the survey questionnaire which will be collected from various bridge project construction contractors and project managers of different sizes by mail or personnel meeting. The questionnaire prepared for the survey was formulated by seeing the relevant literatures in the area of construction management. This thesis seeks to identify the risks factors that affect the performance of bridge projects as a whole and analyse by using appropriate tools and technique and to develop a risk management. The questionnaire was divided into 7 categories under which totally 50 questions was asked to respondents. The responses were analysed using the software of SPSS. Statistical analysis of responses on the factors was segregated into distinct sets of critical factor. This study aims to identify factors that affected bridge construction project and incorporating critical factors to improve the risk analysis. The extent of their contribution has, however, been observed to vary for a given level of project performance. The analysis results were expected to help project professionals to focus on a few factors and get the optimum results rather than giving attention to all the factors and not getting the proportionate results.
KEYWORDS: Construction Management, Risk Analysis and SPSS.
I. INTRODUCTION
Risk is the potential of gaining or losing something of value. Values such as physical health, social status or financial wealth can be gained or lost when taking risk resulting from a given action or inaction. Consequences of uncertainty and its exposure in a project is risk. In a project context, it is the chance of something happening that will have an impact upon objectives. It includes the possibility of loss or gain, or variation from a desired of planned outcome, because of the uncertainty associated with following a particular course of action. Risk hence has two elements likelihood or probability of something happening, and the consequence or impact if it does. Managing risk is an important part of good management and fundamental to achieving good business and project outcomes and the effective procurement of goods and services. Risk management provides a structured way of assessing and delaying with future uncertainty.
1.1 RISK
The concept of risk is multi-dimensional. In the context of construction industry, the probability that a definite factor detrimental to the overall project occurs is always present. A lack of predictability related to the consequences of a planning situation and the associated uncertainty of estimated outcomes leads to the consequence that results either can be better than expected or can be worse.
1.2 TYPES OF RISKS
take out insurance cover against these risks. The second category is 'fundamental risk'. This includes external factors such as damage due to war, nuclear pollution and supersonic bangs, government policy on taxes, labour, safety or other laws malicious damage and industrial disputes. Such incidents are all the subject of statutory liability and no insurance cover is normally available or needed. The third category, often referred to as 'speculative risk', is something, which can apportioned in advance as decided by the parties to the contract. This may include losses in time and money, which result from unexpected ground conditions, exceptionally adverse weather, unforeseeable shortages of labour or materials and other similar matters beyond the control of the contractor. There are also risks of losses of time and money due to: delays and disputes (possession of site, late supply of information, inefficient execution of work, etc.) poor direction, supervision or communication; delays in payment and delay in resolving disputes There are various kinds of risk and the risk management deals with their timely identification, assessment and proper handling. The types of risk management differ based on the nature of operations of a particular organization and other factors like its overall goals and performance. All these types of financial risk management processes and risk management reports play a significant role behind the growth of an organization in the end. Commercial enterprises apply various forms of risk management procedures to handle different risks because they face a variety of risks while carrying out their business operations. Effective handling of risk ensures the successful growth of an organization.
1.3 BRIDGE CONSTRUCTION
A bridge is a structure built to span physical obstacles without closing the way underneath such as a body of water, valley, or road, for the purpose of providing passage over the obstacle. There are many different designs that each serve a particular purpose and apply to different situations. Designs of bridges vary depending on the function of the bridge, the nature of the terrain where the bridge is constructed and anchored, the material used to make it, and the funds available to build it. Bridge construction is a complex and systematic work and there are varieties of risks all the time during the whole phase of bridge construction from construction preparation to construction completion. During the construction phase of a bridge, plenty of work is high above the ground; as a result, the construction of bridges has higher risk compared with the other engineering construction. The occurrence of risk accidents in the phase of bridge construction will lead to great losses to the proprietor and construction enterprises, if the construction risk of the bridge has not paid more attention. The risk accidents will have adverse effect on the regular bridge construction and it may interrupt the bridge construction. For the large bridge, the investment of which is so huge, the technology is very complex and the construction period is too long. When the accident of the large bridge in construction phase occurs, the property damage and personal injury is more serious than the ordinary bridge. Therefore, the risk management of large bridges in construction phase has great significance to prevent the occurrence of construction accidents of large bridges.
1.4 RISK ANALYSIS
Tools that can automate often support the application of a risk analysis technique. The main role of the tools is to allow for searching, gathering and managing the necessary data for the various project phases. Various techniques use different types of data and information collected from a wide range of sources using different tools, such as statistics, inspections, surveys, documentations and expert judgments. Project risk analyse techniques can be classified into two main categories, namely qualitative and quantitative techniques.
1.4.1 Qualitative Analysis
Qualitative risk analysis techniques do not operate on numerical data, present result in the form of descriptions, recommendations and ordinal scores, where risk assessments are connected with qualitative description and determination of qualitative scales for the probability and impact of the consequences of risk.
The main qualitative analysis techniques are:
Brainstorming
Cause and affect diagram
Checklist
Event Tree Analysis (ETA)
Risk Breakdown Structure (RBS)
Qualitative risk analysis techniques can be lists of risks, risk rankings, or risk maps. These techniques prioritize risks for subsequent further analysis or action by assessed and combined their probability of occurrence and impact. The risk were evaluated in more conceptual terms, such as high, medium or low, depending upon the collected opinions and risk tolerance boundaries in the organization
1.4.2 Quantitative Analysis
A quantitative analysis technique, the estimation of risk exposure related to the application of numerical measures. The impact of consequences defined as a monetary value and the likelihood by the frequency of risk occurrence based on past series of available data. In brief, quantitative techniques numerically analyse the effect of identified risks on the project objectives
The main quantitative analysis techniques are:
Decision Tree Analysis
Expected Monetary Value (EMV)
Expert judgement
Fault Tree Analysis (FTA)
Fuzzy logic
Probability distribution
II. LITERATURE REVIEW
Dziadoaz and Rejment (2015) studied the three different methods of the risk analysis as well as stress their disadvantages, advantages and primary areas of application. These methods differ in their methodology from each other. Analyse was done using statistical method, which determines the type of used data hence it affects the quality of the results. The result of the paper was to use the method for identification and preliminary assessment of risk by the matrix of risk and develop risk assessment model in construction projects it should be emphasized on the compilation available. Naser and Kodur (2015) discussed the important factor that was used to quantify fire risk in present and new bridges and provide guidelines for designers to tackle the fire hazard in bridges. The degree of vulnerability of structural and sub structural component to fire mainly depend on fire resistance of various structural members of bridge.
Neeraj and Balasubramaniyan (2015) studied the key factors of risk in construction industry through questionnaires. Thirty eight factors influenced risks in construction were analysed through pilot study, which include experts of academicians, government sectors and construction industry were interviewed, and interviewed experts obtained twenty two evaluation criteria as the key factor. This approach provides a more effective, accurate and organised decision support tool. Parvathy et al, (2015) studied the major risks and risk factors that influence the three classes of the Indian construction companies, which undertake the majority of the projects in the South Indian cities of Cochin and Udupi using Analytic Hierarchical Process (AHP). AHP tool act as multi-attribute decision-making method in which each risk factor and sub-risk each risk factor based on that output. The results help in management of construction companies to identify which type of risk was most likely to occur in a particular class of company, so that it could be mitigated in the future.
industry. Kansal and Manoj (2012) studied the different methodology of risk identification techniques in the construction industry. The construction industry was specialised into industrial construction, infrastructure and heavy construction. The research carried out through questionnaires survey within the construction industry. Risk significant index method, they had analysed the collected data. A three-point rating scale was chosen to differentiate the risks. Finally, it was identified the current used methods for risk assessments were Brainstorming, checklist, flowchart, Delphi method, Risk significant index method. Each method of risk assessment has their limitation hence it was observed that risk assessment could be integrated into new approach that helps decision making.
III. METHODOLOGY
METHODOLOGY
This research focused on the intrinsic area of risk analysis, was carried out in a systematic manner. The literature review included academic journals, books and other published materials. The research methodology of the study included the process to classify the awareness on implementation of risk analysis in bridge construction projects. To provide a foundation a several structured questionnaire was developed, which was followed throughout the project.
IV. QUESTIONNAIRE PREPARATION
Based on the extensive literature reviews and expert’s advice, the questionnaire consist of fifty risks fewer than seven risk factors. Responses on the extent of effect of those attributes on bridge construction were sought on a five-point ordinal scale: “1” referred to “Critical Factor,” “2” to “Important Factor,” “3” to “Neither Important Factor,” “4” to “Poor Factor,” and “5” to “Not Important Factor”. The extent of their contribution has, however, been observed to vary for a given level of project performance. The analysis result expected to help project professionals to focus on a few factors and get the optimum results rather than giving attention to all the factors and not getting the proportionate results. The questionnaire was prepared which included 7 types of risk factors. Though there were many types of risks which affected the bridge construction projects, those 7 risk factors were considered the most easy to collect all the sub risk factors. The questionnaire aimed to explore seventy risk factors related to bridge construction projects, which is time consuming and may retard respondents from participation. Secondly, the questionnaire content is broad and may not be within the knowledge context of some industries practitioners. The large sample may weaken the effectiveness of the questionnaire survey. The risk factors were further integrated in 50 sub risk factors, these sub factors were included in respective risk factor category based on the type of risk associated with the bridge construction project. The risk factors are as follows:
Financial Risk
Insurance Risk
Contractual Risk
Management Risk
Design Risk
External Risk
Time Management Risk
4.1 CONDUCT OF SURVEY
explanation for the ideas and contents of questionnaire, conducted. The data was given as an input into the statistical package for Statistical analysis. Result would show the present scenario of risk in bridge construction projects.
4.2 DEMOGRAPHIC ANALYSIS ON RESPONDENTS
The questionnaires were distributed to various construction professionals who had different age and experience in the field of construction. A total of hundred questionnaires were distributed to professionals out of hundred seventy five questionnaires were selected as good responses. The questionnaire was collected from Site Engineers, Project Managers, Planning Engineers and Architect. The demographic analysis was done through different criteria of age, experience and designation.
4.2.1 Demographic Profile of Respondent’s Age
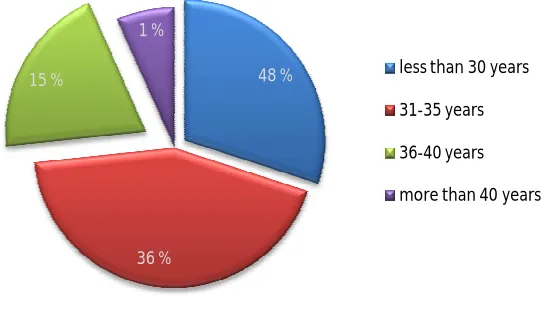
The questionnaires were distributed to diverse respondents of different age categories. The age categories were classified in four categories which consisted of less than 30 years, 31 to 35 years, 36 to 40 years and more than 40 years, it was determined that 36 respondents were under the less than 30 years age category, 27 respondents were under 31 to 35 years of age category, 11 respondents under 36 to 40 years of age category and 1 respondent in more than 40 years of age category. The questionnaire collected from different age category professionals working in bridge construction site, Figure 4.1 revels that 48 % of respondents are less than 30 years, 36 % of respondents are 31 to 35 years, 14.67% of respondents are 36 to 40 years and 1.33% of respondents are more than 40 years, so the majority of the respondents are from less than 30 years of age category
Fig. 4.1 Respondent’s Age
4.2.2 Demographic Profile of Respondent’s Designation
The questionnaire distributed to various peoples working in the bridge construction site under designation category the respondents were classified into four categories namely Project Manager, Planning Engineer, Architect and Site Engineer. According to designation each respondent had answered the questionnaire, it was determined that 9 respondents were Project Managers, 25 respondents were Planning Engineers, 10 respondents were Architect and 31 respondents were Site Engineers. Out of total 75 respondents most of the respondents were site engineers, Figure 4.2 reveals that 12% of respondents were project Manager, 34% of respondents were Planning Engineers, 13% of respondents were Architect and 41% of respondents were Site Engineer.
48 %
36 % 15 %
1 %
less than 30 years
31-35 years
36-40 years
Fig. 4.2 Respondent’s Designation
4.2.3 Demographic Profile of Respondent’s Experience
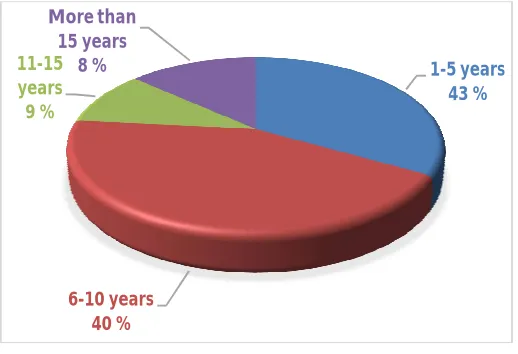
The experience of the respondents determines their quality of work carried out by them in the construction site. The respondents were also classified into experience category. The respondents experience category consisted of 32 respondents in 1 to 5 years of experience, 30 respondents under 6 to 10 years of experience category 7 respondents in 11 to 15 years of experience and above 15 years had 6 respondents.Through the Figure 4.3 the experience of the respondents consisted of 43% of respondents were from 1 to 5 years of experience, 40% of respondents were 6 to 10 years, 9% of respondents were 11to 15 years and 8% of respondents were more than 15 years, so the majority of the respondents are from 1 to 5 years of age category.
Fig. 4.3 Respondent’s Experience
4.3 DATA COLLECTION
The questionnaire comprised of totally 55 questions under 7 factors such as financial risk (6 factors), insurance risk (3 factors), contractual risk (6 factors), design risk (7 factors), management risk (17 factors), external risk (5 factors), time management risk (6 factors). The factor identity number for risk factors for bridge construction projects.
architect 13 %
Project manager
12%
planning engineer
34 %
site engineer
41 %
1-5 years 43 %
6-10 years 40 %
11-15 years
9 %
More than 15 years
4.4 RANKING OF THE RISK
The risk was ranked according to the mean value of each risk factor. The lowest ranked factors were the most influencing factors the cause problems during the construction process. From the table, though there are many risks that affect the quality of the structure top ten risks were taken as most important risks for further analysis. Ranking the risks help in identifying impact during construction process in a site. The overall ranking of the factors in Table 4.1 shows that each factor with their factor id is ordered according to the lowest mean value to the largest mean value. The table also consist of standard deviation of each factor and rank of every factor is given in the table, from the rank top ten ranks would be considered as critical risk in the bridge construction projects.
Table 4.1 Ranking of Risks Sl.
No
FACTOR
ID FACTORS MEAN S.D RANK
1 TM1 Delay during construction process 1.4 0.52 1
2 MR4 Lack of coordination 1.56 0.826 2
3 MR9 Safety equipment for workers 1.57 0.661 3
4 DR7 Many modifications on design are made during execution 1.59 0.807 4
5 ER5 Unavailability of land and right of way that restricts access to the site 1.64 0.864 5
6 TM5 Casting and curing time is more 1.64 0.799 6
7 FR6 Inexperience when pricing tenders 1.69 0.87 7
8 FR4 Unrealistic cost estimate and schedules 1.71 0.818 8
9 CR4 The owner lags behind in paying the contractors 1.71 0.835 9
10 CR6 Low level of capability of contractor 1.73 0.92 10
11 CR1 Improper verification of contract document 1.76 0.898 11
12 DR5 Staff do not have sufficient knowledge about the design 1.83 0.476 12
13 MR5 Poor site management 1.88 0.492 13
14 TM6 Release of funds takes time 1.93 0.644 14
15 FR5 The contractors does not pay workers’ wages in due time 1.95 0.59 15
16 TM2 Long distance between procurement and project site 2.04 0.448 16
17 TM4 working hours of labours are enough 2.04 0.417 17
18 MR2 Availability camp for labours 2.05 0.49 18
19 MR11 There no regular material test for materials in the project site 2.07 0.704 19
20 MR17 Regular inspection of the site 2.08 0.427 20
21 CR3 Change in project scope and change orders 2.12 0.614 21
22 CR2 Contactor anomalies 2.13 0.528 22
23 MR3 No past experience in similar project 2.13 0.644 23
24 CR5 Conflict between contactor and management team 2.16 0.546 24
25 IR1 The company obtain large loans 2.17 0.742 25
26 IR2 Health insurance 2.17 0.724 26
27 MR13 Geotechnical risk 2.17 0.601 27
28 DR2 Design agencies are not monitored 2.19 0.692 28
29 ER1 Delay in approval from regulatory bodies 2.19 0.456 29
30 MR8 Incomplete knowledge about equipment 2.2 0.545 30
31 TM3 Long distance between batching plant and site 2.2 0.637 31
32 DR1 There are many design agencies 2.21 0.664 32
33 FR3 Low credibility of shareholders and lenders 2.23 0.606 33
34 MR16 Unexpected weather condition 2.28 0.605 34
36 MR1 Change of top management 2.39 0.837 36
37 DR4 Dispute between owner and design team 2.53 0.759 37
38 MR12 Heavy equipment are not maintained periodically 2.53 0.6 38
39 DR6 Plans of design are incompatible with execution 2.56 0.663 39
40 MR15 Inventory storage 2.59 0.68 40
41 MR6 Strike and theft 2.6 0.788 41
42 MR7 Dispute between labours 2.63 0.673 42
43 IR3 Non-payment of taxes 2.67 0.844 43
44 MR14 Traffic of large vehicles during construction 2.67 0.741 44
45 DR3 The designer does not follow up design and changes made on them 2.73 0.684 45
46 ER4 Unstable government policies 2.73 0.723 46
47 ER2 Political instability 2.81 0.783 47
48 ER3 Third party delay 2.87 0.445 48
49 FR1 Loss due to fluctuation of interest rate 3.27 0.777 49
50 FR2 Fluctuation price in materials 3.57 1.347 50
4.5 T-TEST
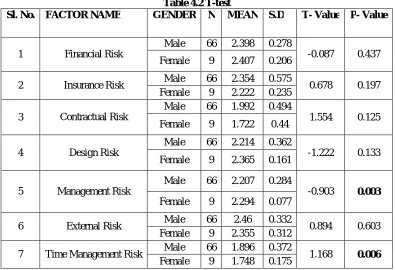
The t test is that “any statistical hypothesis test in which the test statistic follows a t distribution under null hypothesis”. From the data, one sample t test was conducted which compares the sample mean to a hypothesized mean to determine whether the two means are significantly different, by seeing the significance table. According to the thesis t-test determines whether the mean of the individual factors which was collected from the respondents after the hypothesized mean of the factors. In SPSS the t-test are used for the analysis as shown in Table 4.2
Table 4.2 T-test
Sl. No. FACTOR NAME GENDER N MEAN S.D T- Value P- Value
1 Financial Risk
Male 66 2.398 0.278
-0.087 0.437
Female 9 2.407 0.206
2 Insurance Risk Male 66 2.354 0.575 0.678 0.197
Female 9 2.222 0.235
3 Contractual Risk
Male 66 1.992 0.494
1.554 0.125
Female 9 1.722 0.44
4 Design Risk
Male 66 2.214 0.362
-1.222 0.133
Female 9 2.365 0.161
5 Management Risk
Male 66 2.207 0.284
-0.903 0.003
Female 9 2.294 0.077
6 External Risk Male 66 2.46 0.332 0.894 0.603
Female 9 2.355 0.312
7 Time Management Risk Male 66 1.896 0.372 1.168 0.006
Based on the t-test the male and female groups for the seven risk factors were considered for the analysis. The two factors namely management risk and time management risk were the significant value was less than 0.05. So there was a significant difference between the groups. Remaining five factors the significant value was higher than 0.05. Since there was no significant difference between the groups. The negative sign implied that there was a low risk.
4.6 ONE-WAY ANOVA
The One-Way ANOVA (“analysis of variance”) compares the mean of two or more independent groups in order to determine whether there is statistical evidence that significant difference among the means of two or more groups.
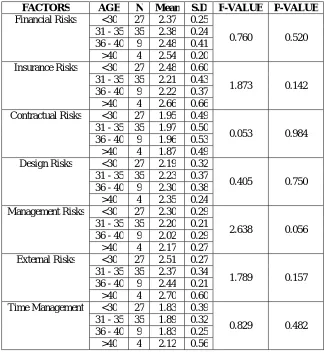
4.6.1 Analysis of Variance of the Respondent’s Age on Risks Factors
Analysis of variance had compared the two groups in Table 4.3. Among the groups age factor is dependent variable were financial risk, insurance risk, contractual risk, design risk, management risk, external risk and time management risk are independent variables. From the table mean and standard deviation of the respondents’ designation were calculated.
Table 4.3 Analysis of Variance of Risk Factors with the Respondent’s Age
FACTORS AGE N Mean S.D F-VALUE P-VALUE
Financial Risks <30 27 2.37 0.25
0.760 0.520
31 - 35 35 2.38 0.24
36 - 40 9 2.48 0.41
>40 4 2.54 0.20
Insurance Risks <30 27 2.48 0.60
1.873 0.142
31 - 35 35 2.21 0.43
36 - 40 9 2.22 0.37
>40 4 2.66 0.66
Contractual Risks <30 27 1.95 0.49
0.053 0.984
31 - 35 35 1.97 0.50
36 - 40 9 1.96 0.53
>40 4 1.87 0.49
Design Risks <30 27 2.19 0.32
0.405 0.750
31 - 35 35 2.23 0.37
36 - 40 9 2.30 0.38
>40 4 2.35 0.24
Management Risks <30 27 2.30 0.29
2.638 0.056
31 - 35 35 2.20 0.21
36 - 40 9 2.02 0.29
>40 4 2.17 0.27
External Risks <30 27 2.51 0.27
1.789 0.157
31 - 35 35 2.37 0.34
36 - 40 9 2.44 0.21
>40 4 2.70 0.60
Time Management <30 27 1.83 0.39
0.829 0.482
31 - 35 35 1.89 0.32
36 - 40 9 1.83 0.25
Analysis of variance of risk factors with respondent’s age table shows that all the risk factor’s the F value for financial risk 0.76, insurance risk 1.873, contractual risk 0.053, design risk 0.405, management risk 2.638, external risk 1.789 and time management risk 0.829.The P value is greater than 0.05. So significance rejected, and concluded that there was a statistically no significant difference in the mean of the variable, between groups based on designation of the respondents
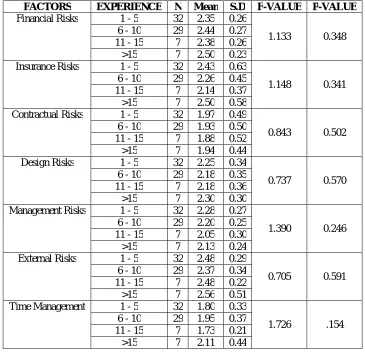
4.6.2 Analysis of Variance of the Respondent’s Experience on Risks Factors
Analysis of variance had compared the two groups in Table 4.4. Among the groups experience factor is dependent variable were financial risk, insurance risk, contractual risk, design risk, management risk, external risk and time management risk are independent variables. From the table mean and standard deviation of the respondents’ designation were calculated.
Table 4.4 Analysis of Variance of Risk factors with the Respondent’s Experience
FACTORS EXPERIENCE N Mean S.D F-VALUE P-VALUE
Financial Risks 1 - 5 32 2.35 0.26
1.133 0.348
6 - 10 29 2.44 0.27
11 - 15 7 2.38 0.26
>15 7 2.50 0.23
Insurance Risks 1 - 5 32 2.43 0.63
1.148 0.341
6 - 10 29 2.26 0.45
11 - 15 7 2.14 0.37
>15 7 2.50 0.58
Contractual Risks 1 - 5 32 1.97 0.49
0.843 0.502
6 - 10 29 1.93 0.50
11 - 15 7 1.88 0.52
>15 7 1.94 0.44
Design Risks 1 - 5 32 2.25 0.34
0.737 0.570
6 - 10 29 2.18 0.35
11 - 15 7 2.18 0.36
>15 7 2.30 0.30
Management Risks 1 - 5 32 2.28 0.27
1.390 0.246
6 - 10 29 2.20 0.25
11 - 15 7 2.05 0.30
>15 7 2.13 0.24
External Risks 1 - 5 32 2.48 0.29
0.705 0.591
6 - 10 29 2.37 0.34
11 - 15 7 2.48 0.22
>15 7 2.56 0.51
Time Management 1 - 5 32 1.80 0.33
1.726 .154
6 - 10 29 1.95 0.37
11 - 15 7 1.73 0.21
>15 7 2.11 0.44
that there was a statistically no significant difference in the mean of the variable, between groups based on designation of the respondents
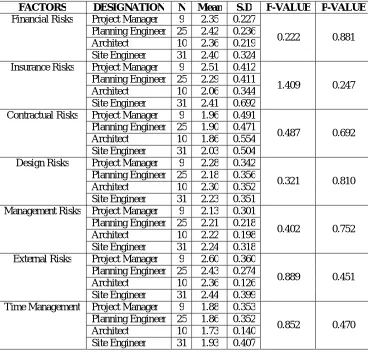
4.6.3 Analysis of Variance of the Respondent’s Designation on Risks Factors
Analysis of variance had compared the two groups in Table 4.5 Among the groups experience factor is dependent variable were financial risk, insurance risk, contractual risk, design risk, management risk, external risk and time management risk are independent variables. From the table mean and standard deviation of the respondents’ designation were calculated.
Table 4.5 Analysis of Variance of Risk Factors with the Respondent’s Designation
FACTORS DESIGNATION N Mean S.D F-VALUE P-VALUE
Financial Risks Project Manager 9 2.35 0.227
0.222 0.881
Planning Engineer 25 2.42 0.236
Architect 10 2.36 0.219
Site Engineer 31 2.40 0.324
Insurance Risks Project Manager 9 2.51 0.412
1.409 0.247
Planning Engineer 25 2.29 0.411
Architect 10 2.06 0.344
Site Engineer 31 2.41 0.692
Contractual Risks Project Manager 9 1.96 0.491
0.487 0.692
Planning Engineer 25 1.90 0.471
Architect 10 1.86 0.554
Site Engineer 31 2.03 0.504
Design Risks Project Manager 9 2.28 0.342
0.321 0.810
Planning Engineer 25 2.18 0.356
Architect 10 2.30 0.352
Site Engineer 31 2.23 0.351
Management Risks Project Manager 9 2.13 0.301
0.402 0.752
Planning Engineer 25 2.21 0.218
Architect 10 2.22 0.198
Site Engineer 31 2.24 0.318
External Risks Project Manager 9 2.60 0.360
0.889 0.451
Planning Engineer 25 2.43 0.274
Architect 10 2.36 0.126
Site Engineer 31 2.44 0.399
Time Management Project Manager 9 1.88 0.353
0.852 0.470
Planning Engineer 25 1.86 0.352
Architect 10 1.73 0.140
Site Engineer 31 1.93 0.407
4.7 Ranking of Risk Factors
Bridges were one of the most critical components in the transportation infrastructure for safety, security and mobility. Different issues, such as increased truck loadings and reduced maintenance funds, had contributed to increased risks of bridge failure. The risk in a bridge construction site was studied by adopting survey method. The data collection was conducted through questionnaire survey and Google forms and was well analysed with statistical analysis software (SPSS). In this study the questionnaire survey’s respondents were 9 project managers, 25 planning engineers, 10 architect and 31 site engineers who had rich experience in construction and strong academic background. Out of 50 factors, the questionnaires were grouped into 7 subgroups as financial risks, insurance risks, contractual risks, management risks, design risks, external risks and time management risk. From the statistical results, the top 10 critical factors were taken as the main factors. The ranks were formed in hierarchical order from lowest mean value to highest mean value. The Table 4.6 and Figure 4.1. Showed critical risk factors were ranked hierarchical manner.
Table 4.6 Critical Risk Factors Sl.
No.
Factor
ID FACTORS MEAN S.D RANK
1 TM1 Delay during construction process 1.4 0.52 1
2 MR4 Lack of coordination 1.56 0.826 2
3 MR9 Safety equipment for workers 1.57 0.661 3
4 DR7 Many modifications on design are made during execution 1.59 0.807 4
5 ER5 Unavailability of land and right of way that restricts access to the site 1.64 0.864 5
6 TM5 Casting and curing time is more 1.64 0.799 6
7 FR6 Inexperience when pricing tenders 1.69 0.87 7
8 FR4 Unrealistic cost estimate and schedules 1.71 0.818 8
9 CR4 The owner lags behind in paying the contractors 1.71 0.835 9
10 CR6 Low level of capability of contractor 1.73 0.92 10
Figure 4.4 Critical Risk Factors
0
0.25
0.5
0.75
1
1.25
1.5
1.75
1.4
1.56 1.57 1.59 1.64 1.64
1.69 1.71 1.71 1.73
M
ean
V. CRITICAL RISK FACTORS
The reasons for the risk are given below as follows. Time Management Risk
Delay during construction process: With a mean of 1.4, delays in construction process ranked first. Working is
also postponed due to many reasons some reasons are given below. The delay was due to miscommunication between persons working at site and office, environment condition, transportation problem and etc. all can be overcome by pre-planned of works carried at a particular day, scheduling should be given more importance.
Casting and curing time is more: with mean of 1.64, Casting and curing time is more ranked sixth in the risk
factor. In a bridge construction casting of deck slab, pillars are huge in numbers, so their casting time needs more time for good quality and for better service period. So it causes time delay which was directly affects the cost of the project.
Financial Risks
Inexperience when pricing tenders: with mean of 1.69, Inexperience when pricing tenders ranked seventh in the risk factor. Quoting a tender was initially done at the initial stage of construction phase; it was the main reason to give importance to this, because pricing the tender should be done carefully which needed experience and accuracy for neither over drafting the quotation nor less the quotation.
Unrealistic cost estimate and schedules: With a mean of 1.71, Unrealistic cost estimate and schedules ranked
eighth in the risk factors. Prepared cost and schedule of bridge was an important because money and time were vital things that should be taken care of. If either one of them are over drafted loss can be charged easily. Management Risks
Lack of coordination: with a mean of 1.56, Lack of coordination ranked second in the risk factors. Coordination between labours and engineers should be upright to maintain the tempo of worked carried out, if the relation between the co-workers was ruined then the worked will be delayed which was unexplainable to higher officials. Hence if there was any lack of coordination at construction site can be affecting the construction.
Safety equipment for workers: With a mean of 1.57, Safety equipment for workers ranked third in the risk factors. Worker’s safety should be given importance at a construction site, because there were many accidents which could occur ant time. Workers should be given proper training and PPE (Personal Protective Equipment) so that they can work at a safe environment.
Contractual Risks
The owner lags behind in paying the contractors: With a mean of 1.71, the owner lags behind in paying the contractors ranked ninth in the risk factors. Paying the for the work done by the contractor is an important relation kept between the owner and the contractor, because after the payment is received for the work finished so they can do the next work with payment received.
Low level of capability of contractor: With a mean of 1.73, Low level of capability of contractor ranked tenth
in risk factors. The capability of a contractor was judged by the previous work carried out the contractor, if the contractor was not able to finish the work without any queries, he would not be able to get the next contract. Design Risks
Many modifications on design are made during execution: With a mean of 1.53, many modifications on design
are made during execution ranked fourth in the risk factors. Before the execution work starts all the work were finished in software platform for clear understanding during execution but sometimes modification are made due improper designs , because through design stage they are not aware of the site condition. So that should be taken care of design team that there may not get differ and changes made during execution.
External Risks
overcome this type of risk a healthy relationship should be developed between the local bodies or a contract should be framed before the commencement of work.
VI. CONCLUSION
The following conclusions were drawn from the data analysis:
The demographical analysis of the respondents, based on the age the respondents were less than 30 years of
age had highest percentage of 48%. Based on the designation the highest respondents were Site Engineers had a percentage of 42%. Based on the experience the highest respondents were 1 to 5 years of experience had 43 %.
The overall ranking of risk factors for the seven categories were analysed, the mean value ranging from 1 to
2.5 as considered as the most critical factors in the bridge projects. the top ten ranking of risk factors were as follows: Delay during construction process, Lack of coordination, Safety equipment for workers, many modifications on design are made during execution, Unavailability of land and right of way that restricts access to the site, Casting and curing time is more, Inexperience when pricing tenders, Unrealistic cost estimate and schedules, the owner lags behind in paying the contractors and Low level of capability of contractor.
The T-test were analysed based on the male and female groups for the seven categories, only two factors namely management and time management risk were the significant value was less than 0.05, remaining five factors the significant value was higher than 0.05.
The ANOVA test was analysed based on the age, experience and designation for the seven categories the significant value was higher than 0.05 so there was no statistically significant differences among the groups.
REFERENCES
[1] Agnieszka Dziadosz and Mariusz Rejment (2015), Risk analysis in construction project-chosen methods, Operational research in sustainable development and civil engineering, Vol. 122, pp. 258-265.
[2] Babak A. Samani and Farzad Shahbodaghlou (2012), A fuzzy systematic approach to construction risk analysis, Journals of risk analysis and crisis response, Vol.2 (4), pp. 275-284.
[3] Caitlyn Davis-McDaniel, Mashrur Chowdhury, Weichiang Pang and Kakan Dey (2013), Fault-Tree model for risk assessment of bridge failure: Case study for segmental box girder bridges, Journal of Infrastructure system, Vol. 19(3), pp. 326-334.
[4] Gholamreza Abdollahzadeh and Sima Rastgoo (2015), Risk assessment in bridge construction projects using fault tree and event tree analysis methods based on fuzzy logic, Journal of risk and uncertainty in engineering systems, Vol.1.
[5] Jamie E. Padgett, Kristina Dennemann, and Jayadipta Ghosh (2010), Risk-based seismic life-cycle cost-benefit (LCC-B) analysis for bridge retrofit assessment, Structural safety, Vol.32, pp. 165-173.
[6] Jelena M. Andric, and Da-Gang Lu (2016), Risk assessment of bridges under multiple hazards in operation period, Safety science, Vol.83, pp. 82-96.
[7] Kansal R. K. and Manoj Sharma (2012), Risk assessment methods and application in the construction projects, International journal of modern engineering research, Vol. 2(3), pp. 1081-1085.
[8] Kinnaresh Patel (2013), a study on risk assessment and its management in India, American journal of civil engineering, Vol. 1(2), pp. 64-67. [9] Nang-Fei Pan (2008), Fuzzy AHP approach for selecting the suitable bridge construction method, Automation in construction, Vol. 17, pp. 958-965.
[10] Naser M. Z. and Kodur V.K.R (2015), A Probabilistic assessment for classification of bridges against fire hazard, Fire safety journal, Vol. 76, pp. 65-73.
[11] Parvathy. P, Shivaprasad H.C, Gopalkrishnan, B. Giridhar, B. Kamath, (2015), Risk assessment using AHP in south Indian construction companies: A case study, International Journal of engineering management and science, Vol. 2(5).
[12] Qing-Fu Li, Peng Zhang, and Yan-Chao Fu, (2012), Risk Identification for the construction phases of the large bridge based on WBS-RBS, Research journal of applied science engineering and technology, Vol. 6(9), pp. 523-1530.