ABSTRACT
SETHAPHONG, LATSAVONGSAKDA. Molecular Recognition and Structural Influences on Function in Bio-nanosystems of Nucleic Acids and Proteins. (Under the direction of Yaroslava G. Yingling.)
This work examines smart material properties of rational self-assembly and molecular recognition found in nano-biosystems. Exploiting the sequence and structural information encoded within nucleic acids and proteins will permit programmed synthesis of
nanomaterials and help create molecular machines that may carry out new roles involving chemical catalysis and bioenergy.
Responsive to different ionic environments thru self-reorgnization, nucleic acids (NA) are nature’s signature smart material; organisms such as viruses and bacteria use features of NAs to react to their environment and orchestrate their lifecycle. Furthermore, nucleic acid systems (both RNA and DNA) are currently exploited as scaffolds; recent applications have been showcased to build bioelectronics and biotemplated nanostructures via directed assembly of multidimensional nanoelectronic devices 1. Since the most stable and rudimentary structure of nucleic acids is the helical duplex, these were modeled in order to examine the influence of the microenvironment, sequence, and cation-dependent
transitional space between adenine and guanosine nucleotides (ApG step) in a sequence proved the most favorable. This work was the first to directly show these subtle interactions of sequence based cationic sequestration and may be useful for controlling metallization of nucleic acids in conductive nanowires. Extending the study further, we explored the degree to which the structure of NA duplexes alone interacted with cations distinct from a specific sequence. Under physiologically relevant conditions, a duplex of RNA polyguanine-polycitidine was highly responsive and able to sequester cations to the middle of the purine stretches. The least responsive structure was a DNA polyadenine-polythymine duplex. A random sequence DNA duplex contorted into an RNA-like helix resulted in cationic
dynamics similar to RNA systems. These studies showed that cation diffusive binding events in nucleic acid duplex structures are sequence specific and heavily influenced by structural aspects helical forms to account for much of the differences observed.
mutations impair local structural flexibility which likely results in cellulose that is produced at a lower rate and is less crystalline. Additional modeling of fragments of cellulose
Molecular Recognition and Structural Influences on Function in Bio-nanosystems of Nucleic Acids and Proteins
by
Latsavongsakda Sethaphong
A dissertation submitted to the Graduate Faculty of North Carolina State University
in partial fulfillment of the requirements for the degree of
Doctor of Philosophy
Materials Science and Engineering
Raleigh, North Carolina
2013
APPROVED BY:
_______________________________ ______________________________ Dr. Yaroslava G. Yingling Dr. Donald Brenner
Committee Chair
DEDICATION
To my family and friends.
BIOGRAPHY
A refugee from Laos, Latsavongsakda Sethaphong grew up in Nashville, TN. He was somewhat of a polymath in high school and thought that he might someday become a
classicist; however, he was never too keen to focus merely on one subject. Fate intervened when he read Richard Feynman’s unique biographical sketches “Surely You’re Joking, Mr. Feynman!”: Adventures of a Curious Character and “What Do You Care What Other People Think?”: Further Adventures of a Curious Character. However, his choice of college emerged randomly after reading the novels of Robert Heinlein. Ultimately, he “sort of” studied physics and a few other things at Harvard College. He found work in California as an engineer, but returned home to Nashville and immersed himself in biophysics at
ACKNOWLEDGMENTS
TABLE OF CONTENTS
LIST OF TABLES ... viii
LIST OF FIGURES ... x
Chapter 1 ... 1
1.0 Introduction ... 2
1.2 Background ... 2
1.3 Biomaterials ... 5
1.3.1 Molecular Recognition... 5
1.3.2 Self Assembly ... 10
1.4 Methods... 16
1.4.1 Molecular Dynamics ... 17
1.4.2 Ab-initio Protein Structure Prediction ... 21
References ... 24
Chapter 2 ... 30
2.1 Introduction ... 31
2.2 Methods... 39
2.3 Results and Discussions ... 42
2.4 Conclusions ... 52
References ... 53
Chapter 3 ... 61
3.1 Introduction ... 63
3.2. Materials and Methods ... 65
3.3 Results and Discussion ... 72
3.3.1. Non random sequences ... 72
3.3.2. Polyguanine RNA and DNA duplexes ... 73
3.3.3. Polyadenine RNA and DNA duplexes ... 79
3.3.4 Helices with random sequences ... 85
3.3.5. Na+ and random helices of RNA versus DNA ... 86
3.3.6 K+ and random helices of RNA versus DNA ... 88
References ... 95
Chapter 4 ... 103
4.1 Introduction ... 105
4.2 Results and Discussion ... 109
4.2.1 An in silico predicted structure of the GhCESA1 cytosolic region ... 109
4.2.2 Comparison between bacterial and plant cellulose synthases ... 113
4.2.3 Genetic mutations demonstrate functional nodes within plant CESA structure .. 115
4.3 Methods and Materials ... 126
4.3.1 Simulations and Modeling ... 126
4.3.2 Novel mutations in Arabidopsis CESAs and phenotypes of mutant plants ... 127
References ... 129
Chapter 5 ... 134
5.1 Introduction ... 135
5.2 Results ... 139
5.2.1 Decoy Production Analysis... 139
5.2.2 Plant Conserved Region ... 140
5.2.3 Class Specific Region ... 144
5.2.4 Protein Motifs ... 146
5.2.5 MD Analysis ... 149
5.3 Discussion ... 149
5.3.1 Rosette Formation and Hierarchy of Terminal Complex Assembly ... 149
5.3.2 Achieving material control of cellulose ... 152
5.3.3 Resolving Paradoxes ... 155
5.4 Methods... 159
5.5 Conclusion ... 161
References ... 161
Chapter 6 ... 168
6.1 Background ... 169
6.2 Methods... 172
6.3 Results ... 173
6.3.2 Predicted BcsA vs true Structure ... 178
6.3.3 Predicted Transmembrane Assembly of a Cellulose Synthase ... 181
6.4 Discussion ... 186
6.5 Conclusion ... 187
References ... 188
Chapter 7 ... 192
7.0 Future Directions ... 193
7.1 Nucleic Acids as Nano-materials ... 193
7.2 Synthases and Synthetic Biology at the Membrane Interface ... 194
7.3 Ascertaining mechanism of Isoxaben resistance ... 195
7.4 Role for distal N-terminus membrane helices ... 198
References ... 199
APPENDICES ... 202
Appendix A Chapter 4 Supplmental ... 203
Appendix B Chapter 5 Supplemental ... 230
LIST OF TABLES
Table 1.1: Representative Mechanical Strength of Materials versus
Nanocellulose. ArboraNano Inc. ... 13 Table 2.1: Simulations of TAR and TAR-like Sequences Performed under
Solvent Conditions as Indicated ... 38 Table 2.2: Cationic Occupancy Statistics Calculated from 20 ns MD Simulations... 48 Table 3.1: Major and minor groove parameters of simulated duplexes and X-ray
structures ... 75 Table 3.2: Interaction energies of high residency ions with specific residues of
RNA and DNA after truncating the first 2ns and analyzing the
remaining 18ns. ... 77 Table 3. 3: Occupancy and lifetimes of Na+ hydrogen bonding to RNA and DNA
polypurine duplexes. ... 78 Table 3.4: Occupancy and lifetimes of Na+ hydrogen bonding to RNA and DNA
polypurine ... 81 Table 3.5: Occupancy and lifetimes of K+ and Na+ minor groove binding to
identical random sequences of RNA and DNA after truncating the first
2ns and analyzing the remaining 18ns. ... 82 Table 3.6: Occupancy and lifetimes of K+ and Na+ major groove hydrogen
bonding to identical random sequences of duplex RNA and DNA (cut
off distance is 3.8 Å for K+; 3.2 Å for Na+). ... 87 Table 4.1: Plant phenotypes for new CESA mutations. Significantly different
compared with wild-type (LER or Col-0) as determined by t test: * P<
0.001; **P=0.009; ***P<0.01. RCI, Relative crystallinity index. ... 115 Table 6.1: Folding Statistics. Clusters were evaluated on the top 10% best
scoring subpopulations with the maximum entropy approach of the
Table 4S.1: The PDB identification numbers, E-values, and snapshots of
structures used in predicting the structure of the β-sheet region of the GhCESA1 cytosolic region using Hidden Markov chain modeling. During the selection of the top models, the SAM-T08 generates pairwise alignments of the target sequence and the best-scoring templates, which are adjudicated by E-value representing how many sequences would score this well in the database. Structures with E-values of less than about 1.0E-5 are very likely to have a domain of the same fold as the target. Structures with E-values of larger than about
0.1 are very speculative. ... 211
Table 4S.2: Structure quality scores... 214
Table 4S.3: Identity and locations of Gh506 structural features. Entries are in order of appearance in the GhCESA1 cytosolic sequence that was used to generate the Gh506 structure (Fig. 1B). Five of these α-helices are designated “core α-helices” because they co-align in the superimposed GT-2 domain of BcsA and the predicted Gh506 structure. Amino acid residue numbers are relative to full-length GhCESA1 (NCBI Accession P93155) or BcsA (NCBI Accession Q3J125; PDB ID 4HG6). Functions ascribed to BcsA are from Ref. [25]. ... 217
Table 4S.4: Summary stability measurements measured as root mean square deviation (RMSD) from the initial structure on the whole structure and on key secondary structure elements of the CESA as a result of mutations over a window of 10 ns. ... 225
Table 5S.1: Genbank sequences ... 234
Table 5S.2: Top 1K Cut Decoy Results – Plant Conserved Region ... 235
Table 5S.3: Top 1K Cut Decoy Results – Class Specific Region ... 235
Table 5S.4: MM/GBSA Calculations: Free energy of best centroid cut from the top scoring models form the last 2ns of MD in explicit solvent. ... 237
Table 5S.5: TM-Align Scoring of Minimized Structures ... 238
LIST OF FIGURES
Figure 1.1: Typical helical duplexes of Nucleic acids. A-form helix of RNA. (b)
B-form helix of DNA ... 7
Figure 1.2: Sugar pucker: (a) 2’Endo as seen in DNA. (b) 3’ Endo as seen in RNA. The lack of a 2’OH group renders DNA more flexible. ... 7
Figure 1.3: Depiction of cellulose from the plant wall to its monofilament. (Adapted from Cranston, ED. (2012) “Mechanical Testing of Thin
Film Nanocellulose Materials.”) ... 11
Figure 1.4: Nanocellulose as a biocompatible tissue scaffold. Bodin et al. 200733. ... 12
Figure 1.5: General topology of cellulose synthase glycosyltransferases. PCR is the plant conserved region, an CSR is the class specific region. There are 8 transmembrane helices in total. Adapted from Roberts et al. 44. D1-3 are conserved aspartic acid motifs. The QxxRW motif is thought to hold the glucan chain as it grows, and is found in all processive glycosyltransferases including chitin synthase. The zinc finger is at
the N terminus and thought to allow other protein-protein interactions. ... 15
Figure 1.6: Cellulose microfibrils formed polymerized by rosettes (Neville 1993). ... 16
Figure 1.7: Diagram of Basic Molecular Dynamics Methodology ... 19
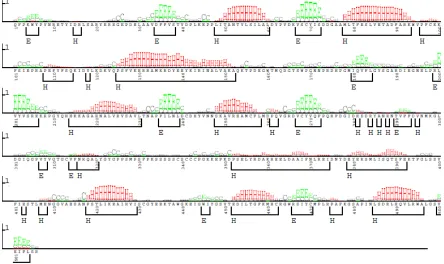
Figure 1.8: SAM T08 Secondary Structure Prediction where E labels correspond to beta strands and H labels are alpha helices. Everything unlabeled is a
random coil. ... 22
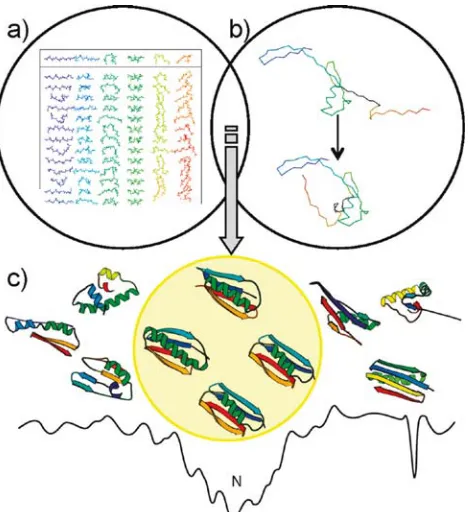
Figure 1.9: ROSETTA starts from (a) fragment libraries with sequence-dependent ( and ψ) angles that capture the local conformational space accessible to a sequence. (b) Combining fragments from the libraries, ROSETTA folds the protein by optimizing non-local contacts. A low-resolution energy function smoothes the energy surface, to funnel the structure toward a native conformation as denoted by “N” (c). Metropolis Monte Carlo minimization drives the structure toward the global
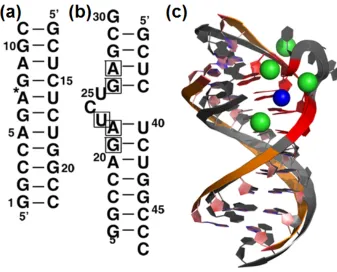
Figure 2.1: (a) Sequence of the helical stem used in this study with a star denoting the lcoatino of the removed bulge. (b) Sequence of TAR RNA duplex (PDB id 397D) with boxed nucleotides important for Tat binding. (c) Superimposition of TAR RNA crystal structure (grey) with four bonded calcium ions (yellow) and a snapshot from MD simulations of a TAR-like RNA helix (orange) and the highest occupancy sodium ion
(green) and potassium ion (blue). ... 36
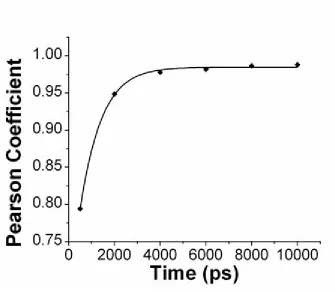
Figure 2.2: Pearson correlation coefficient calculated for ionic occupancies by an atom between two symmetric halves of a polyG/polyC helix as a function of time. Diamonds indicate MD results from 0 to 10ns. The
solid line indicates an exponential fit of the data. ... 41
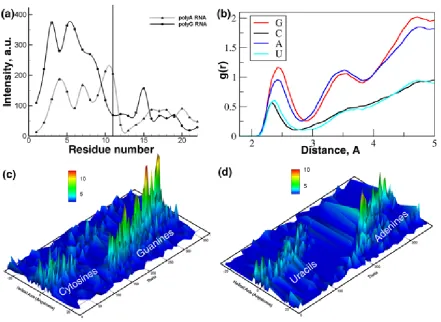
Figure 2.3: Sodium ion interactions with polyA/polyU duplexes and polyG/polyC duplexes. (a) Cationic association bins per residue for polyA/polyU and polyG/polyC duplexes. Vertical lin denotes the strand break. (b) RDFs of sodium ions with guanine, adenine, cytosine, and uracil. (c,d) Surface map of the sodium occupancy for (c) polyG/polyC and (d) polyA/polyU duplexes calculated for rotational angle around the
helical axis. ... 45
Figure 2.4: Sodium and potassium ion interactions with TAR-like sequence. (a) Cationic association bins per residue in different solvents. (b) Na+ -- purine N7 RDF in mixed solvent solution. The inset representsthe observed movement of the cation around A7. (c,d,e) Surface map of the cationic occupancy within the TAR-like duplex calculations: (c) K+ in 0.1 KCl simulations, (d) Na+ in 0.1 NaCl simulations, and (e)
cations in mixed 0.1 NaCl and KCl solutions. ... 47
Figure 3.1: Convergence of the Pearson correlation coefficient for DNA and RNA helix systems of a random sequence thru 10ns. (a) B-form DNA duplex systems of a random sequence with 0.1M counterions of KCl and NaCl converged to a 0.76 ± 0.042 Pearson correlation coefficient by 10 ns; by 10 ns, a 0.76 Pearson correlation coefficient between a NaCl system versus mixed KCl and NaCl was reached for cationic occupancies at residue resolution. (b) A-form RNA duplex systems of a random sequence with 0.1M counterions of KCl and NaCl converged to a 0.79 ± 0.038 Pearson correlation coefficient by 7 ns; by 10 ns, a 0.92 Pearson correlation coefficient between a NaCl system versus mixed KCl and NaCl was reached for cationic occupancies at residue
Figure 3.2: Ion interaction frequency in arbitrary count every 20ps of the last 8ns in the polypurine sequence trajectories for DNA and RNA in 0.1M
sodium. ... 70
Figure 3.3: Ion interaction frequency in arbitrary count every 20ps of the last 18ns
in the random sequence trajectories for DNA and RNA. ... 71
Figure 3.4: Modeled RNA and DNA helices (a) Polyguanine RNA sequence. (b) 3’Endo Sugar Pucker of RNA’s backbone. (c) Polyguanine DNA
sequence. (d) 2’ Endo Sugar Pucker of DNA’s backbone. ... 78
Figure 3.5: Heat maps of cumulative diffusive residencies of individually tracked sodium cations within 5 Å of a nucleobase in polyguanine duplexes of
RNA and DNA. ... 79
Figure 3.6: Modeled RNA and DNA helices (a) Polyadenine RNA sequence. (b) Chemical structure of the nucleobase Uracil. (c) Polyadenine DNA
sequence. (d) Chemical structure of the nucleobase Thymine. ... 81
Figure 3.7: Heat maps of cumulative diffusive residencies of individually tracked sodium cations within 5 Å of a nucleobase in polyadenine duplexes of
RNA and DNA. ... 84
Figure 3.8: Cumulative residencies of cations in the cation-duplex modeled systems: Sodium cation diffusive interaction events within 5Å to non alternating tracts of purine nucleotides in RNA and DNA duplexes simulated to 10ns. On the x-axis, residues 1-11 are the purines, and
residues 12-22 are the pyrimidines. ... 85
Figure 3.9: Modeled RNA and DNA duplexes (a) RNA random sequence. (b) A-RNA helical structure colored to show electrostatic surface, red is negatively charged. (c) DNA random sequence. (d) B-DNA helical
structure for the random sequence; red is negatively charged. ... 85
Figure 3.10: Heat maps of cumulative diffusive residencies of individually tracked sodium cations within 5 Å of a nucleobase for duplexes of RNA and
DNA of identical random sequences. ... 88
Figure 3.11: Heat maps of cumulative diffusive residencies of individually tracked potassium cations within 5 Å of a nucleobase for RNA and DNA
duplexes of identical random sequence. ... 89
Figure 3.12: Heat map of cumulative diffusive residencies of individually tracked sodium cations within 5 Å of a nucleobase for A-DNA of a random
Figure 3.13: Cumulative residencies of cations in the cation-duplex modeled systems: Sodium and potassium ion interacting within 5 Å of a
nucleobase in random sequence duplexes of RNA and DNA. On the x-axis, residues 1-11 are the purines, and residues 12-22 are the
pyrimidines. ... 93
Figure 4.1: Predicted structure of the large cytosolic region of GhCESA1. (A) Diagram of GhCESA1 showing 8 predicted TMH and the large cytsolic loop between TMH2 and TMH3. Labels within the cytosolic loop indicate: the approximate locations of the four conserved motifs; the P-CR region; the CSR region; and the analogous locations for missense mutations in Arabidopsis CESAs that perturb cellulose synthesis (black and red type for published or newly reported mutations, respectively). (B) Snapshot of the Gh506 structure. The catalytic core is grey, the P-CR is pink, and the CSR is light blue. The catalytic core contains a ß-sheet with six strands in yellow (β-1 S287-S291; β-2 D253-S257; β-3 F454-D459; β-4 C532-N535; β-5 Y488-F491; and β-6 S686-C689). Green highlights DD, DCD, ED (directly behind DCD), and the position of QVLRW within core α-13. The five helices that are part of the GT core are labeled: [2 L267-A278; α-6 H433-V448; α-7 N4α-6α-6-D479; α-8 N508-K517; and α-13 S705-R725 (containing QVLRW). All predicted α-helices are numbered in order within the primary sequence. (C) Diagram of the secondary structure showing a total of 6 ß-strands (yellow arrows) and 13 major α -helices (shown as barrels) in three regions: catalytic core (red outlines); P-CR (pink fill); and CSR (blue fill). Possible additional shorter helical regions are indicated as unnumbered small barrels. (D) UDP-Glc
docked into the catalytic site above DCD. ... 107
Figure 4.2: Possible oligomeric assemblies of the Gh506 cytosolic structure under (A) C2, (B) C3, (C) C4, and (D) C6 crystallization symmetries. The catalytic region is grey, the CSR is light blue, the P-CR is pink, QVLRW is yellow and the site of fra6 mutations is red. (D) Bottom,
Figure 4.3: Comparison of the Gh506 model with the structure of bacterial cellulose synthase. (A) Surface representation of the Rhodobacter sphaeroides (Rs) cellulose synthase (PDB ID 4HG6) superimposed with the Gh506 structure. The model aligns well with the central β-sheet of the bacterial GT-domain, and the P-CR and CSR domains point away from the membrane-spanning region. UDP and the translocating glucan of the Rs cellulose synthase highlight the active site and the TM-channel and are colored violet and cyan, respectively. The BcsA subunit of the Rs cellulose synthase complex is colored gray and green, respectively, BcsB is colored wheat. (B) Superimposition of the Rs GT-domain with the Gh506 model by secondary structure of the central β-sheet. The GT-domain is colored green for RsBcsA and gray and yellow for the GhCESA1 model, respectively. The
GhCESA1 P-CR and CSR domains are colored pink and light blue, UDP and the glucan are shown as spheres. (C) Conserved sequence motifs that form the binding site for UDP and the acceptor glucan are compared with the corresponding residues in RsBcsA. The Rs and Gh sequence alignments of the motifs are shown and the depicted residues are indicated in bold (black: Rs, blue: Gh). RsBcsA is shown in gray and the UDP and glucan bound to Rs BcsA are colored violet and cyan, respectively. Residues from Gh506 are colored blue. The ED motif was omitted for clarity. Horizontal bars indicate the membrane
boundaries. ... 114
Figure 4.4: Previously known missense mutations (green) in Arabidopsis CESAs mapped onto the predicted GhCESA1 cytosolic structure. New
mutations are blue with the DD, DCD, ED, and QVLRW motifs in red. Two opposite rotations (a) and (b) provide a view of where the
mutations map relative to the catalytic region of the Gh506 structure. The equivalent Ghcesa1 amino acid position precedes the mapped mutation: R351 (Atcesa8R362K, fra6); A436 (Atcesa3A522V, eli1-2); A447 (Atcesa1A549V, rsw1-1); D459 (Atcesa7D524N, irx3-5); P492 (Atcesa7P557T, fra5 and Atcesa3P578S, thanatos); G529 (Atcesa1G631S, rsw1-2); G531 (Atcesa3G617E, cev1) ; S668 (Atcesa3S679L, irx1-2); E671 (Atcesa1E779K, rsw1-45); D672 (Atcesa3D683N, irx1-1 and Atcesa1D780N , rsw1-20); and H680 (Atcesa7H734Y, mur10-2). The conserved residues
Figure 4.5: The locations of novel missense mutations in the predicted structure helped to support the existence of new functionally important regions within CESA. Conserved residues are shown in red. (A) S291 (teal) just below DD is the analog of the novel Atcesa3S377F, ixr1-6, mutation. In the predicted structure, it contacts L442 (rust ball and stick residue) within α-6 (rust), which has the analogs of Atcesa3A522V (eli1-2; brown) and Atcesa1A549V (rsw1-1; tan) at either end. (B) The P492-G518 loop (brown) contains native aspartates (green ball and stick residues) near QVLRW. At its base are G518 (blue; the analog of the novel Atcesa1G620E, lycos, mutation) and P492 (rust; the analog of Atcesa7P557T, fra5), where they may putatively act as hinge points. (C) Cross correlation of atomic fluctuations at four mutation sites over all simulations by residue. The peaks shown had at least 97% correlation, indicating distant effects of the mutations analogous to Atcesa3S377F (ixr1-6; blue bars), Atcesa1G620E (lycos; green bars), and Atcesa7P557T
(fra5; red bars). ... 123
Figure 5.1: Putative homomeric-hexamer rosette assembly. (a) Class Specific Region b) Plant Conserved Region (FRA6 mutation amino acid position is in red) c) A putative hexameric assembly of a rosette, for scale, cryo-em image of a Terminal Complex comprised of six rosettes
is shown from Kimura 1999. ... 137
Figure 5.2: Representative Folding Funnels of Primary and Secondary PCR’s and CSR’s. The y-axis is calculated as RMSD values from the lowest scoring decoy. The x-axis is the score in terms of Rosetta Energy Units (R.E.U.). (a) PCR3 density plot (b) PCR3 folding funnel (cluster of interest is in red) (c) CSR3 density plot (d) CSR3 folding plot (cluster of interest is in red) (e) PCR7 density plot (f) PCR7 folding plot (cluster of interest is in red) (g) CSR7 density plot (h)
CSR7 folding plot (cluster of interest is in red). ... 139
Figure 5.3: Primary (a-c) and Secondary (d-f) PCR’s. (a) PCR1 (b) PCR3 (c) PCR6 (d) PCR4 (e) PCR7 (f) PCR8 (g) Secondary structure block diagram labeled according to each PCR. The N-terminus is to the left
for the block diagram. ... 141
Figure 5.4: Comparison of Wild Type PCR of Atcesa8 and the FRA6 mutant. (a) Folding funnel of PCR8 (b) Folding funnel of FRA6 mutant (c) Secondary structure comparison with tertiary alignment. An asterisk over the top block diagram is the lysine mutant of FRA6. The bottom block diagram is that of PCR8. Helices are in red with disordered
Figure 5.5: Electrostatic surface potential of the Wild Type Atcesa8 PCR (a) and
FRA6 (b). ... 144
Figure 5.6: Primary and Secondary CSR’s: (a) CESA1 (b) CESA3 (c) CESA6 (d) CESA4 (e) CESA7 (d) CESA8 (g) Secondary Structure layout of a-f.
The N-terminus is to the left for the block diagram. ... 145
Figure 5.7: Electrostatic surface potentials of the primary versus secondary wall associated class specific region folded fragments. CSR1 (a), CSR3 (b),
CSR6 (c), CSR4 (d), CSR7 (e), and CSR8 (f). ... 147
Figure 5.8: Unified Trimer of Dimers CSC model to deconflict the results of
Carroll et al.25 and Wightman et al.52 ... 155
Figure 5.9: Walker P Loop (GXXXGK[T/S]) of CSR1 highlighted in magenta with the serine and arginine in line form. The loop is a binding motif
for the phosphate of nucleotides. ... 157
Figure 6.1: General topology of plant cellulose synthases (a) adapted from Harris et al. 20121. Eight membrane spanning helices are enumerated as shown. Transmembrane 5 and 6 are connected by a very long outer membrane loop with a unique amphiphatic structure. Psipred
alignment and secondary structure prediction(b). Underlined in green are the regions the OCTOPUS topology server predicted to reside within the plasma membrane. Helices are in red with beta strands in
yellow. The length of each segment is annotated to the right. ... 175
Figure 6.2: Folding Funnels for TMH5 & 6: Atcesa1 (a); Atcesa3 (b); Atcesa6 (c); Atcesa3T942I (d). Highest densities are in red. The biphasic folding patterns of the wild type sequences (a-c) contrast greatly with the
multiple subpopulations seen in T942I (d). ... 176
Figure 6.3: Representative of best centroid decoys for the transmembrane helices 5 and 6 from all the CESAs and the mutant T942I. Atcesa1 (a),
Atcesa3 (b), Atcesa6 (c), Atcesa3T942I (d). ... 177
Figure 6.4: Best scoring decoys for the transmembrane helices 5 and 6 from the primary wall associated CESAs and the mutant T942I. Atcesa1 (a),
Figure 6.5: Prediction of a membrane associated helix pair in BCSA
corresponding to helices 5 and 6 of CESAs in Arabidopsis. The folding funnel plot does not indicate a biphasic folding path with over 21K decoys generated (a). The difference between the centroid of the
largest cluster (b) and the best scoring decoy (c) are very slight. ... 178
Figure 6.6: Comparing the Rosetta predicted structure with that of the actual crystal structure corresponding to TMH56 of plant CESA (blue). The recently solved structure of BcsA (PDB ID: 4HG6) (a). RMSD fit to the crystal structure: 9.899 Å for the best cluster centroid (orange) with 59 residues aligned (b); 8.734 Å for the lowest energy structure (red) with 58 aligned residues (c). Since the lowest energy structure also bears close resemblance to the centroid of the largest cluster such that
the fittings are almost the same. ... 180
Figure 6.7: Membrane organization of helices 3-8 of Ghcesa1 from composite predictive runs of four helix bundles aligned on TMH 5 and 6. TMH3 (magenta); TMH4 (wheat); TMH5(grey); TMH6(orange); TMH7 (red); TMH8 (blue). Inner cytosolic region is down. The linker between TMH 5 and 6 display bistability between the best scoring decoys (a) and the best centroid (b) alignments. The beta sheet from of the linker is in yellow (a) and assumes a conformation of random coils and small helices in cyan (b). A semblance of a pore is visible in (c) where the cavity is taken up by the unusual beta sheet formation
(yellow) of the linker between TMH 5 and 6. ... 182
Figure 6.8: Membrane organization of helices 3-8 of Ghcesa1 with the Atcesa3T942I amino acid mutation from composite predictive runs. TMH3
(magenta); TMH4 (wheat); TMH5(grey); TMH6(orange); TMH7 (red); TMH8 (blue). The alignments are rather poor for the best scoring decoys (a). The centroids of the largest clusters also do not
show a real pattern (b). ... 185
Figure 7.1: Isoxaben (a) targets CESA3 and CESA6, and ethyl-methanesulfonate
(b) ... 196
Figure 7.2: Membrane organization of helices 3-8 of Ghcesa1 from composite predictive runs of four helix bundles aligned on TMH 5 and 6. TMH 3 (magenta) and TMH 8 (blue). Inner cytosolic region is down. The linker between TMH 5 and 6 display bistability between the best scoring decoys (a) and the best centroid (b) alignments. The beta sheet from of the linker is in yellow (a) and assumes a conformation of
Figure 7.3: The N-terminal helices (TMH 1 and 2)with the first C-terminal transmembrane helix (TMH 3) from Ghcesa1: TMH1 (orange); TMH
2(red and pink); TMH 3 with artificial linker (cyan). ... 198
Figure 4S.1: Residues from GhCESA1 that were included in the Gh506 structure are aligned with the same regions of Arabidopsis CESAs with
missense mutations. Numbering is relative to residue position in full length GhCESA1. Pink and blue lines indicate the positions of the P-CR and CSR plant-specific regions, respectively. Red and yellow rectangles indicate α-helices and β-sheets, respectively. By comparison to the structure of RsBcsA (see the main text), α-2,6,7,8,13 and β-1–6 are predicted to be in the core GT domain. Light purple vertical highlights show the position of selected conserved domains. Large green letters indicate sites of missense mutation in the AtCESA
indicated. ... 209
Figure 4S.2: (A-C) Aligned structures used in model prediction as listed in Table 4S.1. Side of the β-strands (A) colored by individual structure and (B) colored by secondary structure. (C) View of the slice to expose the β-sheet region, with individual β-strands numbered ß1–ß6. (D)The snapshot of the starting structure of the Gh506 cytosolic domain from the SAM-T08 HMM structure prediction server. (E) The predicted structure after molecular dynamics refinement with six β-strands in yellow and DD, DCD, and ED in green. The α-helices dispersed
throughout the structure are red. ... 210
Figure 4S.3: A similar prediction of the secondary structure was obtained using PSIPRED v3.3. Highest confidence prediction areas are given a value of 9, lowest 0. The DCD putative UDP binding motif, reidues 459-461, are at the tip of a ß-strand. The ß-strands highlighted in red were lost with MD refinement. In contrast, a low coil confidence area highlighted magenta (686-689) became a ß-strand. Greyed boxes did not appear in the final structure due to their low confidence levels. Yellow highlights the retained ß-strands. Green boxes highlight the
Figure 4S.4: Comparison of the quality of the Gh506 structure to experimentally solved structures. (A) Pro-SA Z scores for various stages of
GhCESA1 structure prediction (labeled green, black, and red dots) compared to scores of solved structures from the PDB databank (dense blue dots). The initial Z score of the predicted GhCESA1 cytosolic structure (-3.4, green dot) was improved to -5.56 (black dot) after about 4 ns of MD refinement and reached -6.09 (red dot) after a series of MD simulations followed by a short minimization. (B) ERRATv2 analysis of the predicted GhCESA1 cytosolic structure (i) and the solved structures of three other GT-2 enzymes used as templates [ii, K4CP domains A and B (PDB: 2Z86); iii, SpsA (PDB: 1QG8); and iv, a putative glycosyltransferase from Bacteriodes fragilis (PDB:
3BCV)]. The histograms show the error value of residues, and the band in the middle of the graph indicates the difference between the lower 95% and the upper 99% value. Of the three crystal structures, the 218 amino acid structure of 3BCV from Bacteriodes fragilis exhibited the best score with only B chain residue 40 showing significant error. Areas possibly in need of further refinement in the GhCESA1 predicted structure include residues that either have high local mobility or are deeply buried: (1) N457-V464; (2) D253-V256 that form a ß-strand adjacent to the putative UDP binding motif, DCD, in the catalytic core; (3) solvent-exposed P327-I335 that fold back into residues V347-R355 within the P-CR region; (4) P492-G518 that appear to form a loop beside the catalytic site that abuts the QVLRW motif. Even for the SpsA structure, similarly buried residues are nearly impossible to refine fully. For K4CP, core residues around the UDP binding motif of domain “B” shows the greatest error values, probably because they are more mobile and solvent accessible. Similarly, a small region near the UDP-binding motif of SpsA (residues 130-135) also exhibits error values greater than 95% as exemplified by the filled
in black bars. ... 215
Figure 4S.5: Interaction of manganese uridine diphosphate glucose (MnUDP-G) complex with residues of the modeled CESA. The positions of the “D” residues were taken from the CESA structure generated in this study and all atomic positions were allowed to relax to minimum energy positions determined by our DFT methodology. Mn-O distances to carboxylate group of the D residues and to the diphosphate moiety of UDP are given in Angstroms. H=white; C=grey, O=red, N=blue, P=orange, Mn=green. This geometry was used to dock the UDP-Glc
Figure 4S.6: Three loops (upper left corner of the image) in the vicinity of the UDP-Glc binding site of the Gh506 structure that may help to control catalysis through modulation of local accessibility to key residues: (1) T258–L267 at the end of β-2 (green); (2) A294-F300, just after DDG and leading into α3 of the PCR (orange); and (3) Y421-H432, leading from α5 into core α6 (aqua). The conserved motifs, DD, DCD, ED, and QLVRW are highlighted red, the β sheet is yellow, the P-CR is
pink, and the CSR is blue. ... 221
Figure 4S.7: Correlated residue motions via atomic fluctuations. The CSR region, residues Y540-W658, shows the greatest motion correlation to itself as expected. The P-CR region, residues A295-V420, shows a
self-correlation as well, but not as strong since it is less ordered. ... 222
Figure 4S.8: Top left view: A possible hexameric assembly of one CESA cytosolic domain isoform (the predicted structure from GhCESA1). One
monomer is shown in the ribbon diagram at the top, showing the location of the barely visible ß-sheets (yellow) below motifs with conserved D residues (green). The catalytic regions of the other
monomers are shown in aqua, magenta, yellow, orange, and dark blue. The light blue and pink regions are the CSR and the P-CR regions, respectively, for all monomers. Top right view: Possible packing of hexameric assemblies into an orthorhombic unit cell of space group P212121 (red box). Note that this theoretical possibility for
crystallization of hexamers of the predicted GhCESA1 cytosolic region does not imply any preference for hexameric subunits of the rosette CSC in vivo. The number of CESAs in the rosette CSC remains
an open question. ... 223
Figure 4S.9: A comparison between Gh506 and RsBcsA sequences and structures. (A) A sequence alignment of a cytosolic region for GhCesA1,
AtCesA1, and RsBcsA. (B,C) A top and bottom view of structural alignment between Gh506 (red) and RsBcsA (blue) without the regions that do not have a template and the region shaded blue. This reduced both structures to the GT-A core and the structures align with
an overall RMSD of 3.9 Å. ... 224
Figure 4S.10: Hydrogen bonding of P492T to Y688. The distance cut off is 3.5 Å. The strongest interactions during this time interval for GhcesaP492T is before the 4 ns mark. This interaction may serve to stabilize the
Figure 5S.1: Sequence alignment of PCR’s: Ranked by descending similarity. Consensus regions are underscored with black boxes. Two regions of
high variability are boxed in red. ... 231 Figure 5S.2: Sequence Similarity of Arabidopsis PCR’s (no. 11 corresponds to
Ghcesa1) ... 232
Figure 5S.3: Sequence alignment of CSR’s: Ranked by descending similarity. Consensus regions are underscored with black boxes. Two regions of
high variability are boxed in red. ... 233
Figure5S.4: Sequence Similarity of Arabidopsis CSR (no. 11 corresponds to
Ghcesa1) ... 234
Figure5S.5: Folding plots of primary and secondary associated PCRs: PCR1 (a),
PCR3(b), PCR6(c), PCR4(d), PCR7(e), PCR8(f)... 236
Figure 5S.6: Folding plots of primary and secondary associated CSRs: CSR1 (a),
Chapter 1
1.0 Introduction
As the ability to manipulate matter at the nanoscale improves, it becomes increasingly important to understand the laws and principles that permit an efficient (economic) molecular assembly of new materials and engineer properties that fit a functional application. These may be the design of sensors, electronic and photonic devices, and structural composites. Nature has solved the assembly problem in bio-nanosystems in order to generate biopolymers such as nucleic acids, proteins and polysaccharides such as cellulose. The synthesis of new materials in biological systems is largely accomplished by protein synthases that are able to selectively recognize their substrates and alter the physical properties of their product. Bio-nanotechnology is an emergent field that promises to deliver significant advances for industries reliant on natural materials as well as engendering new technologies for applications in green chemistry, therapeutics, sensors, hybrid nano-composites and construction. Despite this array of potential applications and development, there still remains a paucity of fundamental insights into the basic mechanisms that nature exploits in order to achieve programmable self-assembly of molecules at the nanoscale resulting in macroscopic structures.
1.2 Background
hydrocarbon resources are located in geopolitically unstable areas. Furthermore, worldwide consumption of building materials largely focuses on wood. In order to meet the challenges of discovering renewable energy resources and replacing functional materials derived from finite resources, bio-inspired nanotechnologies offer limitless potential. Operating at the nanoscale in dimensions of 1 to 100nm, nanotechnology can meet the need for clean energy, green chemistry, advanced therapeutics, and atomic level fabrication of novel electronics.
A class of biomaterials of considerable interest are nucleic acids due to their intrinsic properties as polyelectrolytes, molecular recognition capabilities, and ease of incorporation into hybrid polymers1 and functionalized hydrogels2,3. As a renewable resource, nucleic acids are produced by every living organism. Nucleic acids can be given additional functions by being conjugated to other materials or be used as a scaffold in order to create patterned 3-D structures4. Of these applications, DNA based templating of nanostructures is also showing promise. The mechanical, electrical and optical properties of these materials are tunable1 as evidenced by using DNA in a copolymer doped for lasing applications5,6. Since these applications rely on nucleic acid base-pairing and molecular recognition, understanding how to finely tune these properties is vital toward creating an all organic engineered system with the desired properties suitable for its intended purpose.
nanocomposites7. Unlike most nanomaterials, cellulose is both cheap to manufacture and relatively nontoxic; carbon nanotubues (CNT) cost between $50 to $500 per kilogram8 and generally act like asbestos fibers 9 with debate remaining on single walled CNTs10; synthetic DNA still costs several thousand dollars per gram (Oligofactory Inc.); in contrast, the US Forrest Service expects to sell nanocellulose for a few dollars per kilogram.
But it is in the field of renewable energy where much of the interest in cellulose lies. The first challenge for is to develop economical ways to free cellulosic fibrils from source material11. Cellulosic ethanol is a desirable alternative to corn-based ethanol since it will not compete with the food supply. Ethanol use in gasoline fuels reduces smog since it is 36% by weight oxygen, helping to provided complete combustion and avoid the use of toxic
chemicals based on benzene such as Methyl tert-butyl ether (MBTE). As a structural
ab-initio structure prediction methods to generate a likely 3-D structure. After assessing its quality, we mapped the single point mutations to this structure and subjected each mutant to computational analysis. By examining the structure of these mutants relative to the normal wild type, it will be possible to design new proteins that will allow for the tuning of cellulose to have defined properties. Developing economical cellulosic ethanol will reduce the current reliance on corn based ethanol which competes as a food source; when these dual use crops are affected by adverse harvests, then result is higher food prices.
1.3 Biomaterials
1.3.1 Molecular Recognition
Molecular recognition in biology is a central requirement in order to achieve specificity of reaction and the correct function of signaling pathways in the crowded macromolecular environment of living cells. These interactions are non-bonded and
typically rely on hydrogen bonding, solvent effects, van der Waals forces, - interactions,
and electrostatic effects. From these sets of forces, biological materials, like nucleic acids, can selectively bind everything from large macromolecules to small cations.
1.3.1.1 Nucleic Acids
The most error-sensitive biological processes involve genetic transcription and genomic repair. Nucleic acids follow a simple rule based method of molecular recognition through complementary base pairing. Because of this trait, nucleic acids have been
are of two varieties, ribonucleic acid (RNA) or deoxyribonucleic acid (DNA). Nucleic acids encode the genetic information of all living cells. RNA’s sugar contains a 2’OH group unlike DNA. Both exist as polymers of nucleotides that contain a five-membered ribose sugar as a backbone and a nucleotide base. They share the same purine bases of adenine (A) and guanine (G), one pyrimidine, cytosine (C); however, they differ with the complement to adenine where it is thymine (T) for DNA and uracil (U) for RNA. Consequently, the
spontaneous cleavage. This structural disorder and affinity for self cleavage allows RNA to take part in biochemical reactions. Because of its relative stability, DNA is the nucleic acid of choice for genetic storage and it can be wound tightly around histone proteins to provide a compact structure that is further assembled into chromatin. This self regulating nature of nucleic acids arises from their structural motifs and charged surface landscape associated with these duplex structures.
Figure 1.1: Typical helical duplexes of Nucleic acids. A-form helix of RNA. (b) B-form helix of DNA
1.3.1.2 Nucleic Acid Secondary Structures as Recognition Motifs
In nucleic acids, the number of possible secondary structures is approximately 1.8N, where N is the number of nucleotides13. Despite this large conformational space of
1.3.1.3 Nucleic Acid Structure Influence by Small Monovalent Cations
In order to assume their secondary structural forms, both DNA and RNA must rely on metal cations to provide charge screening of their highly negative phosphate backbones. The bases themselves also exhibit small dipole moments that may sequester small cations and thereby perturb the secondary structure17. Consequently, these structures are also amendable to influence by the ionic environment such that some bacteriophage viruses utilize sequence dependent cation recognition motifs to regulate genetic expression; and thereby, reduce delay in the transcription process when cations are used as a control signal18,19. The susceptibility toward discernable structural changes of the duplexes induced by the ionic environment for these kind of regulatory processes appear to be sequence dependent20. Moreover,
monovalent cations are of interest since both RNA and DNA can be highly sensitive to their cytosolic concentration and species resulting in adaptive recognition18,21-23.
1.3.1.4 Materials Science of Nucleic Acids
Conjugated nucleic acids with nanomaterials are unusually stable compared to proteins24. For this reason, they make ideal platforms for sensor development where their complementary Watson-Crick type hydrogen bonding, stacking interactions and
medium to control the dispersion of photoactive substrates as well as metallization in
applications involving optoelectronics, photonics and as organic semiconductors. Even with the influence of sequence on structure, nucleic acids must first rely on cationic charge compensation which is a first order effect. For this reason, we investigated the role cations have on structure which will ultimately allow for the fine tuning of the secondary structures and their recognition properties of interest that emerging nanotechnologies depend upon.
1.3.2 Self Assembly
Self assembly is the process in which molecular nanostructures self-organize. The forces that drive this process occur between individual molecules, between the atoms that make up the molecule and the microenvironment. These materials spontaneously create increasingly complex structures given suitable conditions. All natural biomaterials are formed in this manner.
1.3.2.1 Materials Science of Cellulose
Cellulose is the most abundant renewable biomaterial; approximately 1011 metric tons is produced annually on earth. Cellulose exists as a linear polysaccharide polymer of
semicrystalline fibrils (Figure 1.3). Each microfibril is estimated to be 3nm thick and made up of 36 crystalline chains26. The highly crystalline nature of cellulose protects it from chemical attack and confers considerable strength on the order of 128 GPa27. At
from each other to assume a non-planar orientation. The length of these polymeric chains is estimated to be upwards to 15,000 glucans. The average crystallinity of cellulose for plants ranges widely depending on the tissue, plant species and environmental growth conditions such as the stress from high winds; for Arabidopsis, it is at most 55% in the stem tissue and can be as low as 38% for leaves28.
Figure 1.3: Depiction of cellulose from the plant wall to its monofilament. (Adapted from Cranston, ED. (2012) “Mechanical Testing of Thin Film Nanocellulose Materials.”)
With the emergence of cellulose nanofibrils, cellulose fiber-reinforced composites have been made to be relatively strong with the advantage of being transparent and biodegradable 29. Composites of cellulose often rely on chemical30 and mechanical31 treatments to optimize the size and purity of the nanofibrils. Being able to lower the
cellulose crystallinity, in this case, would be helpful in simplifying processing and obtaining uniform raw materials.
significantly by 2025 as human populations grow, resulting in more demand for biomass based fuel. Cellulosic ethanol is relatively environmentally friendly and may provide
renewable transportation fuel. As one advantage over corn ethanol, cellulosic biofuels do not require fertilizers, pesticides, significant energy, and water to produce. Ethanol as an
oxidizer in gasoline fuel, reduces smog, since it is 35% oxygen by weight and significantly less toxic than benzene-based oxygenates or Methyl Tertiary Butyl Ether (MTBE) that was proven to be highly carcinogenic. The Department of Energy estimates that approximately 130,000 barrels per day of ethanol will be needed to meet the demand created by refiner decisions to replace MTBE32.
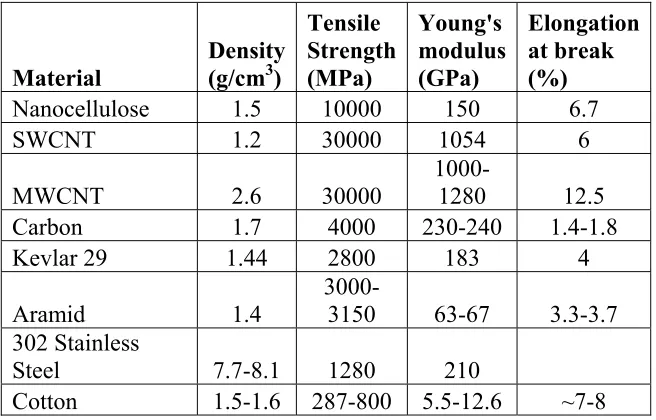
Table 1.1: Representative Mechanical Strength of Materials versus Nanocellulose. ArboraNano Inc.
Material
Density (g/cm3)
Tensile Strength (MPa) Young's modulus (GPa) Elongation at break (%)
Nanocellulose 1.5 10000 150 6.7
SWCNT 1.2 30000 1054 6
MWCNT 2.6 30000 1000-1280 12.5
Carbon 1.7 4000 230-240 1.4-1.8
Kevlar 29 1.44 2800 183 4
Aramid 1.4
3000-3150 63-67 3.3-3.7 302 Stainless
Steel 7.7-8.1 1280 210
Cotton 1.5-1.6 287-800 5.5-12.6 ~7-8
Newer applications for cellulose involve nanocellulose, the actual fibril element, to creating novel hydrogels34; transparent composites of cellulose have favorable characteristics can useful in many fields, such as flexible electrodes, flexible display devices35, bio-sensors, as a platform substrate to study the effect of electrical signals on cell activities, and to direct desirable cell function for tissue engineering applications (Figure 1.4). The mechanical properties of nanocellulose are comparable to Kevlar (Table 1). These properties of
nanocellulose are expected to produce an industry that will be worth up to 600 billion dollars annually by 2020 (US Forrest Service, Department of Agriculture).
1.3.2.2 Cellulose Synthase
produced by these rosettes eventually combine into larger microfibrils of ~20nm. These larger fibrils strands are thought to form entirely through self-assembly37. Current theory suggests that the crystallographic makeup and orientation of these fibrils depend entirely with the proteins that polymerize β-1,4 glucan into cellulose 38. Examining the protein machinery itself will give some insight into the self assembly of cellulose into microfibrils.
Furthermore, if these proteins can be manipulated, the cellulose that is produced can also be altered.
Cellulose is created at the molecular level by glycosyltransferases known as cellulose synthases, CESA’s, that catalyze the polymerization of β-1,4 glucan chains from
cellulobiose. CESAs are transmembrane proteins comprised of a large transmembrane domain of eight alpha helices and two major portions located in the cytoplasm. The monomer that is polymerized into β-1,4 glucan is a uridine diphosphate bound glucose (UDP-Glc) molecule of which there is debate on whether there are two or one binding sites.
formed in the golgi complex and exported to the cell membrane41. These rosettes self aggregate at the cellular membrane into higher level complexes and produce the cellulose microfibrils (Figure 1.6). Plant cellulose synthases are classified into six major isoforms along the lines of primary and secondary cell walls using the model plant Arabidopsis thaliana (mouse ear cress) which is related to cotton. Primary CESAs are those that produce a pliant wall in a plant as its cells grow. Secondary CESAs are responsible for forming the thicker walls when cells stop growing, and it is here where the majority of plant biomass is stored. With only a half life of less than 30 minutes, experimental structure determination of CESA’s has been difficult42. Delivery of cellulose synthase to the plasma membrane occurs at a rate of 4.8 delivery events μm−2 h−143. The turnover rate is much faster than for most membrane proteins. This recalcitrant character of CESA proteins has stymied the field for well over 40 years.
Figure 1.5: General topology of cellulose synthase glycosyltransferases. PCR is the plant conserved region, an CSR is the class specific region. There are 8 transmembrane helices in total. Adapted from Roberts et al. 44. D1-3 are conserved aspartic acid motifs. The QxxRW motif is thought to hold the glucan chain as it grows, and is found in all processive
Figure 1.6: Cellulose microfibrils formed polymerized by rosettes (Neville 1993 45). CESA mutants arising from single amino acid substitutions have shown altered synthesis of cellulose46. Understanding how these specific mutations affect the structure of the CESA and ultimately the cellulose that is produced can now leverage recent gains in bioinformatics 47. This work makes use of computational modeling of the structures from ab-initio prediction to all-atom physical simulations. Glycosyltransferases such as cellulose synthase are responsible for catalyzing the vast array of polysaccharide based biopolymers found in nature. Being able to alter their substrate affinity and enzymatic activity will allow for the creation of new biomaterials beyond those just based upon cellulose.
1.4 Methods
such as the case for the catalytic core of the cellulose synthase, a homology model from the SAM T-08 server48 was employed and subsequently refined with molecular dynamics. Once the final structure was within an acceptable quality, we introduced one known
mutation, Atcesa7P557T and two novel ones, Atcesa1S377F and Atcesa3G620E, into the modeled Ghcesa1 catalytic core. ROSETTA was subsequently used to examine the folding of three fragments that show relevance to cellulose synthesis and protein-protein interactions, one structure is a fragment from the transmembrane region consisting of two helices and a connecting loop, and the two others were small domains under 100 amino acids within the catalytic core itself.
1.4.1 Molecular Dynamics
Macroscopic observables are intrinsically related to microscopic behavior at the atomic scale. The time dependent (and independent) microscopic behavior of a molecule can be calculated. The most accurate method of examining atomic behavior is molecular
dynamics which models the atomic interactions using empirical fields. These force-fields approximate the interactions in the system using simplified models. In practice, these models typically include only those features that are necessary to describe the system:
(1)
Bonds Angles
Torsions
(3)
Non-bonded
(4)
Electrostatic
Once the system is adequately described, the next step is to solve Newton’s Equations of motion.
The most common time integration method is based on the Verlet algorithm49. It is an implicit method that is a third order Taylor expansion of the positions r(t) into a forward and backward time component such that the accelerations, a(t), and third time derivative result in a simplified expression with fourth order errors of the time step, ∆t:
∆ 2 ∆ ∆ ∆
(5) Forces can be computed from the acceleration:
1
(6)
Given that the choice of time step, ∆t, must be very small to capture the fastest motions a system, this requirement translates into chosen time steps being on the order of 1
also limits the amount of time that can be sampled to a few hundred nanoseconds depending on the numerical precision of the computer system. Very long simulations eventually accrue numerical errors as to render the later times of the simulation unrealistic. The schematic below shows the MD methodology (Figure 1.7):
Calculation of Forces Displacement t=∆t New Set of
Coordinates
In this work, nucleic acid helixes were generated using the Nucleic Acid Builder module of the molecular dynamics software Amber 9.0. Nucleic acid all atom simulations utilized the updated Cornell force field for nucleic acids 50,51. K+, Na+, and Cl- ions are modeled as point charges with van der Waals spheres without either polarization or charge transfer effects. This methodology represents monovalent ions faithfully. However, ad hoc adaptation of the Åqvist parameters for the AMBER-99 force field led to artifacts in long simulations of biomolecules in salt solutions resulting in salt crystal formation below their solubility limit according to Chen et al. 52. Subsequently, Joung and Cheatham
reparameterized the Lennard-Jones potential for ions and specific rigid water models 53,54. All NA structures were subjected to conjugate gradient energy minimization for 5000 steps. Minimized NA structures were then neutralized with Na+ ions and immersed in a water box with at least 10 Å deep solvation shell using the TIP3P water model 55. Additional Na+ and Cl- ions or K+ and Cl- ions were added to represent a 0.1 M effective salt concentration around a given NA helix. The equilibration of each NA sample was carried out in 11 stages
starting from the solvent minimization for 10000 steps and keeping the duplex restrained for 200 Kcal/mol. The system was heated to 300K in 40 ps while imposing a 200kcal/mol constraint on the duplex. A brief NPT MD run was performed for 200 ps with a duplex restrained maintained at 200 kcal/mol. Another constrained minimization step follows with the restraint of 25 kcal/mol for 10000 steps. A second NPT MD run was performed at 25 kcal/mol restraint for 20 ps. Subsequently four additional 1000 cycle minimization steps were performed while relaxing the positional constraint from 20 kal/mol to 5 kcal/mol in 5 kcal/mol increments. A final unconstrained minimization stage of 1000 cycles was performed before reheating the system to 300K at constant volume within 40 ps. Subsequently, NPT equilibrations were performed to ensure uniformity in solvent density. Long range
electrostatic interactions were calculated by Particle Mesh Ewald summation (PME)56 and the non-bonded interactions were truncated at 9 Å cutoff along with a 0.00001 tolerance of Ewald convergence. A Berendsen thermostat maintained temperature at 300 K 57. The SHAKE algorithm was used to constrain the position of hydrogen atoms 58. The production simulations were performed for an NVT ensemble. Each production simulation was performed for 20 ns with a 2 fs time step.
1.4.2 Ab-initio Protein Structure Prediction
1.4.2.1 Homology Modeling
Figure 1.8: SAM T08 Secondary Structure Prediction where E labels correspond to beta strands and H labels are alpha helices. Everything unlabeled is a random coil.
1.4.2.2 Fragment Based Assembly
Ab-initio prediction of fragments from the catalytic core and a transmembrane helices relied on the ROSETTA program. Starting with the FASTA file of single letter protein codes, a secondary structure prediction was accomplished using the PSIPRED program that performs a position specific iterated BLAST search. BLAST is the Basic Local Alignment Search Tool. The results of this search is then used by the ROSETTA script,
a greater correlation between local sequence and structure than for longer sequences. Subsequently, fragment assembly occurs by a Monte Carlo procedure; the process begins with a random positioning in the fully extended protein with either a 3 or 9 residue fragment. This first fragment is chosen randomly from the top 25 structures in the libraries.
Figure 1.9: ROSETTA starts from (a) fragment libraries with sequence-dependent ( and ψ) angles that capture the local conformational space accessible to a sequence. (b) Combining fragments from the libraries, ROSETTA folds the protein by optimizing non-local contacts. A low-resolution energy function smoothes the energy surface, to funnel the structure toward a native conformation as denoted by “N” (c). Metropolis Monte Carlo minimization drives the structure toward the global minimum. Reproduced from Kaufman et al. 201060.
to construct the fragment library from the favorable torsion angles and compatibility with secondary structure prediction as determined by an algorithm like PSIPRED or JUFO61. Prediction of membrane proteins relied on the OCTOPUS server for the membrane
topology62. This topology file is used to generate a lipophilicity profile to orient individual residues during the fragment insertion method within ROSETTA’s implicit membrane model.
References
1. Mentovich ED, Livanov K, Prusty DK, Sowwan M, Richter S. DNA-nanoparticle assemblies go organic: Macroscopic polymeric materials with nanosized features. J Nanobiotechnol 2012;10.
2. Helwa Y, Dave N, Froidevaux R, Samadi A, Liu JW. Aptamer-Functionalized Hydrogel Microparticles for Fast Visual Detection of Mercury(II) and Adenosine. Acs Appl Mater Inter 2012;4(4):2228-2233.
3. Nishikawa M, Mizuno Y, Mohri K, Matsuoka N, Rattanakiat S, Takahashi Y,
Funabashi H, Luo D, Takakura Y. Biodegradable CpG DNA hydrogels for sustained delivery of doxorubicin and immunostimulatory signals in tumor-bearing mice. Biomaterials 2011;32(2):488-494.
4. Saccà B, Siebers B, Meyer R, Bayer M, Niemeyer CM. Nanolattices of Switchable DNA-Based Motors. Small 2012;8(19):3000-3008.
5. Mysliwiec J, Sznitko L, Sobolewska A, Bartkiewicz S, Miniewicz A. Lasing effect in a hybrid dye-doped biopolymer and photochromic polymer system. Appl Phys Lett 2010;96(14).
6. Kawabe Y, Wang L, Nakamura T, Ogata N. Thin-film lasers based on dye-deoxyribonucleic acid-lipid complexes. Appl Phys Lett 2002;81(8):1372-1374. 7. Khan F, Dahman Y. A Novel Approach for the Utilization of Biocellulose Nanofibres
8. Wijnhoven SWP, Dekkers S, Hagens WI, de Jong WH. Exposure to nanomaterials in consumer products. RIVM-letter report 340370001/2009 2009.
9. Nagai H, Toyokuni S. Differences and similarities between carbon nanotubes and asbestos fibers during mesothelia carcinogensis: Shedding light on fiber entry mechanism. Cancer Science 2012;103(8):1378-1390.
10. Hitoshi K, Katoh M, Suzuki T, Ando Y, Nadai M. Differential effects of single-walled carbon nanotubes on cell viability of human lung and pharynx carcinoma cell lines. J Toxicol Sci 2011;36(3):379-387.
11. Hubbe MA, Rojas OJ, Lucia LA, Sain M. Cellulosic Nanocomposites: A Review. Bioresources 2008;3(3):929-980.
12. Brown RM, Saxena I. Cellulose Synthesizing Complexes in Vascular Plants and Prokaryotes. DOE-ER15396 2009.
13. SantaLucia J, Hicks D. The thermodynamics of DNA structural motifs. Annu Rev Bioph Biom 2004;33:415-440.
14. Hermann T, Westhof E. Non-Watson-Crick base pairs in RNA-protein recognition. Chem Biol 1999;6(12):R335-R343.
15. Hermann T, Patel DJ. RNA bulges as architectural and recognition motifs. Struct Fold Des 2000;8(3):R47-R54.
16. McCann MD, Lim GFS, Manni ML, Estes J, Klapec KA, Frattini GD, Knarr RJ, Gratton JL, Serra MJ. Non-nearest-neighbor dependence of the stability for RNA group II single-nucleotide bulge loops. Rna 2011;17(1):108-119.
17. Sponer J, Leszczynski J, Hobza P. Electronic properties, hydrogen bonding, stacking, and cation binding of DNA and RNA bases. Biopolymers 2001;61(1):3-31.
18. Shkilnyj P, Koudelka GB. Effect of salt shock on stability of lambda(imm434) lysogens. J Bacteriol 2007;189(8):3115-3123.
19. Bushman FD, Ptashne M. Activation of Transcription by the Bacteriophage-434 Repressor. P Natl Acad Sci USA 1986;83(24):9353-9357.
20. Mauro SA, Koudelka GB. Monovalent cations regulate DNA sequence recognition by 434 repressor. J Mol Biol 2004;340(3):445-457.
22. Casiano-Negroni A, Sun XY, Al-Hashimi HM. Probing Na+-Induced changes in the HIV-1 TAR conformational dynamics using NMR residual dipolar couplings: New insights into the role of counterions and electrostatic interactions in adaptive recognition. Biochemistry-Us 2007;46(22):6525-6535.
23. Leulliot N, Varani G. Current topics in RNA-protein recognition: Control of specificity and biological function through induced fit and conformational capture. Biochemistry-Us 2001;40(27):7947-7956.
24. Wang H, Yang RH, Yang L, Tan WH. Nucleic Acid Conjugated Nanomaterials for Enhanced Molecular Recognition. Acs Nano 2009;3(9):2451-2460.
25. Han SP, Maune HT, Barish RD, Bockrath M, Goddard WA. DNA-Linker-Induced Surface Assembly of Ultra Dense Parallel Single Walled Carbon Nanotube Arrays. Nano Lett 2012;12(3):1129-1135.
26. Somerville C. Cellulose synthesis in higher plants. Annu Rev Cell Dev Bi 2006;22:53-78.
27. Nishino T, Takano K, Nakamae K. Elastic-Modulus of the Crystalline Regions of Cellulose Polymorphs. J Polym Sci Pol Phys 1995;33(11):1647-1651.
28. Harris D, DeBolt S. Relative Crystallinity of Plant Biomass: Studies on Assembly, Adaptation and Acclimation. Plos One 2008;3(8).
29. Gindl W, Keckes J. All-cellulose nanocomposite. Polymer 2005;46(23):10221-10225. 30. Eichhorn SJ, Baillie CA, Zafeiropoulos N, Mwaikambo LY, Ansell MP, Dufresne A,
Entwistle KM, Herrera-Franco PJ, Escamilla GC, Groom L, Hughes M, Hill C, Rials TG, Wild PM. Review: Current international research into cellulosic fibres and composites. J Mater Sci 2001;36(9):2107-2131.
31. Zimmermann T, Pohler E, Geiger T. Cellulose fibrils for polymer reinforcement. Adv Eng Mater 2004;6(9):754-761.
32. EIA. Renewable Fuels Legislation Impact Analysis. 2005.
33. Bodin A, Backdahl H, Risberg B, Gatenholm P. CELL 107-Nanocellulose as scaffolds for tissue engineering and organ regeneration. Abstr Pap Am Chem S 2007;233:701-701.
34. Cha RT, He ZB, Ni YH. Preparation and characterization of thermal/pH-sensitive hydrogel from carboxylated nanocrystalline cellulose. Carbohyd Polym
35. Okahisa Y, Yoshida A, Miyaguchi S, Yano H. Optically transparent wood-cellulose nanocomposite as a base substrate for flexible organic light-emitting diode displays. Compos Sci Technol 2009;69(11-12):1958-1961.
36. Mueller SC, Brown RM. Evidence for an Intramembrane Component Associated with a Cellulose Microfibril-Synthesizing Complex in Higher-Plants. J Cell Biol
1980;84(2):315-326.
37. Vincent JFV. From cellulose to cell. J Exp Biol 1999;202(23):3263-3268. 38. Ruel K, Nishiyama Y, Joseleau JP. Crystalline and amorphous cellulose in the
secondary walls of Arabidopsis. Plant Sci 2012;193:48-61.
39. Egelund J, Skjot M, Geshi N, Ulvskov P, Petersen BL. A complementary bioinformatics approach to identify potential plant cell wall glycosyltransferase-encoding genes. Plant Physiol 2004;136(1):2609-2620.
40. Endler A, Persson S. Cellulose Synthases and Synthesis in Arabidopsis. Mol Plant 2011;4(2):199-211.
41. Mutwil M, Debolt S, Persson S. Cellulose synthesis: a complex complex. Curr Opin Plant Biol 2008;11(3):252-257.
42. Jacob-Wilk D, Kurek I, Hogan P, Delmer DP. The cotton fiber zinc-binding domain of cellulose synthase A1 from Gossypium hirsutum displays rapid turnover in vitro and in vivo. P Natl Acad Sci USA 2006;103(32):12191-12196.
43. Wightman R, Turner S. Trafficking of the Plant Cellulose Synthase Complex. Plant Physiol 2010;153(2):427-432.
44. Roberts AW, Roberts EM, Delmer DP. Cellulose synthase (CesA) genes in the green alga Mesotaenium caldariorum. Eukaryot Cell 2002;1(6):847-855.
45. Neville AC. Biology of Fibrous Composites; Development Beyond the Cell Membrane. Cambridge: University Press; 1993.
46. Harris D, Stork J, Debolt S. Genetic modification in cellulose-synthase reduces crystallinity and improves biochemical conversion to fermentable sugar. Gcb Bioenergy 2009;1(1):51-61.
47. Carroll A, Specht CD. Understanding Plant Cellulose Synthases Through a
Comprehensive Investigation of the Cellulose Synthase Family Sequences. Frontiers in Plant Science 2011;2(5).
49. Verlet L. Computer Experiments on Classical Fluids .I. Thermodynamical Properties of Lennard-Jones Molecules. Phys Rev 1967;159(1):98-&.
50. Cornell WD, Cieplak P, Bayly CI, Gould IR, Merz KM, Ferguson DM, Spellmeyer DC, Fox T, Caldwell JW, Kollman PA. A 2nd Generation Force-Field for the Simulation of Proteins, Nucleic-Acids, and Organic-Molecules. J Am Chem Soc 1995;117(19):5179-5197.
51. Cieplak P, Caldwell J, Kollman P. Molecular mechanical models for organic and biological systems going beyond the atom centered two body additive approximation: Aqueous solution free energies of methanol and N-methyl acetamide, nucleic acid base, and amide hydrogen bonding and chloroform/water partition coefficients of the nucleic acid bases. J Comput Chem 2001;22(10):1048-1057.
52. Chen AA, Pappu RV. Parameters of monovalent ions in the AMBER-99 forcefield: Assessment of inaccuracies and proposed improvements. Journal of Physical Chemistry B 2007;111(41):11884-11887.
53. Joung IS, Cheatham TE. Determination of alkali and halide monovalent ion parameters for use in explicitly solvated biomolecular simulations. Journal of Physical Chemistry B 2008;112(30):9020-9041.
54. Joung IS, Cheatham TE. Molecular Dynamics Simulations of the Dynamic and Energetic Properties of Alkali and Halide Ions Using Water-Model-Specific Ion Parameters. Journal of Physical Chemistry B 2009;113(40):13279-13290. 55. William L. Jorgensen JC, and Jeffry D. Madura. Comparison of simple potential
functions for simulating liquid water. J Chem Phys 1983;79.
56. Essmann U, Perera L, Berkowitz ML, Darden T, Lee H, Pedersen LG. A smooth particle mesh Ewald method. The Journal of Chemical Physics 1995;103(19):8577-8593.
57. Berendsen HJC, Postma JPM, Gunsteren WFv, DiNola A, Haak JR. Molecular dynamics with coupling to an external bath. The Journal of Chemical Physics 1984;81(8):3684-3690.
58. Ryckaert JP, Ciccotti, G, Berendsen, H.J.C. Numerical integration of the Cartesian equations of motion of a system with constraints: molecular dynamics of n-alkanes. Journal of Computational Physics 1977;23(3):327-341.
60. Kaufmann KW, Lemmon GH, DeLuca SL, Sheehan JH, Meiler J. Practically Useful: What the ROSETTA Protein Modeling Suite Can Do for You. Biochemistry-Us 2010;49(14):2987-2998.
61. Meiler J, Baker D. Coupled prediction of protein secondary and tertiary structure. P Natl Acad Sci USA 2003;100(21):12105-12110.
Chapter 2
Published in the Journal of Physical Chemistry B (2010)
The Sequence of HIV-1 TAR RNA Helix Controls Cationic Distribution
Latsavongsakda Sethaphong, Abhishek Singh, Ashley E. Marlowe, Yaroslava G. Yingling* Department of Materials Science and Engineering, NNC State University, Raleigh, NC Abstract
Sequence dependency of metal ion aggregation around RNA structures is known to be involved in critical functions ranging from processes of molecular recognition to enzymatic chemistry. Ion interactions with an HIV-1 TAR RNA core helix were examined with explicit solvent molecular dynamics simulations. The results have shown that there is a sequence-dependent cationic localization toward the purine-rich run within the TAR helix and other purine-rich duplexes. The behavior is independent of ionic species or a presence of a bulge. A region of high ion affinity agrees very well with the position of the X-ray determined divalent cations within a fragment from the HIV-1 TAR RNA.
KEYWORDS. RNA helix, cations, HIV-1 TAR RNA, molecular dynamics simulations.
2.1 Introduction
charged electronegative surface potential of the RNA molecule is sequence dependent wherein even a single base substitution can fundamentally alter the reactivity of the entire complex4. Even though the role of cationic interactions had been appreciated early on, characterizing and quantifying their influence on nucleic acid structure and function has only been a recently renewed effort5,6.