ABSTRACT
CHANG, SUK TAI. New Electrokinetic Techniques for Material Manipulation on the Microscale. (Under the direction of Dr. Orlin D. Velev.)
We report the results of series of investigations how electrically induced forces and interfacial phenomena could be used to manipulate particles and fluids on the microscale. Particle microseparations in a droplet floating on a dielectrophoretic liquid-chip system were investigated. Particle-localized electroosmotic flow was used for designing autonomously moving microdevices and locally distributed micropumps/mixers. Microfluidics was adapted for enhancing mechanical properties of materials with embedded microchannel networks. Ionic current rectification in charged aqueous gels was used for constructing new types of "soft matter" diodes. Detailed analytical and numerical modeling was performed for each system. The results of this work can apply to new fields of microfluidics, self-propelling microdevices, and aqueous gel-based electronic components.
In the first part of this work we explored unusual phenomena of colloidal particle transport and separation inside microdroplets floating in fluorinated oil on electrically controlled chips. Microspheres suspended in a drying droplet on liquid-liquid chips were rapidly separated in the droplet’s top region due to water evaporation. During the evaporation process, a surface tension gradient emerged as a result of a non-uniform temperature distribution within the droplet. This interfacial gradient generated a Marangoni flow inside the evaporating droplet. The suspended colloidal particles driven by the convective flow were collected at the top of the droplets by the hydrodynamic flux compensating for the evaporation. The flow pattern and temperature distribution within the evaporating droplet were simulated using finite element calculation. The internal flow pattern calculated by the simulation was consistent with the experiments using tracer particles. The levitated microdroplets were used as templates for colloidal assembly and containers for microbioassays based on particle agglutination inside droplets.
in the second part of this study. Various types of miniature diodes floating in water acted as self-propelling particles when powered by an alternating (AC) electric field. Direct (DC) electric field induced across the diodes as a result of rectification of the external AC field led to particle-localized electroosmotic flow. The resulting reactive force pushed the diodes in the direction opposite to the electroosmotic flux. The microelements began to move parallel to the electric field in the direction of either the cathode or the anode, depending on their surface charge. In effect, the semiconductor microelements harvest electric energy from external AC field and convert it into mechanical propulsion on the microscale. The particle-localized propulsion force was used in diode-actuated electroosmotic motors and actuators. Diodes embedded in microfluidic channel walls could serve as locally distributed pumps or mixers powered by a global AC external field. The experimental results were interpreted by numerical simulations of the electrohydrodynamic flows
The viscoelastic properties of fluids inside microchannels were used in the development of novel microfluidic materials in the form of flexible sheets that can be solidified on demand to yield preprogrammed shapes. These materials were based on microfluidic channel networks in polydimethylsiloxane (PDMS) filled with photocurable polymers. When the elastic sheets with embedded microchannel networks were shaped and exposed by UV light, the photoresist inside the channels was solidified and acted as endoskeleton within the PDMS layer, acquiring the pre-arranged shape. Bending and stretching moduli of the materials with solidified endoskeleton increased drastically and after the external force was removed, the memorized shapes were recovered. The permanent preservation of the shape of solidified microfluidic sheets could be used in making instant packages and supports on demand.
New Electrokinetic Techniques for Material
Manipulation on the Microscale
by
Suk Tai Chang
A dissertation submitted to the Graduate Faculty of North Carolina State University
in partial fulfillment of the requirements for the Degree of
Doctor of Philosophy
Chemical Engineering
Raleigh, North Carolina 2008
APPROVED BY:
_________________________ _________________________ Peter Kilpatrick Saad Khan
_________________________ _________________________ Glenn Walker Orlin Velev
DEDICATION
this dissertation is dedicated to my parents
and my wife Juna,
my son Jinho (Kevin), my daughter Eunho (Emma), who made all of this possible,
BIOGRAPHY
ACKNOWLEDGEMENTS
This work would not been possible without the support and encouragement of a great many individuals. Foremost, I would like to express my gratitude to my advisor Professor Orlin Velev, who has been an exceptional mentor and given me many insightful conversations in working hours or evening, even late night. His thoughtful advices and enthusiasm for science have always inspired me with a sense of right direction during my PhD studies and originality of thought, not just “So do I” in research. I can not thank him enough for his kind guidance, his work ethic, and his remarkable patience for my thesis work. Thanks so much Dr. Velev!!!
I would like to thank my parents for their unconditional love and support. They taught me the right way to live and no rewards without hard working by their own life. I must express my gratitude to my parent-in-laws for their endless love and helps for taking care of my babies in Raleigh. I thank my brothers, sisters, nephews, and nieces for their encouragement and cheerfulness throughout this journey.
I am very grateful to Professors Peter Kilpatrick, Saad Khan, and Glenn Walker for serving on my thesis committee and Professor Michael Dickey for his approval for a substitute on the committee. I am thankful to Professor Jan Genzer for his time and helps for the letter of recommendation. Professors Gregory Parsons and Mark Luo have allowed me to access their lab equipments many times during my experiments and I thank them for their helps. I also want to acknowledge Professors Vesselin Paunov in University of Hull, UK and Dimiter Petsev in University of New Mexico for many insightful discussions for my research. I should not forget to say thank to all the staff members from our department for their kindness and helps for the five years in NC State. Specially, I am thankful to the helps received from Shirley in installing FEMLAB software for my simulations.
can I forget my buddy Vinayak for lots of help, talks about life, and his encouragement. I should give thanks to Dr. Olivier Cayre, French peanut boy, for his fruitful collaboration on the gel diodes research and cheers in Spanish. Special thanks are to Dr. Sejong Kim for his discussions on my graduate research. I am also thankful to Sumit for sharing the daddy’s life and his correction of my thesis writing. I like to express my thanks to Hyung-Jun, Burak, Garrett, and Robert for their hard work and collaboration on the gel work and the microfluidic project. I wish to thank everybody in our group, my classmate Lindsey, Dr. Daniel Kuncicky, Liz, Jairus, Jess, Dr. Stoyan Smoukov, and Hye-Young, with whom I have shared experiences in the group. I also owe a debt to Young Kuk and Yong-Jae from the first day in US, with whom I had fun opportunity and friendship. I appreciate Jeong-Seok Na for his understanding and helps for using his lab equipments. I am tempted to express thanks to Drs. Kie Jin Park, Changwoong Chu, Jaehoon Kim, and Chang Shin Park for their assistance and cheerfulness during my graduate study.
Table of Contents
List of Tables ... ix List of Figures ... x Chapter 1. General Introduction of Microfluidics ... 1 1.1 Introduction ...
1.2 Brief Historical Overview of Microfluidics ... 1.3 Electrokinetic Phenomena on Manipulating Microflows ... 1.3.1 Dielectrophoresis ... 1.3.2 Electroosmosis ... 1.4 New Types of Microfluidic Systems and Various Applications of Microfluidics and Microflows ... 1.4.1 Droplet-Based Microfluidics ... 1.4.2 Autonomously Moving Microdevices ... 1.4.3 Ionic Current Control in Micro- and Nanofluidic Systems ... 1.5 Layout of this Dissertation ... 1.6 References ...
2 2 4 6 7 11 11 15 19 22 22 Chapter 2. Evaporation-Induced Particle Microseparations inside Droplets
Floating on a Chip ... 40 2.1 Introduction ...
2.2 Experimental Section ... 2.2.1 Materials ... 2.2.2 Experimental Setup ... 2.2.3 Measurement of Droplet Size and Volume ... 2.2.4 Measurement of Internal Flow Velocity ... 2.2.5 Numerical Simulation ... 2.3 Results and Discussion ... 2.3.1 Effect of Water Evaporation on Vertical Separation of Microspheres
2.3.2 Internal Flow within an Evaporating Droplet ... 2.3.3 Simulation of Temperature Distribution and Flow Profile ... 2.3.4 Simulation Results and Correlation with Experimental Data ... 2.4 Potential Applications of Microseparations inside Evaporating Droplets ... 2.5 Conclusions ... 2.6 Acknowledgements ... 2.7 References ...
41 44 44 44 46 47 47 47 47 50 55 59 63 65 66 66 Chapter 3. Remotely Powered Self-Propelling Particles and Micropumps Based
on Miniature Diodes ... 71 3.1 Introduction ...
3.2 Experimental Section ...
3.2.1 Experimental Setup for Self-Propelling Diodes ... 3.2.2 Microfluidic Systems Embedded with Miniature Diodes ... 3.3 Results and Discussion ... 3.3.1 Experimental Results and Theoretical Analysis of Diode Motility ... 3.3.2 Effect of Operating Parameters on Diode Mobility ... 3.3.3 Autonomous Motion of Diodes with Complex Functionalities ... 3.4 Potential Applications of Diode Propulsion Force ... 3.4 Conclusions ... 3.5 Acknowledgements ... 3.6 References ...
73 73 75 75 80 83 85 89 89 90 Chapter 4. Remotely Powered Distributed Microfluidic Pumps and Mixers
Based on Miniature Diodes ...
94
4.1 Introduction ... 4.2 Experimental Section ... 4.2.1 Fabrication of Microfluidic Channels ... 4.2.2 Microfluidic Pumping Using Diodes ... 4.2.3 Microfluidic Mixing Using Diodes ... 4.3 Results and Discussion ... 4.3.1 Diode Pumping ... 4.3.2 Theoretical Analysis of the Diode Pump ... 4.3.3 Numerical Simulation of Fluid Flows in Diode Pumping ... 4.3.4 Diode Mixing Experimental Results ... 4.3.5 Numerical Simulation of Diode Mixing Process ... 4.4 Conclusions ... 4.5 Acknowledgements ... 4.6 References ...
95 97 97 99 99 100 100 101 106 109 112 114 115 115 Chapter 5. Materials of Controlled Shape and Stiffness with Photocurable
Microfluidic Endoskeleton ... 120 5.1 Introduction ...
5.2 Experimental Section ... 5.2.1 Preparation of Photocurable Microfluidic Materials ... 5.2.2 Measurement of Tensile and Bending Moduli ... 5.3 Results and Discussion ... 5.3.1 Controlled Shapes on Demand ... 5.3.2 Improvement of Elastic and Bending Moduli ... 5.4 Conclusions ... 5.5 Acknowledgements ... 5.6 References ...
121 122 122 124 124 124 126 130 131 131 Chapter 6. Polyelectrolyte Diode: Nonlinear Current Response of a Junction
6.1 Introduction ... 6.2 Experimental Section ... 6.2.1 Materials ... 6.2.2 Preparation and Characterization of Gel Diodes... 6.3 Results and Discussion ... 6.3.1 Effect of Gel Desalination ... 6.3.2 Effect of Gel Thickness ... 6.3.3 Effect of Sweep Scan Rate ... 6.3.4 Long-Term Current Response at Constant Bias ... 6.3.5 Current Response under Alternating Electric Field ... 6.4 Conclusions ... 6.5 Acknowledgements ... 6.6 References ...
LIST OF TABLES
Table 1.1
Table 2.1
Table 3.1
Table 4.1
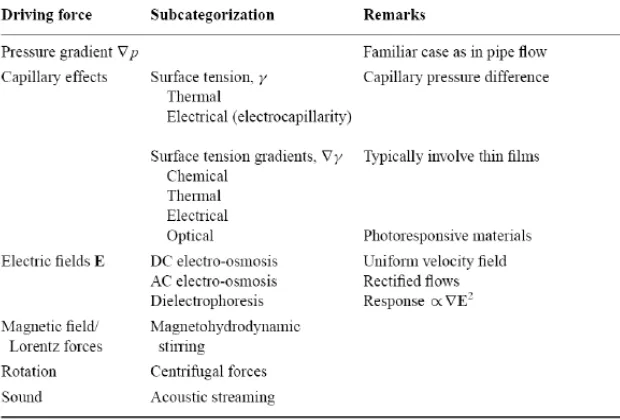
Summary of the driving forces and external fields used to manipulate flows in microfluidic devices.2... Numerical values for the physical properties of the fluids at
T=23°C ... Types of semiconductor elements used and functionality demonstrated Parametric comparison - published AC electrohydrodynamic pumps and diode pumps reported in this study ...
5
56 83
LIST OF FIGURES Figure 1.1 Figure 1.2 Figure 1.3 Figure 1.4 Figure 1.5 Figure 1.6
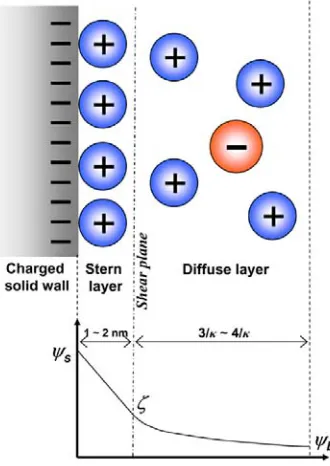
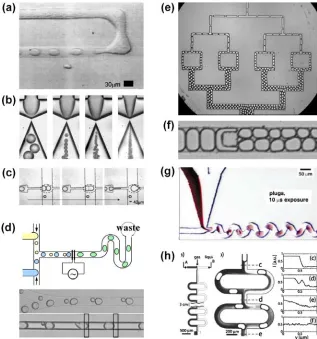
A wide range of applications in microfluidics utilizing many principles to transport and analyze small volumes of liquid.29 SAW refers to surface acoustic wave, EOF to electroosmotic flow, EW to electrowetting, EHD to electrohydrodynamics, DEP to dielectrophoretic pumping, MIMIC to micromolding in capillaries, CFL to capillary force lithography, FIA to flow-injection assays, and POC to point-of care ... Dielectrophoretic force moves the particle along the gradient of the electric field, ∇E. The particle is either attracted to or repelled from the high field intensity region based on the sign of K ... Schematic of electric double layer formation at the interface of charged surface and electrolyte solution and plot of electric potential distribution at the interface ... Schematics of different types of electroosmotic flow in electric field applications. (a) DC electroosmosis. Liquid flows are driven by the motion of counterions in the electric double layer near the charged wall between the energized electrodes. (b) AC electroosmosis. Interaction of the tangential field of an AC electric field gradient near the electrode edges with counterions in the electric double layer gives rise to a net fluid flows directed towards the electrodes ... Manipulation of droplets in microfluidic channels. (a) Formation of water-in-oil droplets with T-junction110 and (b) flow focusing design.116 As oil flow rate increases (from left to right in (b)), droplet s i z e i s r e d u c e d w i t h i n c r e a s i n g f r e q u e n c y o f f o r ma t i o n . (c) Passive fusion of a series of three droplets in flow rectifying design120 and (d) active fusion of water droplets with two different sizes by an electric field when they pass over the electrodes.121 (e) Sequential breakup of droplets in a series of T-junctions and (f) fission of water-in-oil droplets caused by a square obstruction in a microchannel.119 (g) Mixing inside liquid plugs traveling through winding channels.118 (h) Gaseous slugs flowing through a microchannel network lead to stretching and folding of continuous phase liquids.122 ... Manipulation of droplets on planar systems. (a) Dispensing of uniform microdroplets from on-chip liquid reservoir.140 (b) Time-lapsed
3
6
8
9
Figure 1.7
Figure 1.8
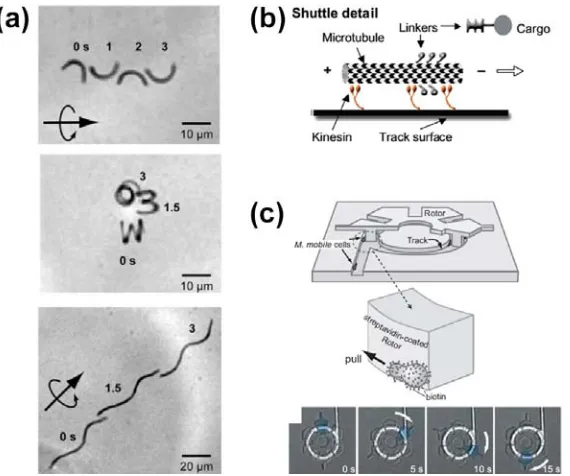
Figure 1.9
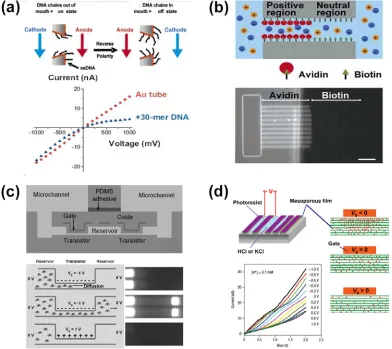
images of mixing in oscillating droplets on two electrodes at 8 Hz of frequency.144 (c) Sequential images of breakup and merging of droplets through surface electrodes.142 (d) Droplet and particle entrapment in DEP-based chip.149 Multiple droplets of 1µL containing polystyrene microspheres are trapped by DEP above electrode matrix in a fluorinated oil layer. Anisotropic eyeball supraparticles and striped multilayer particles are synthesized in the floating aqueous droplets ... Examples of autonomously moving hybrid systems, combining synthetic components and biomolecular motors. (a) Superimposed time-lapse images showing the motion of crescent-shaped and spiral-shaped cells, swimming immediately after its release into solution.168 (b) Schematic of surface-bound kinesin motor proteins to transport functionalized microtubule shuttle along patterned tracks.167 (c) Schematic illustration of a microrotor (20 µm diameter) driven by the gliding bacteria that adhere to the rotor (top) and time-lapse photomicrographs of a unidirectionally rotating rotor within the track (bottom).170 ... Examples of spontaneously propelling artificial nano- and micromachines. (a) Schematic of a self-propelling machine consisting of a PDMS plate (1 ~ 2 mm thick and 9 mm diameter) and a porous glass filter covered with platinum.176 (b) Schematic of an asymmetric gold/platinum nanorod propelled predominantly along its axis in the direction of the platinum driven by the catalytic decomposition of hydrogen peroxide fuel.159,177 (c) Photograph of a gold gear with platinum deposited in the tooth regions. The arrow in the inset indicates the region where the surface tension gradient is formed (scale bar is 50 µm).182 (d) Schematic illustration of a self-propelled bioelectrochemical motor driven by the reaction of glucose and oxygen based on functionalized carbon fibers with two redox-coupled enzymes.184 (e) Schematic illustrations of extraction of organic solvent from a solvent-swollen polymer gel (top) and the mechanism for its motion due to solvent spreading at the air-water interface (bottom).188 ... Nonlinear ionic current control in nanofluidic devices. (a) Schematics of ionic current rectifier with a conical gold-nanotube showing electrode polarity and DNA chain positions for on and off states (top). Current-Voltage (I-V) characteristics of the nanopore current rectifier before and after modification with thiolated single-stranded DNA (bottom).199,202 (b) Schematic of a nanofluidics diode with
14
16
Figure 2.1
Figure 2.2
Figure 2.3
Figure 2.4
Figure 2.5
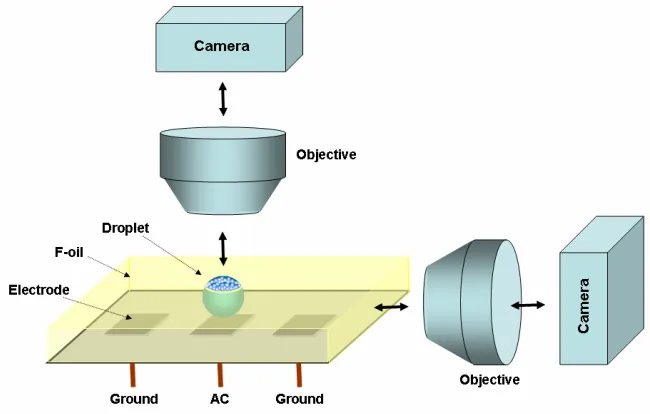
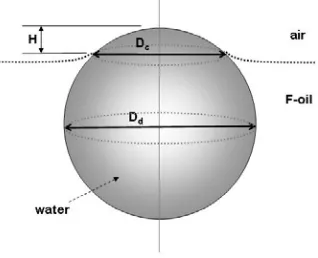
discontinuous surface charge patterned by cationic protein avidin in half the nanochannel and biotin moieties in the other half (top). Fluorescent image of the fabricated nanofluidics diode by introducing fluorescently labeled avidin in half the channel wall (bottom).210 (c) Schematic of nanofluidics field-effect transistor system connected with microfluidic channels on either side (top). Illustration in the bottom shows diffusion of the avidin attracted near the nanochannel entrance when the gate electrode is turned on (Vg = -1 V) without bias between the microchannels. But the protein was not observed in the channel or in the central reservoir with Vg = + 1 V, because positively charged avidin was repelled out of the channel. Fluorescence images are corresponding to the schematics in the left.214 (d) Schematic diagram of the measurement of proton conductivity through aligned mesoporous silica films (top left). The gate effect of cation (red) and anion (blue) distribution within nanochannels is illustrated in the left and accordingly ionic current is modulated by this electrostatic gating, as shown in the I-V curves (bottom left).215 ... Schematic of the experimental setup. A single floating droplet is entrapped by the electric field from the energized electrode below. The particle position within the drying droplet can be monitored with top-down or side microscope equipped with digital camera. Droplet and components are not to scale ... Geometry of aqueous droplet floating on F-oil. Dc = diameter of
contact line. Dd = diameter of droplet. H = distance from the apex to
the three-phase contact line of the droplet ... Typical micrographs of an evaporating droplet from a top-down perspective. (a) 10 min after floating on the F-oil surface, (b) 20 min, (c) 40 min. The original droplet contains 4.1 wt% of 4.9 µm polystyrene microspheres in DI water. As the water evaporates the particles are collected in the droplet top. The scale in the images is superimposed by the microscope optics (10 div. = 210 µm) ... Typical image of the contents of non-evaporating water droplet from a side perspective. The droplet contains 0.41 wt% of 4.9 µm polystyrene microspheres in DI water, which have sedimented to the bottom after 45 minutes of experiment. Scale bar = 200 µm ... Experimental images of particle collection on the top of the droplet when the cap was opened to allow water evaporation. (a) Before the evaporation begins the particles have sedimented on the bottom
21
45
46
48
Figure 2.6 Figure 2.7 Figure 2.8 Figure 2.9 Figure 2.10 Figure 2.11
(microscope focused on the bottom of droplet), (b) 15 min after evaporation the particle slug begins moving up along the droplet surface (microscope focused on the bottom of droplet), (c) 15 min after evaporation (microscope focused on the top of droplet), (d) 60 min after evaporation some particles are collected in the top section (microscope focused on the top of droplet). The original droplet contains 0.41 wt% of 4.9 µm polystyrene microspheres in DI water. The scale in the images is superimposed by the microscope optics (10 div. = 210 µm) ... Typical experimental images of the internal flow in evaporating water droplet viewed from aside. Image in (b) is taken after 90° change in perspective from (a). The tracers are polymer microrods synthesized by a technique reported by us earlier.46,47 Camera exposure time was 2 sec. Scale bar = 200 µm ... Change in the volume of 750 nL droplets with time due to evaporation. V0 = initial droplet volume. Vt = droplet volume at the
specific time ... Flow velocity and evaporation rate measured with floating droplets. (a) Data at 55% relative humidity and 23°C, (b) Data at 51% relative humidity and 28°C. vtop-50 = velocity at 50 µm down from the apex of
droplet. vtop-100 = velocity at 100 µm from the apex of droplet. vbottom =
velocity at the bottom of droplet. The tracer particles are 0.002 wt% of 1 µm polystyrene microspheres in DI water. The data were fitted to decaying exponential functions ... Schematics of the proposed mechanism of particle microseparations in evaporating droplets ... Simulation for the temperature distribution and velocity profile in the drying droplet using FEMLAB. (a) Schematic of the geometry specified (dimensions are not to scale); (b) Computed temperature distribution and velocity profile inside the droplet after 15 min of drying for the system with relative humidity 55% and ambient temperature 23°C. The velocity vector magnitudes are represented by the lengths of the arrows. Colors show the temperature. The results confirm the emergence of circular flow inside the system ... Simulation results for the temperature distribution in droplets at increasing drying times. (a) Relative humidity 55% and ambient
Figure 2.12
Figure 2.13
Figure 3.1
Figure 3.2
temperature 23°C. (b) Relative humidity 51% and ambient temperature 28°C ... Simulation for the temperature distribution and velocity profile in an initial stage of a drying droplet with relative humidity 55% and ambient temperature 23°C. The boundary condition at water/air interface is τwater −τair =∇σwater/air ⋅t. Other boundary conditions are same as those described. The velocity vector magnitudes are represented by the lengths of the arrows. The liquid on the top moves in one direction, while the liquid further down moves in the opposite direction. The flows are broadly similar to the ones observed in free droplets before the surface is immobilized by the dense particle layer. After particles accumulate in the top section of the droplet they would immobilize the surface and suppress the top vortex ... Typical experimental images of a microbioassay where the results are detected on the basis of particle separations inside evaporating droplets on a chip. Both droplets contain a binary suspension of 3 wt% 1 µm rabbit IgG coated latex particles and 0.02 wt% 40 nm anti-rabbit IgG coated gold nanoparticles. (a) Negative control droplet after 30 min of drying. (b) Test droplet where 10 µg/mL of antibody (rabbit-IgG) is added after 30 min of drying. (c) Optical micrograph of same mixture as (a) illustrating that the particles remain dispersed. (d) Optical micrograph of same mixture as (b) proving that the agglutination has bound them in gold-latex clusters. Scale bars: (a) and (b) 200 µm; (c) and (d) 20 µm ... Schematics of the experiments for measuring floating diode velocity and diode pumping rate in a model microfluidic device. The origin of the localized electroosmotic flow and the equivalent electric circuit used to analyze the magnitude of the DC voltage Vd induced in the
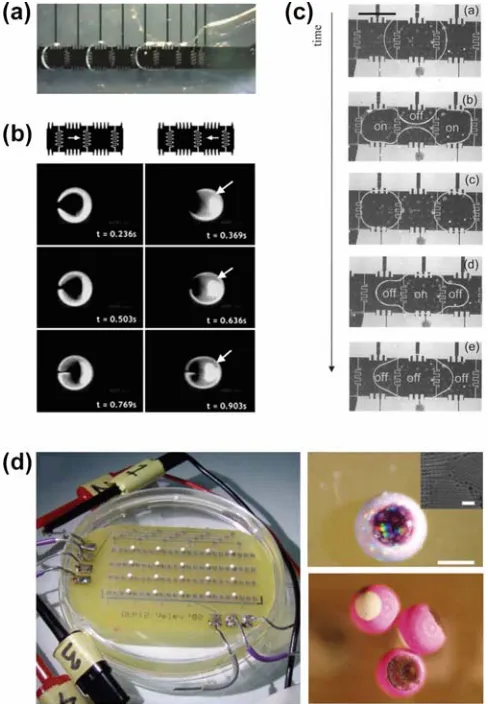
diode are shown in the top and bottom respectively ... Optical micrographs of self-propelling semiconductor “particles”: (a) Overlay of a series of photographs at low magnification showing the 5 cm directional “voyage” of a propelling microdiode (seen here as small black rectangle) for a total duration of 43 s. (b) Two LEDs light up and move towards the top or bottom depending on the orientation of their anodes (marked white). This experiment demonstrates the potential of diode-based devices to deliver additional functionality based on the voltage induced between their electrodes. (c) Use of diodes as propellers and actuators in MEMS - a rotor ring with diodes attached to its periphery spins around when an external field is
60
62
64
Figure 3.3
Figure 3.4
Figure 3.5
applied. All experiments in (a), (b), (c) were performed at external voltage, Eext = 120 V/cm, frequency 1 kHz, and 10-6 M NaCl. Scale
bars = 5 mm ... (a) Voltage generated across a fixed diode as a function of the external electric field Eext. Two electrodes with 1 mm gap between them were
brought in contact with the surface of the water solution of 10-6 M NaCl in the experimental vessel. DC voltages, Vd, induced across the
diode were measured at a frequency of 1 kHz. The line is the least squares fit of the data and allows estimating the value of Ed0. The
related value of offset voltage (≈ 0.7 V, intercept with y-axis) is in good agreement with typical specifications of silicon diodes. (b) Velocity as a function of the external AC field. The line is plotted on the basis of equation (3-4) with only one fitting parameter, β = 3.0. Note that the velocity of the diodes is similar even though there is almost 4-fold difference in their size ... Dependence of the diode velocity on the parameters controlling the electroosmotic propellant force. (a) Diode velocity as a function of pH. The direction of the motion changes at a pH = 6.4, as the surface charge of the resin body changes sign at the isoelectric point. (b) Velocity as a function of the concentration of surfactants. Positively charged surfactant (CTAC) leads to small increase of the velocity by increasing the surface charge. Negatively charged surfactant (SDS) decreases the positive surface charge of the diode to the extent that the charge is reversed and the diode begins moving in the opposite direction. Experiments were performed at Eext = 93 V/cm and 1 kHz.
(c) Diodes can also propel in non-aqueous media. Diode velocity in organic solvents is lower than on water due to high viscosity and lower surface charge. Experiments were performed at frequency 1 kHz. (d) Diode velocity is not a function of the frequency of the external field up to frequencies in the RF region ... Diode propulsion with additional functionality. (a) When Zener diodes are used instead of switching diode the maximal velocity is restricted as a function of the characteristic reverse voltage of the Zener element. The curves are guides to the eye. Experiments were performed at 1 kHz with 10-6 M NaCl solution. (b) Positions of two photodiodes propelling across the same vessel - when either of them is illuminated with a strong beam of light it begins moving slower. Experiments were performed at Eext = 100 V/cm and 1kHz with 10-6
M NaCl solution ... 76
78
82
Figure 3.6
Figure 3.7
Figure 4.1
Flow of particle suspension in a microfluidic channel generated by two diodes embedded in the top and bottom sides of the channel, as observed from above. (a) Optical micrograph illustrating pumping and backflow for diodes with the same orientation. The diodes create a unidirectional flow by moving the liquid adjacent to the wall in same direction. (b) Micrograph illustrating the flow generated by two diodes with opposite orientation. The diodes create a circular flow by moving the liquid adjacent to the wall in opposite directions, which can be used for microfluidic mixing. (c) Velocity of the liquid pumped at the center of the long channel without diodes (circulating through the microfluidic loop) as a function of the external AC field. The error bars reflect the scattering in multiple experimental measurements. Scale bars = 200 µm ... Particle separation inside diode pumping system under simultaneous application of AC and DC field. (a) Particle velocities at the center of the long channel without diodes as a function of the magnitude of the AC and DC components of the external field. The AC-driven diode pumps move the liquid in the positive direction. The increase of the DC component increases the (negative) electrophoretic velocity of the particles. At precisely adjusted values of the DC and AC fields near the position of dynamic equilibrium particles with small differences in surface charge can be separated efficiently. (b) Mobility of two particles of slightly different charge measured in terms of particle position. The particles begin moving together when the liquid is moved by AC pumping at 40 V only. The application of DC field of 4V introduces an electrophoretic component of the motion in a direction opposite to the one of the AC pumped flow. The sulfate latex particle begins moving faster than the fluid, while the amidine latex moves a slower than the surrounding fluid. The particles begin moving in opposite direction and the distance between them increases with time ... (a) Microfluidic device for diode pumping. Two 1-mm long diodes were attached on the channel wall facing in the same direction for diode pump. The electroosmotic flow driven by the diodes was monitored at point (i) between the diodes. The flow velocity of the pump was measured at the centre of the longer channel without diodes (ii), using tracing microspheres. (b) Microfluidic device for diode mixing. The two diodes were attached on the chamber wall facing in opposite directions. Milli-Q water and fluorescent dye solution were injected continuously into each inlet by a syringe pump. The mixing efficiency after applying the external AC field was monitored using
86
Figure 4.2
Figure 4.3
Figure 4.4
Figure 4.5
Figure 4.6
confocal microscope. The microchannels and diodes in both schematics are not to scale ... Flow velocities measured in the microfluidic loop channel at different pH values as a function of AC external field. The lines are plotted by the analytical solution from equations (4-6) and (4-7) with zeta potential as fitting parameter (ζ = +60 mV, +25 mV, -80 mV for pH = 5.0, 6.0, 7.3, respectively) ... Schematic illustration of the localized electroosmotic flow for the pumping in a microchannel with a pair of diodes oriented in the same direction in low pH solutions. The charge at the diode surface results in the formation of an electric double layer. When AC field is applied, the diode shortens the field in one direction and behaves as a near dielectric object in the other ... Flow simulation for the diode pump in the closed rectangular microchannels with embedded diodes using COMSOL software. (a) Computed velocity profiles between the parallel oriented diodes at the channel walls. The velocity vector magnitudes are represented by the lengths of the arrows. Colours show the pressure. (b) Computed velocity profiles for the fluid flow pumped by the diodes in the middle of longer channel without diodes. The direction of the circular flow in the rectangular loop microchannel is the same as the electroosmotic flow on the diode surfaces. The length of the arrows for the velocity magnitude in (b) is magnified for better visualization ... Numerical simulations for the diode pumping in the closed rectangular microchannel. (a) Velocity of the reverse electroosmotic flow between two diodes on the channel walls as a function of the channel width. As the external AC field increases, the electroosmotic flux (negative velocity) on the diode surfaces and the backflow (positive velocity) in the middle of the channel become larger, which match well the experimental observations. (b) Velocity of the flow in the centre of the channel loop without the diodes as a function of the external electric field. The simulation data verify the ability of the diodes on the microchannel to pump liquids through the channel with a linear dependence on the AC field. The simulation results show a good correlation with the experimental data and support the electroosmotic pumping mechanism ... Microfluidic mixing in the channel with two oppositely oriented embedded diodes. (a) Schematic of the generation of the localized
98
101
102
107
Figure 4.7
Figure 4.8
Figure 4.9
Figure 5.1
Figure 5.2
electroosmotic flow in the diode mixer. Two oppositely directed ionic fluxes on the diode surfaces create crossover flows leading to mixing inside the chamber. The diodes and channel geometry are not to scale. (b) Typical confocal micrographs of the microfluidic flows in the diode mixer, after AC external field was applied through the channel at t = 0. The AC external field applied was 133 V cm-1 and 1 kHz. The scale bar in (b) is equal to 500 µm ... (a) Mean fluorescent intensity of the confocal images for the distribution of neutral fluorescent dye in the cross section of the channel at a distance of 2.5 mm from the diode mixer at Eext = 0 V cm
-1
and 150 V cm-1. (b) Mixing index at different AC fields calculated as a standard deviation of fluorescent intensity in cross sectional confocal images as a function of the distance from the Y-shaped channel junction. All experimental conditions are the same as in Figure 4.6 ... Mixing index at various pressure-driven flow rates as a function of the distance from the Y-shaped channel junction. Water and fluorescent dye solution were adjusted to ~ pH 5.4. The AC external field was 133 V cm-1 at 1 kHz. As the flow speed was increased, smaller mixing efficiency was observed. Mixing at high flow speeds could be performed with a series of diode mixers in the channel ... Simulations of the mixing process in a microchannel with oppositely oriented diodes. (a) Concentration distribution in the whole microchannel (top). A series of mixing images within the diode chamber after initial times (bottom). (b) Computed steady state flow profile and concentration distribution within the diode mixer at 300 sec. The magnitudes of the velocity vector are represented by the length of the arrows. Colors show the concentration distribution. The results confirm the creation of crossover flows resulting in enhancement of microfluidic mixing ... Fabrication of photocurable microfluidic endoskeleton structure by filling epoxy-based SU-8 photopolymer into microfluidic channel network. After UV exposure, SU-8 photoresist within deformed channel network is solidified and original deformation of photocurable microfluidic network is retained, even after external force is removed . Orthogonally oriented microchannel structure embedded within PDMS matrix. The channel width and interchannel distance were ca. 400 µm and ca. 250 µm, respectively. The channel thickness was
109
110
112
114
Figure 5.3
Figure 5.4
Figure 5.5
Figure 6.1
Figure 6.2
varied from 150 µm to 450 µm. The microfluidic network in PDMS had a length of 36 mm and a width of 24 mm. The channels in schematic are not to scale ... Photographs of photocurable microfluidic PDMS sheets with embedded microfluidic endoskeleton. (a) A microfluidic material filled with liquid SU-8 photopolymer before UV exposure. After deforming the shape and exposing it to UV light for 15 min, photocured microfluidic composites with solidified SU-8 photoresist can retain the defined shapes, such as (b) wavy, (c) spiral, and (d) saddle. The microfluidic materials were 36 mm long and 24 mm wide. The microchannels embedded in PDMS layers were 400 µm wide and 450 µm thick in (a); 800 µm wide and 165 µm thick in (b); 400 µm wide and 275 µm thick in (c); 400 µm wide and 450 µm thick in (d) … (a) Typical stress-strain curves from tensile tests for PDMS-only layer and photocured microfluidic endoskeleton structures containing different loading of SU-8 photoresist in microchannels. (b) Elastic modulus of PDMS-only layer and photocurable microfluidic networks before and after UV exposure as a function of volume fraction of SU-8 photoresist in PDMS matrix. The modulus of elasticity was obtained from initial linear region of stress-strain curves in (a). The solid lines were plotted by least square function. The dot-dash line was plotted by the estimated values with equation (5-3) ... (a) Load-angular deflection curves in bending tests for PDMS-only layer and photocured microfluidic endoskeleton structures containing different amount of SU-8 photoresist in microchannels. (b) Bending modulus of PDMS-only layer and photocurable microfluidic networks after UV exposure as a function of volume fraction of SU-8 photoresist in PDMS matrix. The bending modulus was obtained from initial linear region of load-angular deflection curves in (a) using equation (5-4). The line in (b) is a guide to the eye ... (a) Schematic of the gel diode device. Two slabs of aqueous agarose gels containing oppositely charged polyelectrolytes and corresponding counterions are sandwiched between platinum electrodes and sealed by PDMS spacers. (b) Schematic of the ion migration in the gel diode at forward bias and (c) at backward bias ... (a) Current density as a function of applied bias for junctions prepared from different gel combinations. Each gel layer was 1 mm thick and was desalinated for 2 hrs in DI water except for the pure agarose gel
124
125
127
129
Figure 6.3
Figure 6.4
Figure 6.5
Figure 6.6
layer, which was used without desalination. The I-V curves demonstrate that only junctions prepared from two oppositely charged polyelectrolyte gels show significant current rectification. (b) Current density as a function of applied bias for junctions prepared from agarose gel layers containing different amounts of polyelectrolytes. Each gel layer was 1 mm thick. All gels were desalinated for 90 min in DI water. Sweep scan rate was 100 mV/sec ... (a) Current density as a function of applied bias for a gel diode junction after different desalinating times. The two gel layers contained 7.0 wt% PSS and 5.0 wt% PDAC in 2.0 wt% agarose gel, respectively, and were 1 mm thick. Sweep scan rate was 100 mV/sec. (b) Current rectification ratio at +/-5 V under forward and backward biases as a function of the gel desalinating time. Although the overall conductivity of the gel diode decreases with increasing gel desalinating times, the current rectification ratio is significantly improved ... Current density as a function of applied bias for gel diodes of different thickness. The two gel layers contained 14.0 wt% PSS and 10.0 wt% PDAC in 2.0 wt% agarose gel and were desalinated for 2 hrs in DI water. Sweep scan rate was 100 mV/sec. The current increase in forward bias for thinner devices is a consequence of smaller distances of migration for the counterions resulting in higher electric field strength across the gel interface. The depletion region around the gel interface due to the formation of water and motion of the counterions toward the electrodes results in low currents independent on the device thickness for backward bias. Note that in the case of the thinner device the current densities measured reached 50 mA/cm2 before the final +5V voltage; one can assume that higher current densities can therefore be achieved ... Current density measured at different sweep scan rates as a function of applied bias for a diode junction composed of two gel layers containing 7.0 wt% PSS and 5.0 wt% PDAC in 2.0 wt% agarose gel. Each gel layer was 1 mm thick and was desalinated for 2 hrs in DI water ... Current density as a function of applied bias for a diode junction during a forward scan (0 to +5V) and a backward scan (+5 to 0V) at a sweep scan rate of 100 mV/sec. The two layers contained 7.0 wt% PSS and 5.0 wt% PDAC in 2.0 wt% agarose gel. Each gel layer was 1 mm thick and desalinated for 4 hrs in DI water. The current response
140
142
144
Figure 6.7
Figure 6.8
Figure 6.9
of the gel diodes shows some degree of hysteresis probably resulting from the ionic mobility ... (a) Time dependence plot of current density and current rectification ratio from a typical gel diode at constant forward (+5V) and backward (-5V) bias. Under continuous application of constant voltage across the junction, the currents in both directions stabilized rapidly and then remained constant. (b) Current rectification ratio at 30 min after applying constant voltages of +/- 5V with different desalination times. For both plots, the gel diode was constituted of two gel layers containing 7.0 wt% PSS and 5.0 wt% PDAC in 2.0 wt% agarose gel. Each gel layer was 1 mm thick and desalinated for 17 hrs ... Time dependence of current rectification ratio and current density for a typical diode composed of two layers containing 7.0 wt% PSS and 5.0 wt% PDAC in 2.0 wt% agarose gel. Each gel layer was 1 mm thick and was desalinated for 5 hrs in DI water. The currents through the system were measured with DC sweep scanning. The diodes showed stable current response and stable rectification ratio for more than a week ... Current response of a gel diode under AC field of 50 mHz. The oscillogram of the voltage applied is plotted on the bottom. Two gel layers contained 7.0 wt% PSS and 5.0 wt% PDAC in 2.0 wt% agarose gel. Each gel layer is 1 mm thick and desalinated for 19 hrs in DI water ...
145
146
147
Chapter 1
1.1. Introduction
Microfluidics is the science and technology of systems for controlling and manipulating small volumes of fluids through devices with at least one dimension in the micrometer range.1,2 A large body of research in microfluidics has been performed in the multidisciplinary research areas of physical, chemical, and biological sciences. Microfluidics offers significant advantages, including a reduction in sample and reagent consumption, short times for analysis, performance with high sensitivity, low production cost, easy automation, and fabrication of portable and disposable devices.2-6 The primary focus of my graduate research has been to develop and implement tools and techniques for manipulating fluids and colloidal particles using evaporation and electric field induced forces that can deliver additional functionalities in microfluidic systems. This chapter overviews the field of microfluidics and provides a brief review of recent developments in new types of microfluidics applications.
1.2. Brief Historical Overview of Microfluidics
µTAS included a single on-chip chemical sensing system incorporating all of analytical procedures (sample pretreatment, separation, and detection) into microfluidic system. A further boost in the microfluidics research was driven by support from the US Defense Advanced Research Projects Agency (DARPA) for developing field-deployable detectors for chemical biological warfare threats and the needs of new microanalytical methods in the field of molecular biology, such as high-throughput DNA or protein analysis.6,14-16
Earlier work in microfluidic devices was mostly performed in silicon and glass substrates. Microfluidic components (pumps,17,18 valves,19,20 mixers21) were fabricated in these rigid materials for chip-based analysis, such as phosphate sensing22 and fast separation of amino acids and dyes by capillary electrophoresis.23-25 Many more materials, notably plastics, are now being used. One particular polymer that has been used extensively is poly(dimethylsiloxane), or PDMS, where the microfluidic structures are fabricated by using rapid prototyping or soft lithography.1,6,15,26-29 This elastomeric polymer offers potential advantages over the silicon of optically transparent surface, faster fabrication time, flexibility, and permeability to gases required for experiments with living mammalian cells.4,6,30,31
Figure 1.1. A wide range of applications in microfluidics utilizing many principles to
transport and analyze small volumes of liquid.29 SAW refers to surface acoustic wave, EOF to electroosmotic flow, EW to electrowetting, EHD to electrohydrodynamics, DEP to dielectrophoretic pumping, MIMIC to micromolding in capillaries, CFL to capillary force lithography, FIA to flow-injection assays, and POC to point-of care.
in its infancy, impressive progress has been made in the development of innovative experimental tools replacing macroscale conventional methods. Numerous applications of the microfluidics, taking advantage of various phenomena in microfluidic devices are shown in Figure 1.1.29 Microfluidic research on the topics of micro pumps/mixers,5,32-35 separation processes,36 biological assays,29,30,37,38 protein crystallization,39 proteomic and genomic analysis,15,40,41 clinical and forensic applications,14,16,42,43 drug discovery,44-46 and material synthesis3,47-49 has been recently reported. During the design of the microfluidic devices in the above practical applications, a major challenge is the investigation of transport processes of fluids, colloidal particles, and biomolecules through microchannels. Since Manz et al.
published their seminal work of miniaturized chemical analysis systems using electroosmotic pumping and electrophoretic separations,25,50 electrokinetic forces have been widely used in the development of lab-on-a-chip devices. The next section includes a brief overview of the electrically induced forces for manipulating particles and microflows.
1.3. Electrokinetic Phenomena for Manipulating Microflows
New designs for driving fluid motion are needed in microfluidic devices using physical phenomena that are usually neglected in the macroscale. As the dimensions of channels decrease to microns, the importance of interfacial phenomena increases due to large surface-to-volume ratio.1,2,4,51 Fluid manipulation in the microfluidic devices is greatly dominated by surface tension, capillary effects, electrokinetic effects, and viscous force rather than inertial force.1,2,5 The flow in microchannels is laminar due to the low Reynolds number, making
molecular diffusion essential to microfluidic mixing.5,34,35,52 The motion of fluids and particle
suspensions at this small-scale are driven by pressure gradients,53,54 capillary pressure differences,55-58 or surface tension gradients,59-61 as summarized in Table 1.1.
microfluidic devices based on the electrokinetic phenomena is the relative simplicity of operation, with no requirement for external mechanical moving parts.34,64,66 This advantage of electrokinetic forces allows fabrication of portable microfluidic devices.
Electrokinetic forces are acting on fluids and particles suspended in the fluids and causing their motion, when they are subjected to the electric fields. Various types of electrically induced forces under the action of direct current (DC) and alternating current (AC) fields can be used for the manipulation of the fluids or particles. Electrically charged particles or molecules in liquid media experience attraction towards the electrode of opposite charge under constant electric fields. This effect is called electrophoresis (EP) and arises from the motion of counterions surrounding the charged particle. The counterionic movement in the liquid layer adjacent to charged solid surfaces initiates electroosmotic flow (EOF) in the bulk fluid under the DC or AC electric fields. Another electrically induced effect that can be used for the manipulation of particle suspensions in microsystems is dielectrophoresis (DEP), which is based on the polarisation of dielectric particles in a non-uniform electric field. These electrically induced forces will be reviewed in more detail in the next subsections.
Table 1.1. Summary of the driving forces and external fields used to manipulate flows in
1.3.1. Dielectrophoresis
When a polarizable particle is subjected to an inhomogeneous electric field, a dipole is induced in the particle. The interaction of the induced dipoles with the gradient of the field gives rise to attraction or repulsion of the particles from the high electric field region, depending on their polarizability compared with the surrounding medium as shown in Figure 1.2. This motion of particles suspended in a medium under the non-uniform electric field gradient is termed dielectrophoresis (DEP).67 In AC electric field, the DEP force leads to net particle displacement due to its non-zero time average.65,68-70 The use of AC field in DEP, in particular, allows the application of high field strengths without electroosmotic flows and electrolysis.62,71,72
Figure 1.2. Dielectrophoretic force moves the particle along the gradient of the electric field,
∇E. The particle is either attracted to or repelled from the high field intensity region based on the sign of K.
The time averaged DEP force, FDEP, is given by63,67,72
2
3Re ( )
2 r K E
FDEP= πεm ω ∇ (1-1)
where r is the radius of the particle, εm is the dielectric permittivity of the medium, E is the electric field intensity, and K(ω) is the Clausius-Mossotti factor, i.e., the particle’s effective polarizability in media. The sign of the force on the particle depends on the real part of K(ω),
) 1 ( ) 2 ( ) ( 3 2 ) (
Re 2 2 2
MW m p MW m p p m m p m p K τ ω σ σ τ σ ε σ ε ε ε ε ε ω + + − + + −
= (1-2)
Maxwell-Wagner charge relaxation time, expressed as τMW =(εp+εm)/(σp +2σm) .
Therefore, the direction in which the particle moves is not only determined by the properties of the particle and the medium but also the frequency of the applied field. For dielectric particles, the sign of the real part of K(ω) is changed at a crossover frequency of
1 )
( −
= MW
c τ
ω .62,68,71 When ReK(ω) > 0, the particle is attracted toward the electric field
maxima (positive DEP). Otherwise, the force on the particle is toward the lower field region (negative DEP). Such particle control using DEP has been used in many applications, such as assembly of microwires from metallic nanoparticle suspensions,71,73 colloidal crystals,74,75 and separation of dielectric particles.76-79 A microfluidic mixer was also developed on the basis of DEP actuation, which induced chaotic trajectories of suspended particles.80 DEP has found many useful biotechnological applications in biosensors,81 separation and manipulation of biological particles such as yeast cells, viruses, and DNA.82-87
1.3.2. Electroosmosis
Electroosmosis (EOS) is the fluid motion induced by applied electric field due to the formation of electric double layer (EDL) at stagnant charged surfaces.69,88,89 The charging of a surface in an electrolyte solution can arise from the ionization or dissociation of surface groups or from the adsorption (binding) of ions from the bulk solution onto a surface.90 An
that depends solely on the properties of the electrolyte solution and not on the properties of the charged surface,66,69,72,88,90
2 / 1
0 2 2
⎟ ⎟ ⎠ ⎞ ⎜
⎜ ⎝ ⎛
=
∑
∞i m i i
T k
z e
ε ε ρ
κ [m-1] (1-3)
where ρ∞ is the concentration of ions in the bulk, e is the electronic charge, z is the ion valency, ε0 is the dielectric permittivity of vacuum, k is the Boltzmann’s constant, and T is the temperature of the system. The potential across the diffuse layer decreases exponentially.
When a constant (DC) electric field is applied parallel to the surface, the ions in the diffuse layer are attracted electrostatically towards the oppositely charged electrode. Since the counterions are predominant in the diffuse layer, a body force induced by dragging the liquid or solvent molecules around the ions in the EDL gives rise to a bulk fluid motion called electroosmotic flow (Fig. 1.4a). The velocity of the fluid is zero at the substrate surface and increases to a maximum value at a shear plane, resulting in a constant velocity through the bulk liquid phase.
Figure 1.3. Schematic of electric double layer formation at the interface of charged surface
The flow velocity of EOF, uEOF, is obtained by the balance between the electric force
acting on the liquid and the frictional force ( Helmholtz-Smoluchowski equation),88,89
η ζ
ε E
u m
EOF =− (1-4)
where εm and η are the dielectric permittivity and the dynamic viscosity of the solution, respectively, E is the electric field intensity, and ζ is the potential at the shear plane, which is defined to be the interface between a moving fluid and an immobile region, called the zeta potential. This EOF has been used to inject samples into microfluidic devices.91-94 Valveless control of fluid flow in complex networks of intersecting capillaries had been demonstrated using EOF pumping by switching on/off different electrodes.95,96 The magnitude and direction of the EOF in the microchannels had been controlled by changing zeta potential from the application of a perpendicular electric field through the channel wall.92 The EOF on the surface patterned with heterogeneous charges can be used for microscale mixing.97-99
Figure 1.4. Schematics of different types of electroosmotic flow in electric field applications.
Instead of the fluid response to the constant (DC) electric fields, fluid flows could be generated with microelectrodes locally integrated in microfluidic systems under the applications of AC electric field. The AC electric potential applied to the electrodes changes the native charge on the electrode surface and forms induced EDL, leading to an induced zeta potential. The ions in the induced EDL on the electrodes interact with the tangential component of the AC electric field and give rise to bulk fluid movement directed towards the electrodes. This phenomenon is called AC electroosmosis (Fig. 1.4b). In the AC electric field, the ions in the induced EDL and the tangential electric field change simultaneously with the cycles of applied AC electric field. Therefore, the direction of the net AC electroosmotic flow remains the same through the each half cycle of the AC electric field. The flow velocity of AC EOF is given by69,100
η ζ εm ind t EOF
AC
E
u =− (1-4)
where ζind is the induced zeta potential due to the applied electric field and Et is the tangential component of the AC electric field. The AC EOF shows strong dependence on AC field frequency, which has a specific range for efficient flow velocity and otherwise tends to be zero at low and high frequencies.101 The AC electroosmosis has been found to be a contributing force in collecting particles and cells with planar electordes.63,65 The AC field applied to a system consisting of patterned vertical electrodes led to particles or yeast cell concentration in the center of conductive "corrals" on the silicon wafer acting as bottom electrode with the combination of DEP and AC electroosmosis.100 AC fields were applied to dilute suspensions of latex microspheres enclosed between a patterned silicon wafer and an ITO-coated glass slide in a small chamber. The latex particles became collected in the center of the conductive "corrals" on the silicon wafer acting as bottom electrode. With optimization of the operating parameters in the AC EOF, the concentration of λ phage DNA and single strand DNA fragments as small as 20 bases had been demonstrated.102 The AC EOF on
driving voltage.63,103,104 In the next section, we will describe a new type of microfluidic
devices and novel applications of micro- and nanofluidic phenomena.
1.4. New Types of Microfluidic Systems and Various Applications of Microfluidics and Microflows
1.4.1. Droplet-Based Microfluidics
Since the advent of microfluidics, the motion of liquids and particles in most lab-on-a-chip devices has been conducted in continuous single flow systems. These conventional microfluidic chips could have drawbacks, including adhesion of suspended particles, cells or proteins to the walls, and undesired clogging of channels.105,106 Multiphase flow systems in the form of droplets or channel-spanning slugs have emerged as an alternative technology in the microfluidics with potential advantages of enhancing the performance of the single phase flow systems.2,64,106,107-109 Droplets surrounded by an immiscible fluid like oil or air in microchannels can avoid lateral dispersion (Taylor dispersion). Discrete tiny droplets enable fast thermal transfer and rapid mixing due to high surface to volume ratio, resulting in decreased reaction times. In addition, the droplet-based microfluidic platforms are well suited for high throughput screening applications, because almost identical droplets can be produced at high frequencies and multiple reactions or assays are enabled without increasing the size of devices or complexity.
Depending on the mode of droplet actuation, droplet-based microfluidic systems can be categorized into two platforms, channel-based (one-dimensional) and planar surface (two-dimensional) approaches.64 Since droplet formation at the junction of two microchannels
containing water and oil surfactant mixture was demonstrated by Thorsen et al. in 2001,110
Figure 1.5. Manipulation of droplets in microfluidic channels. (a) Formation of water-in-oil
droplets with T-junction110 and (b) flow focusing design.116 As oil flow rate increases (from left to right in (b)), droplet size is reduced with increasing frequency of formation. (c) Passive fusion of a series of three droplets in flow rectifying design120 and (d) active fusion of water droplets with two different sizes by an electric field when they pass over the electrodes.121 (e) Sequential breakup of droplets in a series of T-junctions and (f) fission of water-in-oil droplets caused by a square obstruction in a microchannel.119 (g) Mixing inside liquid plugs traveling through winding channels.118 (h) Gaseous slugs flowing through a microchannel network lead to stretching and folding of continuous phase liquids.122
enhanced by internal recirculation during the transportation through winding channels118 and
gaseous slugs flowing through microchannel network also led to effective microfluidic mixing of continuous fluids.122 Excellent reviews on more details behind these operations of droplets in the microchannels have been published in recent years.2,109,123-125
The droplets streaming in the microchannels can be used as reaction confinement sites for material syntheses and bioassays. Jensen et al. synthesized colloidal nanoparticles,
e.g., silica nanoparticles and CdSe quantum dots, in segmented gas-liquid flows with a narrow size distribution.126-128 Droplets obtained in the flow focusing device or T-junction configuration have been used for continuous synthesis of various types of polymer particles by solidifying the droplets, resulting in highly monodisperse,129 nonspherical,130 Janus,117,131 and mesoporous silica microparticles.132 Weitz et al. showed monodisperse double or multiple emulsions using the flow focusing technique by interleaved glass capillary arrangements and demonstrated uniform microencapsulations, functional microgels, and nanoparticle colloidosomes with selective permeability.133-136 Protein crystallization has been performed in nanoliter-size droplets transported inside glass capillaries by Ismagilov et al.137,138
In the planar surface-based systems, discrete droplets are manipulated on a two-dimensional (2D) array of electrodes configured for electrowetting on dielectric and dielectrophoresis. This type of droplet-based microfluidic device has additional advantages of more compact and simple system by eliminating external pumps and channels, independent control of many droplets, and easy automation under software-driven electronic control. Droplets controlled by using electrowetting is sandwiched between two planes.139,140
Droplet mixing on the electrowetting-based microdevice was accomplished by oscillating the droplet placing between two electrodes (Fig. 1.6b).144,145
Figure 1.6. Manipulation of droplets on planar systems. (a) Dispensing of uniform
microdroplets from on-chip liquid reservoir.140 (b) Time-lapsed images of mixing in oscillating droplets on two electrodes at 8 Hz of frequency.144 (c) Sequential images of breakup and merging of droplets through surface electrodes.142 (d) Droplet and particle entrapment in DEP-based chip.149 Multiple droplets of 1µL containing polystyrene microspheres are trapped by DEP above electrode matrix in a fluorinated oil layer. Anisotropic eyeball supraparticles and striped multilayer particles are synthesized in the floating aqueous droplets.
electrowetting-based devices. This allows completely avoiding the droplet contact with solid surfaces. The surface contamination is reduced or eliminated. Jones et al. demonstrated uniform aqueous droplet dispensing in an open structure consisting of parallel, coplanar electrodes coated dielectric layer.146-148 Velev et al. developed a new type of DEP-based lab-on-a-chip system for manipulating freely suspended droplets without any contact with solid surface (Fig. 1.6d).105,149 Water or hydrocarbon droplets floating on a dense fluorinated oil were transported synchronously in parallel or merged for rapid mixing by applying AC electric field through electrode arrays under the oil. Gascoyne and co workers demonstrated programmable fluidic processors based on DEP force.150,151 Water droplets were formed at pressurized orifices near electrodes and manipulated in an immiscible, low permittivity medium on electrode arrays.
Electrophoretic separation and concentration of suspended particles in the droplets driven by the electrowetting were demonstrated by Kim et al.152 Fair et al. performed a colorimetric enzymatic glucose assay on human physiological fluids with a fully integrated and reconfigurable electrowetting-based microdevice.153 Each of droplets controlled by the DEP-based liquid chip system was served as a microreactor. Velev et al. demonstrated on-chip assembly, drying and polymerization to create binary or ternary supraparticles, polymer capsule and semiconducting microbeads, and particle agglutination immunoassay.149, 216
1.4.2. Autonomously Moving Microdevices
macroscopic movements.154,157 Another obstacle for the propulsion of microdevices in a fluid
phase is numerous Brownian collisions between molecules and microscale objects.90,158,159 Dusenbery reported that minimum size limit for useful locomotion by free-floating bacteria is about 600 nm diameter due to the Brownian collision.160 Therefore, key to the development of self-propelling micromachines is the formulation of effective propulsion force for driving their motion in the low Reynolds number regime.
Figure 1.7. Examples of autonomously moving hybrid systems, combining synthetic
components and biomolecular motors. (a) Superimposed time-lapse images showing the motion of crescent-shaped and spiral-shaped cells, swimming immediately after its release into solution.168 (b) Schematic of surface-bound kinesin motor proteins to transport functionalized microtubule shuttle along patterned tracks.167 (c) Schematic illustration of a
microrotor (20 µm diameter) driven by the gliding bacteria that adhere to the rotor (top) and time-lapse photomicrographs of a unidirectionally rotating rotor within the track (bottom).170
triphosphate (ATP).161-163 Flagella biological motors in some microorganisms, like Escherichia coli, provide locomotion to the bacterial cell body in the fluid environments through a ‘corkscrew’ motion of the flagella.154,164,165 Montemagno et al. demonstrated a hybrid rotary device assembled from an enzyme ATP synthase and submicrometer-sized nickel rods.166 Kinesin motor along photolithographically predefined tracks on a surface was used for transporting functionalized microtubules as material shuttles.167 Filamentous cells of
E. coli grown in microchambers patterned in agarose gel have been observed to form crescent, zigzag, sinusoidal, and spiral shapes and self-propelled in solution without releasing the defined shapes.168 Whitesides et al. showed that motile unicellular algae served as a transporter of polystyrene microspheres in a microfluidic chip by phototaxis.169 Hiratsuka et al. reported another hybrid micromachine of unidirectionally rotating microrotor powered by a motile bacterium adhered to the rotor.170 The problems encountered in developing hybrid micromachines from the point of view of application are inconvenience and production of waste from chemical fuelling, limited durability and operating conditions outside the cellular environments, and difficulty of controlling their motion.
In recent years, autonomous mechanical movement of artificial molecular motors or micromachines has begun to be investigated. The self-propelling synthetic devices could provide more robust, practical applications than their natural counterparts. Asymmetrical structure in the device design, power source for the propulsion, and its transduction to the mechanical forces are essential to the developments of self-propelling artificial microdevices.157,159,171
A number of synthetic molecular machines have been made of light-responsable organic molecules as a linear shuttle, rotor, and molecular elevator.172-174 Vicario et al.
demonstrated the rotation of micrometer-sized glass rod induced by the light-driven molecular motor doping in a liquid crystal film.175 Most intense research for the autonomously moving micromachines has been conducted by using catalytic decomposition of hydrogen peroxide (2H2O2 Æ O2 + 2H2O), resulting in a nanobubble generation.
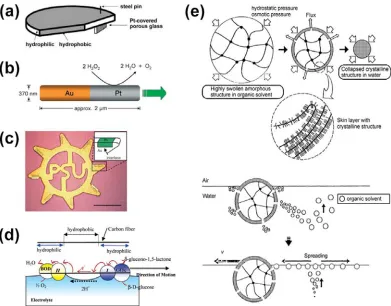
Figure 1.8. Examples of spontaneously propelling artificial nano- and micromachines.
(a) Schematic of a self-propelling machine consisting of a PDMS plate (1 ~ 2 mm thick and 9 mm diameter) and a porous glass filter covered with platinum.176 (b) Schematic of an asymmetric gold/platinum nanorod propelled predominantly along its axis in the direction of the platinum driven by the catalytic decomposition of hydrogen peroxide fuel.159,177 (c) Photograph of a gold gear with platinum deposited in the tooth regions. The arrow in the inset indicates the region where the surface tension gradient is formed (scale bar is 50 µm).182 (d) Schematic illustration of a self-propelled bioelectrochemical motor driven by the reaction of glucose and oxygen based on functionalized carbon fibers with two redox-coupled enzymes.184 (e) Schematic illustrations of extraction of organic solvent from a solvent-swollen polymer gel (top) and the mechanism for its motion due to solvent spreading at the air-water interface (bottom).188
structures.176 Various types of artificial nanometer-sized objects in the form of gold/platinum
of viscous friction, or something else entirely.159,171 Mano and Heller described a
bioelectrochemical locomotion induced by the reaction of glucose and oxygen at the floating carbon fiber functionalized with two redox-coupled enzymes.184 Asymmetric releasing of surface active agents can impart spontaneous motion to small objects floating at the air/water interface by lowering surface free energy. Preferential dissolution of a camphor placed on water surface caused the self-motion of the camphor boat by creating a gradient in surface tension of air/water interface.185-187 Osada et al. demonstrated self-propulsion of organic solvent-swollen amphiphilic polymer gels, when they were placing on the water surface.
188-191 The swelling solvents asymmetrically ejected by osmotic and hydrostatic pressures across
the crystallized polymer layer reduce the surface tension locally and lead to the solvent-driven spontaneous gel motion.
1.4.3. Ionic Current Control in Micro- and Nanofluidic Systems
Ionic transport in nanoscale structures has attracted broad interest in various research fields, motivated by ionic transport through biological channels or lipid cell membranes in many physiological processes of a living organism.192-194 Channel structures on nanoscale range have also promising potential for ultrasensitive detection of a single molecule or biomolecule. The nonlinear current resulting from the preferential direction of the ion flow has been used for signal transmission as well as signal processing, like ionic current rectification and amplification as in electronic circuits. Advantages of the electronic signal processing systems using the ionic current conduction is the capability of operation in aqueous phase and biomedical and chemical applications in molecule delivery and sensing.
Initially, current carried by ions was investigated with the aim to develop electronic devices analogues to semiconductor diodes and transistors. Lovreček et al. showed in 1959 ionic current rectification using an electrolytic junction, so-called electrolyte diode, which consisted of proton-rich and hydroxide-rich electrolyte solutions separated by thin bipolar membrane.195 The flow of ions across the electrolytic junction was considered a replacement of the motion of electrons and holes in the semiconducting p-n junction. Noszticzius et al.