a Corresponding author: [email protected]
CFD analysis of optical probe interaction with wet steam flow field
Michal Kolovratníka, Gukchol Jun, Ondřej BartošCTU in Prague, Department of Energy Engineering, Technická 4, Prague 6, 166 07, Czech Republic.
Abstract. In the frame of the measurement feasibility study of the liquid phase size distribution structure in steam turbines at intermediate and high pressures, on CTU the interaction of optical probes with the wet steam flow field is investigated. In order to validate and refine the existing knowledge, a new series of CFD simulations were performed, considering turbine flow geometry, water steam characteristics according to IAPWS97 formulation, and improved boundary conditions and quality of the computing mesh. This paper briefly presents the newly obtained results
1 Introduction
The current worldwide energy consumption of primary sources is about 19 TW. More than one third of this consumption is used in the technologies converting the primary sources to electricity. There is no doubt that for the next few decades the dominant conversion technology will be steam turbines in power plants using fossil fuels and nuclear energy as well as renewable energy sources. This is tightly linked with the emphasis on sustainability, which requires an increase in the primary energy utilization efficiency. One of the options and challenges is the further development and improvement of current steam turbines, specifically in handling the issue of two-phase flow of wet steam.
The presence of wet steam in the turbine flow part negatively affects their reliability and efficiency. Erosion and corrosion-erosion damage are known and the additional energy losses due to wetness are also significant. In practice, however, it is not advantageous or practical to exclude wet steam from steam turbines. It is therefore necessary to address the problems of two-phase flow both theoretically and experimentally; to actively model and modify the geometry of the flow part of the turbines based on the acquired knowledge; to develop a methodology of their operation so that the negative effects of wet steam flow are suppressed and to keep these effects within acceptable limits.
Experimental studies of the liquid phase structure of wet steam expanding in a steam turbine are integral to these activities. Wet steam research has been going on for decades with varying intensity. However, it has consistently focused on low-pressure (LP) turbines and mainly on the last stages of these turbines operating below atmospheric pressure. For a number of reasons, attention has also recently been focused to phase change and two-phase flow at high-pressure (HP) [1, 2]. The starting point for these theoretical
analyses and the demanding laboratory experiments are several remarkable works of the last century, especially [3, 4, 5, 6]. The focus of these activities is primarily connected with the HP part of nuclear power plant technology with PWR, more recently with the use of renewable energy sources as well as with conversion technologies in which heat transferring water is replaced by other liquids which are more suitable for the given conditions.
Similarly, at Czech Technical University in Prague (CTU), research was launched on wet steam at high pressure in power systems. Attention has mainly been focused on the modelling of the formation and development of two-phase flow in multi-stage HP steam turbines and on the modelling of energy losses.
CTU traditionally focuses on the development of optical probes for wet steam measurement in LP steam turbines in conventional and nuclear power plants and on the application of these probes for measurement in the turbines in cooperation with Doosan Škoda Power s.r.o. (DSP). Therefore, this work is also focused on considering various possibilities for transferring the experimental research of HP wet steam from the laboratory to the turbines or, in the case of nuclear power plants, to the separators. In addition to the many technical problems associated with the higher pressure and temperature, such as inputs for the instrumentation and seals for its insertion into the operating systems, the question arises as to the choice of a suitable method of measurement in an optically dense environment.
of this interaction. The results will also subsequently be applied to the conditions of the stages of the HP steam turbine.
The presence of the probe always affects the wet steam flow field. In the first step, the character and intensity of this influence must be solved for the specific flow-through section and the geometry of the selected probe. The second step is to assess the impacts on the measured values and subsequently evaluated parameters. Therefore the following is a description of the geometrical setup and the dependence of the parameters for the given optical probe.
2 Optical measurement in the steam
turbine
The shape design of the CTU probe head for measuring the wet steam characteristics, the positioning and placement of the probe in the turbine, and the principles of the optical measurement methods used have been described in more detail in the previous work [7]. Therefore, the following is only a brief overview of this issue, clearly documented by Fig. 1
Fig. 1 The placement and positioning of the probe in the LP turbine
The end part of the cylindrical probe consisting of its head (21/25 mm diameters) and a positioning carrier (35 mm in diameter, 4.5 m long) can be seen on the right side of Fig. 1. A measuring slot of 20 x 13 mm is cut out in the cylindrical head, its borders on the sides are defined by ribs carrying the tip of the probe. Parallel to the probe axis, a 4 mm diameter light beam passes between glass windows through the measurement slot. These windows are embedded 0.7 mm below the plane of the wall of the measuring area. Geometrically the active measurement volume in the measuring slot, which the wet steam passes through, is a cylinder with a diameter of 4 mm and a length of ℓ = 21.4 mm (shown in Fig. 1 in yellow). From the decrease of the light intensity (I0 → I) due to light
scattering on the droplets passing through this
measurement volume in the wet steam, it is possible to evaluate the desired characteristics of the liquid phase, i.e. droplets size distribution and wetness at the measuring point. The dependence of the measured I/I0
relative light attenuation on the measured quantities is described by the Lambert-Beer law. It can be written in a simple illustrative form valid for a monodisperse droplet size distribution:
ቀூబ
ூቁ ൌ ͳǤͷ ௬ ℓ
ఘೈೄሺఘ′ǡఘ′′ǡ௬ሻ
ఘ′ ܳሺ
గ
ఒሻ (1)
where I0 is the intensity of light on the inlet of the measuring volume; I the intensity of light on the outlet of the measuring volume; y is steam wetness; D is droplets diameter; ℓ is the length of the measuring beam of the probe; ’, ’’and WS is the density of the liquid phase,
gaseous phase and wet steam respectively; Q(D/) is the coefficient of light extinction according to Mie theory and is the wavelength of the light. The measurement is performed with a wave length between ~200-1000 nm. On the bottom left side of Fig. 1 is schematically shown the location and measurement position of the probe in the gap between the rotor blade plane of the second last stage
L-1 and the last L-0 stage of the LP part of the turbine as the measuring plane A with a slope of ~ 10° from the radial plane.
The measured light intensity attenuation is used to characterize local conditions of the wet steam in the measurement volume. To obtain more comprehensive information the measurement is repeated in a number of positions z along the blade height. The traversing of the probe between these positions and its rotation for alignment with the flow field (according to the angle of the probe probe) is enabled by the carrier. Only the probe angle (probe) is fixed by the design and cannot be changed.
3 Flow field properties influenced by the
probe
Ideally, without affecting the flow field, the wet steam parameters in the measuring volume would match the parameters at the same location without the presence of the probe.
The density WS in the probe would correspond to the
pressure measured in the same position by the calibrated DSP air probes (Note: the effect of these probes on the flow field is not within the framework of this paper). Under real conditions, the flow field around the probe is influenced by the measuring probe head and varies in intensity depending on the length of the probe carrier inserted into the turbine. At the same time, in the measuring section of the probe due to acceleration, breaking and flow separation, the wet steam may change its density and other parameters. If we accept the simplistic assumption that the droplet dimensions and steam wetness would not change, the deviation of the measured attenuation of the light would arise from the change in density as derived from equation (1).
cannot be neglected. Due to the many simplifications used in the initial CFD analyses (hereafter OLD), the focus of the CFD approach to real-life conditions was taken into account in the new analyses (hereafter NEW). The primary objective of these works was to verify the validity of the existing results and to enhance them further.
4 Previous versus new results
In the new analyses some enhancements were made. The most significant changes included: the extension of the modelling region, an improved computational mesh, the enhancement of boundary conditions, and the originally used ideal gas was replaced by real steam.
Two coloured rectangles in Fig. 1 characterize the extended modelling region of the flow field used for the CFD analyses. The original area used in 2016 is bound by the red line; the new one is shown by the green rectangle. The change in boundary conditions is related to the extension of the computational model to the entire turbine stages. This allows for more detailed and relevant specification of the overall pressure and temperature profiles and flow directions into the subdomain between the stages comprising the probe. The same applies to output parameters from this subdomain, especially for the static pressure distribution and the output flow direction profile. A more detailed specification of the boundary conditions should provide a numerical simulation closer to the real steam flow in the probe and its vicinity. Another change concerns the working fluid media. In the new calculations the real steam is considered according to IAPWS IF 97. Compared to the old calculations with the ideal gas, this has a number of advantages including the potential for refining the results. One example of such an advantage is the possibility for direct monitoring of the influence of the probe on the equilibrium wetness as documented in Fig. 2. Of course, the results of the original calculations with the ideal gas could not provide any information about the wetness at all.
Fig.2 Influence of the probe on the equilibrium wetness - longitudinal section of the computing domain
A significant change is also achieved in the quality of the computing mesh. The computational mesh of the old calculations was prepared in ANSYS Meshing and contained mainly tetrahedral and wedge cells. The mesh for the new computations is prepared using ANSYS ICEM with the use of the appropriate topology technique.
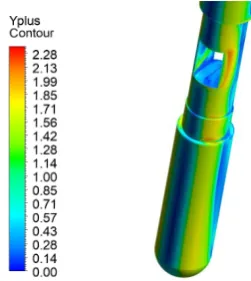
As a result, the new mesh only contains hexahedral cells and a significantly improved convergence is achieved in the new calculations. At the same time, significant improvements have been achieved in the boundary layer behaviour modelling around the probe surfaces. In particular, the newly prepared mesh provides values of the y+ <2.3 as documented in Fig. 3.
Fig.3 Improving the quality of the boundary layer modelling - y+ distribution
For comparison, in the old computing mesh, the maximum y+ value was approximately 50.
5 CFD modelling of the probe influence
Computational model and the meshThe domain of the new computational model is shown in Fig. 4. The model contains both the second last (L-1) and the last stage (L-0) of the ETE turbine as well as a part of the axial diffusor. The optical probe is located in the space between the rotor blades of the second last stage and the stator blades of the last stage of the turbine. The probe is "traversed" for each measured point along an axis which is inclined from the radial by 10°. The mesh for the blades of both stages is prepared in ANSYS TurboGrid, and the part of the model where the probe is and the part of the axial diffuser are meshed in ANSYS ICEM. Thanks to the suitably chosen topology technique, the model is completely meshed in hexahedral cells. The total number of computing cells is approximately 30 mil.
Fig. 4 A longitudinal view of the axial section of the new computational model
Fig.5Computational mesh view
Boundary condition setting
At the inlet of the domain a "pressure - inlet" condition type with total pressure and enthalpy profiles was set together with the corresponding flow directions. Instead of the total temperature profile, the total enthalpy profile was used, because the steam is already wet at the inlet to the second last stage. The total pressure and the total enthalpy profiles of the steam set for the inlet are shown in Fig. 6.
The outflow of the model is a "pressure - outlet" condition type. Here the corresponding static pressure is set with respect to a "Radial Equilibrium" condition. The boundary conditions are summarized in Table 1.
Tab. 1 Summary of the boundary conditions
Inlet Outlet Boundary condition Pressure inlet Pressure outlet
Set v
alu
es Total pressure Static pressure [Pa] [Pa] Profile - 28800 -
Total enthalpy [K] Profile - Turb. intensity [%] 5 -
Fig.6 Total pressure and enthalpy distribution along the radial coordinate of the blade
For all the calculations, the two-equation SST k-ω turbulent model was used. The real steam properties according to IAPWS IF 97 were considered.
6 Result – examples
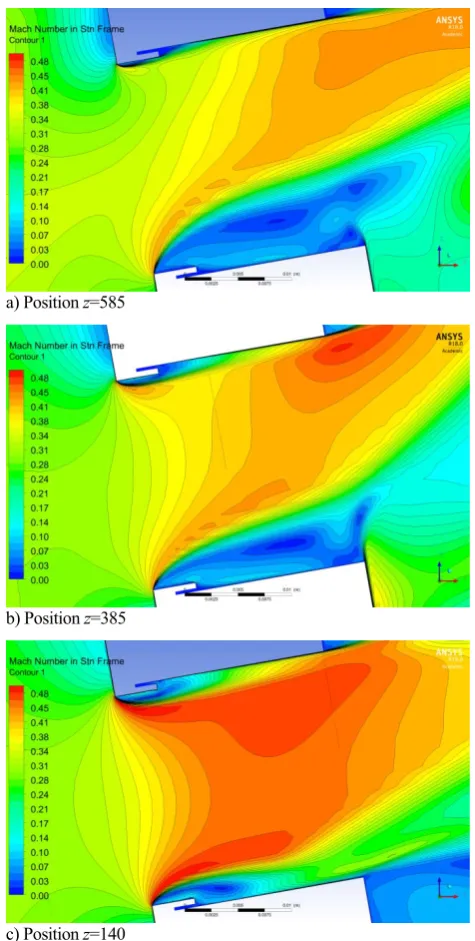
The examples of the results are presented first for longitudinal effects and later for the angular effects of the probe position on the measured values. Starting with the longitudinal effects, in Fig. 7a, the Mach number contours of the steam flow are shown in the longitudinal section of the probe measuring the volume for 3 selected traverse positions z of the probe along the blade height (z = 140, 385 and 585 mm). It is obvious that the flow rate within the measuring slot is heavily dependent on the radial component of the steam velocity from the rotor of the second last stage.
a) Position z=585
b) Position z=385
c) Position z=140
Fig. 7 Longitudinal contours of the Mach number in the probe’s measurement volume at three positions z along the blade
In order to apply CFD analyses to correct the optical data measured by the probe in the affected flow field, the most significant data needed is the change of density [7]. Therefore, only normalised densities of the flow passing 2 560 2 570 2 580 2 590 2 600 2 610
0 . 0 0 . 2 0 . 4 0 . 6 0 . 8 1 . 0
0 0.2 0.4 0.6 0.8 1
102 104 106 108 110 112
Total enthalpy (kJ/kg)
Spa
n no
rm
al
iz
ed (
1)
the measurement volume are used in the results comparison. Normalization is related to the maximum steam density WP MAX in the same volume as determined
by the reference calculations in the model domain without the probe (denoted as WP).
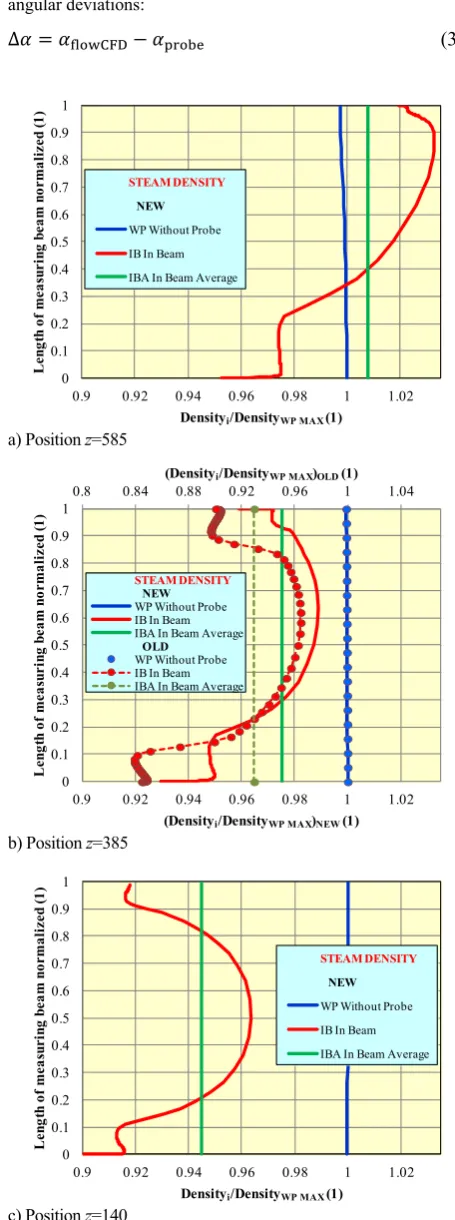
Fig. 8 compares the normalized density distributions along the light beam IB (red lines) for 3 probe positions z
along the blade height. These distributions are complemented by normalized distribution of density WP
(blue lines) and normalized density averages in the light beam IBA (green lines).
For the blade stage mean diameter (position z = 385 mm), NEW results on Fig. 8b are compared with similar values evaluated from the results of OLD CFD analyses (dashed lines and circles of corresponding colours). The clear difference between the results of the original and the new calculations, which is only partially documented in Fig. 8b, confirms the reason for the work to improve the CFD model described in Chapter 4. (Note: For the original profile values, a secondary horizontal axis is used at the top of the chart with a different scale.)
It is evident from Fig. 8 that the character and intensity of the influence of the steam density by the probe changes significantly with the position along the blade. At the bottom and centre of the blade, the density of the flow in the probe is lower than that seen in the uninfluenced flow along the length of the measuring beam. Only in the region of the blade tip is the deformation of the flow field different due to the significant radial component of the velocity interacting with the outer limiting wall of the probe. At the top of the beam, the density of the steam is higher and on the opposite side it is lower than in the flow without the probe. The blue and green curves in Fig. 8 illustrate the more general nature of the influence of the probe on the steam density along the blade radius. By comparing them it follows that the largest change is the relative drop in density at the bottom of the blade. At the tip of the blade, however, there is a less pronounced increase in the average density.
A more detailed evaluation and discussion of the results obtained from the CFD calculations goes beyond the scope of this paper. It can be said that the present knowledge makes it possible to quantify a simple Probe Influence Factor (PIF) to correct the density influence by the probe at the specific analysed positions.
The PIF was defined as the ratio of the average density in the place of measurement with the probe influence and without the probe [7].
ൌ ߩ୍Ȁߩ (2)
A generalization of the PIF correction for any position z of the probe or for probe use in other turbines is not yet possible. This practically requires modelling the impact of the probe on the flow field in all measurement cases. The complexity of the problem regarded from other possible off-design positions of the probe is shown in the second example of the results as presented in Figures 9 and 10. This example represents the variation of the steam parameter in the measuring space when the probe angle of attack probe does not match the flow direction
flowCFD. Results are presented for z=385 mm and several angular deviations:
οߙ ൌ ߙ୪୭୵େୈെ ߙ୮୰୭ୠୣ (3)
a) Position z=585
b) Position z=385
c) Position z=140
Fig. 8 Density distribution at three positions z along the blade hight 0 0.1 0.2 0.3 0.4 0.5 0.6 0.7 0.8 0.9 1
0.9 0.92 0.94 0.96 0.98 1 1.02
L en gt h of m ea sur ing be am no rm al iz ed (1 )
Densityi/DensityWP MAX(1) STEAM DENSITY
NEW WP Without Probe IB In Beam IBA In Beam Average
0.8 0.84 0.88 0.92 0.96 1 1.04
0
0 . 1 0 . 2 0 . 3 0 . 4 0 . 5 0 . 6 0 . 7 0 . 8 0 . 9
1 0 0.1 0.2 0.3 0.4 0.5 0.6 0.7 0.8 0.9 1
0.9 0.92 0.94 0.96 0.98 1 1.02
(Densityi/DensityWP MAX)OLD(1)
L en gt h of m ea sur ing be am no rm al iz ed (1 )
(Densityi/DensityWP MAX)NEW(1) STEAM DENSITY
NEW WP Without Probe IB In Beam IBA In Beam Average
OLD WP Without Probe IB In Beam IBA In Beam Average
0 0.1 0.2 0.3 0.4 0.5 0.6 0.7 0.8 0.9 1
0.9 0.92 0.94 0.96 0.98 1 1.02
L en gt h of m ea su ri ng b ea m n orm al ized (1 )
Densityi/DensityWP MAX(1)
Fig. 9 The influence of on the Mach number contours Fig. 9 shows the Mach number contours on the cross-section for 4 different deviation values of the probe angle of attack settings .=0°, 12°, 30° and 48°. It is obvious that the probe rotation also affects the flow rate within the measuring space. However, the intensity of this effect does not increase by increasing linearly. A strong disturbance of the flow within the measuring area is evident in the cases of = 30° and 48°.
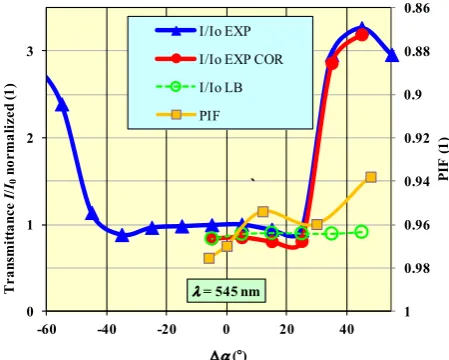
Fig. 10 Dependence of I/I0() and PIF()
Fig. 10 shows the PIF dependence on angle deviation () evaluated from CFD flow analyses in the probe measurement volume when it is rotated from the direction of the flow field. The flow direction in the non-disturbed flow field corresponds to the angle flowCFD = 85°. As a demonstration of the PIF application, Fig. 10 also compares the normalized profile of three dependencies I/I0 on the angular deviation of the probe setting in the flow field at z = 385 mm. The full blue line shows the dependence I/I0 EXP obtained experimentally in the steam turbine at ETE (particularly for the wavelength λ = 545 nm). The red line represents the profile of the dependence corrected using PIF (for respective ) according to the CFD analysis results -
I/I0 EXP COR. The green line then shows the dependence of
I/I0 LB calculated according to the Lambert-Beer law with the application of the hypothesis of Chapter 3 limiting the impact of the probe in the flow field only to the change in the density. This means that identical steam wetness values and droplet dimensions were considered for all rotation positions as was obtained in the probe position = 0 by
the evaluation from the I/I0 EXP COR values. Therefore the green and red lines start from the same point.
Fig. 10 illustrates several significant findings for the analysed position z and the deviation :
the extent of deviation of the flow field in the probe's measurement section depends on its rotation (see the orange curve)
this influence clearly changes the measured light attenuation (differences between the blue and red curves)
the impact of the probe cannot be simplified only to a function of the wet steam density (differences in the red and green curves, especially for > 30°).
These points can most likely by applied generally to other probes and their systems. The last point shows that the current simple correction factor PIF (see equation 3) should be supplemented by the influence of the probe on the measured parameters of the liquid phase D and y. Our current CFD simulations do not allow for a direct assessment of this impact, but the next stage will focus on this issue.
8 Conclusions
In the research of high pressure wet steam in energy systems, CTU is focusing on the analysis of the self-influence of optical probes on the flow field in steam turbines using CFD.
The first objective is to develop a methodology for modelling the influence of probes in turbines and to verify it in experimentally available places with increased pressure in LP parts. Subsequently, the methodology will be used for the modelling of probe conditions in high pressure parts of turbines.
The presented work follows on the initial analysis from the year 2016. Special attention was paid to improving the CFD model. This process involved 3 major changes. The computational model was extended to include the entire second last and last turbine stages, which allowed for more precise specification of the boundary conditions. Furthermore, the quality of the computing mesh has been improved. This has resulted in better convergence for all the calculations made. At the same time the new calculations were considered for real steam according to IAWPS IF 97. Real steam calculations have more advantages than the computations with the ideal gas. An interesting example is the direct visualization of changes in the equilibrium steam wetness in the probe measuring volume.
This improved CFD model was used to calculate the flow field characteristics in the area before the last stage of the steam turbine ETE without the probe and with the probe. The results of the calculations were analysed and compared in part with the experimental data.
This allowed us to fulfil the secondary objective of our research, i.e. to obtain data for the correction of data measured by CTU optical probes considering the influence of the probe on the flow field, and to help in optimising the shape of the probes.
The obtained results of the calculations and their analyses are only presented quite briefly in this paper. In general, both of these objectives have been met. Yet, there remains a wide scope for further work on this issue. The basic challenges include: generalizing the correction methodology, adding
0.86
0.88
0.9
0.92
0.94
0.96
0.98
1 0
1 2 3
-60 -40 -20 0 20 40
= 545 nm
PI
F
(1
)
Tr
an
sm
itta
nc
e
I
/
I0
no
rm
al
iz
ed
(1
)
(°)
I/Io EXP I/Io EXP COR I/Io LB PIF
`
=0
=12°
characteristics of the liquid phase to the PIF correction factor, modelling the influence of purging the optical windows with a stream of air.
Acknowledgements
We gratefully acknowledge the support by Grant No. 16-20123S of the Grant Agency of the Czech Republic. The authors would also like to thank all DSP and ETE employs who have made it possible to take measurements in the low pressure part of the steam turbine and who have been involved in their implementation.
References
1. Guo, T., Burnett, M., Turnquist, N. and Moraga, F.:
High pressure subsonic nucleation in 1d nozzles - an experimental study, Proceedings of ASME Turbo Expo 2014: Turbine Technical Conference and Exposition, GT2014-27241, pp. V01BT27A051 2. Azzini, L., Pini, M.: Numerical investigation of high
pressure condensing flows in supersonic nozzles, J. Phys.: Conf. Ser.821 (2017) 012008
3. Gyarmathy, G.: Nucleation of Steam in
High-Pressure Nozzle Experiments, Proc. IMechE 2005, 219 Part A: J. Power and Energy , 6, 511-521
4. Bakhtar, F., Zidi K.: Nucleation Phenomena in
Flowing High-Pressure Steam: Experimental results, Proc. IMechE 1989, 203 Part A: J. Power and Energy , 3, 195–200
5. Bakhtar, F., Zidi K.: Nucleation Phenomena in
Flowing High-Pressure Steam Part 2: Theoretical Analysis, Proc. IMechE 1990, 204 Part A: J. Power and Energy , 4, 233–242
6. Valha J., Ryley D. J.: Optical Studies of Nucleation
in High-Pressure Steam. In ASME Conference on Condensation in High Speed Flows, Yale University, Connecticut, 1977, 27-42
7. Kolovratník, M., Jun, G., Bartoš, O.: Control of the