Exploring the effects of Clustering Algorithms on
Free Text Recommendation
Israel Mendonça1*, Akira Fukuda1, Antoine Trouve2, and Kazuaki Murakami2
1 Kyushu University, 744-Motooka, Nishi-Ku, Fukuoka, Fukuoka, Japan;
2 Team Aibod, 1-8-7-Daimyo, Chuo-Ku, Fukuoka, Fukuoka, Japan
* Correspondence: [email protected]
Abstract:In this paper, we provide a study on the effects of applying classical clustering algorithms, such as k-Means to free text recommender systems. A typical recommender system may face problems when the number of items from a database goes from a few items to hundreds of items. Currently, one of the most prominent techniques to scale the database is applying clustering, however clustering may have a negative impact on the accuracy of the system when applied without taking into consideration the underlying items. In this work, we build a conceptual text recommender system and use k-Means to partition its search space into different groups. We study how the variation of the number of clusters affects its performance in the light of two performance measurements: recommendation time and precision. We also analyze if this clustering is affected by the representation of text we use. All the techniques used in this study uses word-embeddings to represent the document. One of the main findings of this work is that using clustering we can improve the recommendation time in up to almost 30 times without affecting much off its initial accuracy. Another interesting finding is that the increment of the number of clusters is not directly translated into linear performance.
Keywords:Clustering, Recommender-Systems, Word-Embedding
1. Introduction
Recommendation Systems are systems specialized in retrieving items from a database that may be of interest of users (top-nrecommendation problem). A typical Recommendation System will collect information from an user inputs and match this information with a set of heuristics to fetch the items it believes will best suit the user needs. Efficient recommendation systems can retrieve meaningful items in a short amount of item, i.e., the accuracy and the retrieval time of the system are widely used as metrics to evaluate recommendation systems.
The structure of the data directly influences the capacity of a system to analyze the items parameters and produce recommendations. However, natural text documents does not have a clear constitutional rule, and can vary greatly in terms of size, contents and internal text structure. Because of that, when one wants to create a recommendation system, she requires to apply techniques that are able to generate a structure that represents these free text documents. The most classical representation approaches are: Bag of words (BOW), in which each document is represented as the set of its internal words, with variations removing or notstopwords, and term-frequency inverse-document-frequency (tf-idf), in which each word in the document has its importance calculated by the frequency it appears in the text against the frequency it appears in the corpora.
Classical document representations often fails to capture the whole complexity that exists in the natural language text field, like synonyms or polysemous words (words with several meanings). Word2Vec models were introuced in 2013 by Mikolov,et. eal.[1] with the main objective of generating some structure to represent words that could carry their semantic meaning. In their technique, words are represented as a high-dimensional vector, that are generated from the probabilities of their existence in a corpora. From their work, different authors employed word-embedding to calculate the distance between documents.
When we recommend documents by finding the closest documents in the search space, the amount of documents to compare directly influences the recommendation time. If we represent a document as a vector ofndimensions and we haveddocuments in our search space, the complexity of calculating the most similar items is defined as O(n×d). However, if we reduce this search space by a fractionkof its original value, the search time is also reduced by nk. However, dividing the search space intokfractions can hurt the accuracy of the system. For instance, the clustering algorithm could generate highly heterogeneous clusters, which could spread documents of the same classes among the clusters and reduce the probability of them being recommended when we provide recommendations from a single cluster.
In this paper, we apply a clustering technique to divide the search space of a recommendation system and calculate the influences on precision and recommendation time on this system. We also compare the effects of using clustering into different document representations. Both document representations uses word embeddings.
The rest of the paper is organized as follows. Section2presents a review of the literature regarding clustering and recommendation systems. Section3briefly explains some of the necessary background to better understand this work. Section4gives a more detailed explanation about the techniques we use in this paper. In Section5, we introduce the datasets, the experimental setup, and the set of experiments conducted. In Section6we discuss the results of our experiments, we show that our methodology was able to improve the recommendation time by almost 4 times for our tested dataset. Finally, we conclude by highlighting the main points of our work, and identifying some possible perspectives.
2. Related Works
Cluster documents for reducing search time has been studied by different authors. On Cuttinget. al.[2], and Hearst and Pedersen [3], clustering is used to build a table-of-contents of the documents collection and hence facilitate the browsing through the collection. Zamir and Etzioni [4] introduces a new clustering algorithm called the Suffix Tree Clustering (STC) which first identifies sets of documents that shares common phrases, and then clusters according to these phrases. Although we do not use the phrases for clustering, we do use the document’s combined bag of word to generate the clusters.
Many authors uses content-based clustering for retrieving information from the web [5]. On [6] the author ranks the search query and then generate results based on this rank, they then merge these results to generate a cluster. We also use the contents of the document to cluster the documents, but instead of clustering when we return the document, we pre-cluster them based on their distances.
Although all of those techniques have efficient ideas of how to separate documents, none of them takes into consideration that the documents are a word-embedding form. To the best of our knowledge, we are the first authors to try to use classical clustering techniques to separate documents for a recommender system that uses word embeddings document representations.
3. Background
3.1. Word2Vec
Word2Vec is a word-embedding technique that was introduced by Mikolov et al. [1] and is based on the skip-gram model with sampling. They propose a simple neural network, with emphasis on efficiency at the training phase rather than precision. The neural network architecture consists of an input layer, a projection layer, and an output layer to predict nearby words. They train the vectors with the aim of maximizing the log probability of neighboring words within a specific corpus. More formally, given a sequence of wordsw1, ...,wT, it tries to maximize the average log probability.
1
T
T
∑
t=1−c≤
∑
j≤c,j6=0wherecis the size of the training context and p(wj|wt)is the hierarchical softmax function of
the associated wordswjandwt. . Since the model is usually trained over large datasets, the words
representation are able to learn complex word relationships and also carry semantic meanings. The learning phase of word embeddings is unsupervised and it can be computed on different corpus based on the user interest or pre-computed in advance. In this paper we use a pre-trained version of Google’s word2vec [7] as our word embedder, but other embeddings techniques are also available (Collobert and Weston, 2008 [8]; Mnih and Hinton, 2009 [9] ; Turian et al., 2010 [10]).
3.2. K-Means
Clustering is the unsupervised classification of patterns into groups (clusters) [11]. The k-Means clustering is an iterative algorithm that initially assigns random groups to all the points, and then proceeds to its update step by computing the initial mean of the center each random assigned cluster. This update step will be run until the group’s center doesn’t variate much from each iteration. On termination the algorithm returns a list of each cluster it assigned to the data points.
More formally, given a set of dimensional training input vectors x1,x2, ...,xn, the k-Means
clustering algorithm partitions thentraining set intoksets of data points or clustersS=S1,S2, ...,Sn,
wherek≤n, such that the within cluster sum of squares is minimized. That is:
argmin(s) k
∑
i=1x
∑
∈Si||x−ci||2 (2)
whereciis the centroid or mean of data point in clusterSi. The algorithm tries to improve the
result by updating the centroids described in Equation2.
4. Document Clustering for Recommendation Systems
4.1. A simple content-based recommendation system
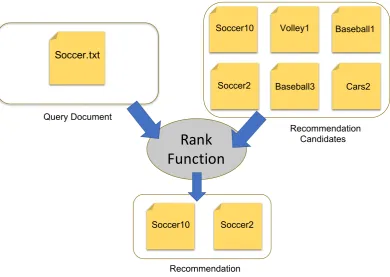
Figure 1displays a general idea of a recommender system. In a content-based document recommendation system, when an input arrives, with respect to an input document, also called aquery-document, a set of meta-data related to this query document is extracted and used by the system so it can, based on a set of internal beliefs, judge which items may be of the interest of the user. Then, the system needs to proceed to a search step in which it will look for its database for the items it intents to recommend. The recommendation can be divided into five distinct steps:
• Convert the document’s contents to embedded vectors. This step converts every word of a document to its embedded version to be used by the document representation models.
• Convert the embedded vectors to a document representation. This step converts the set of word embeddings into a single vector. The shape of this vector depends on the representation used. • Label from clustering algorithm. This step is responsible for getting the contents of the document
and generating a label based on it. This label represents the group in which the document belongs.
• Documents retrieval. In this step, we select documents from the database to be recommended. Those documents will be used in the next ste.
• Sorting. In this step we apply a sorting algorithm to rank the documents based on their similarity to the query document.
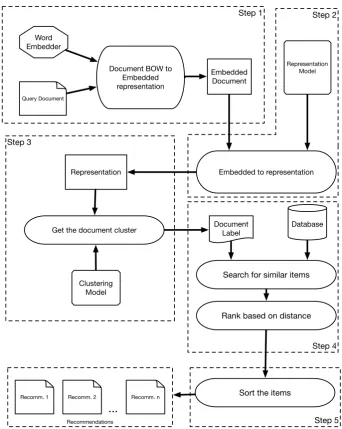
Figure2displays the updated work-flow for our recommender system. In this section we describe each step in detail.
Rank
Function
Soccer.txt
Soccer10
Soccer2
Volley1
Baseball3
Baseball1
Cars2
Soccer10 Soccer2
Query Document
Recommendation Candidates
Recommendation
Figure 1. A simple recommendation: The system combines the query document and the database documents into a rank function to produce recommendations.
Document to Word Embeddings
In this step, we use a tokenizer to extract all the words of the document. Then we can use a word embedder to capture the semantic vector of each word. This step is identical for every document representation. At the end of this step, for each document, we obtain a set of keyed vectorv that represent the document.
Generating Representations
In this step, we would like to convert the document’s keyed vectorsvinto a single vector that contains the main meaning of the document.
Formally, for a matrixMw,vcontaining every wordwof a document in its vectorial formv. LetX
be the document representation converter function that applied onMw,vconverts it into a vectorvx
that represents the document for this representation.
Since there is no straightforward mean of calculating the distance of two free-text documents, we had to generate a structure to represent documents, which provides us a tool to compare them. We use two document representation techniques, both uses word2vec to convert every document used in the system. The first technique is called Column Average Representation (CAR) and was introduced in [12] and uses the average of each column feature to represent documents. The second one is called Doc2vec and was introduced in [13] and uses concepts from word2vec to represent documents. Both techniques are explained in details on Subsections4.2and4.3respectively.
Labeling a document
Step 5 Step 2
Step 4 Step 3
Step 1
Query Document Word Embedder
Representation Model
Document BOW to Embedded representation
Embedded Document
Embedded to representation
Clustering Model Representation
Get the document cluster Document Label Database
Search for similar items
Recommendations Recomm. 1
Rank based on distance
Sort the items
Recomm. 2 Recomm. n
...
Figure 2.Recommendation Workflow: The first step converts the query document to an embedded version of it, the second step converts it to the representation, the third step searches for documents in the database and then, rank and sort them, finally the last step return the items sorted by rank.
More formally, for a documentdin its representation formvx, letybe the labeling algorithm that
applied onvxgenerates a labellto be used to the retrieval step to search documents.
Document Retrieval
In this step, we use the model generated by the previous step to selectively retrieve documents from the dataset. Every time we need to make a search in the database, we will select only members from a determined group of documents. This reduced amount of retrieved documents will reduce the load of the sorting algorithm since it will have less items to compare.
Sorting and Ranking Documents
𝑑"𝑤" 𝑑"𝑤$ 𝑑"𝑤%
𝑑&𝑤"𝑑&𝑤$ 𝑑&𝑤%
…
… .
. .
𝑑$𝑤" 𝑑$𝑤$ … 𝑑$𝑤%
. . . .
. .
𝑑"𝑐" 𝑑"𝑐$ … 𝑑"𝑐%
Document 1
Step 1
Extract Bag of Words Bag of Words to Word-Embeddings MatrixStep 2 Word-Embeddings Matrix to Means VectorStep 3
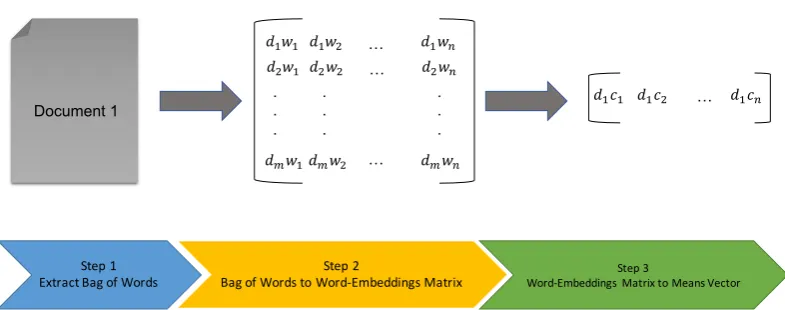
Figure 3.Document Representation: First we convert the document to a matrix of its bag-of-words, then we convert it to a single vector.
4.2. Column Average Document Representation
To be able to compare the distance of documents, we want to have a model that is able to move document representations from the textual domain to the numeric domain in order to be able to mathematically compare them.
The Column Average representation is a technique introduced in [12] that tries to grab the document meaning by extracting every word of the document, converting them to vectors, and averaging the vectors dimensions. By doing so, they represent documents as a vector and hence have a representation that allows us to directly compare documents.
The workflow of this method can be seen in Figure3. The first step is to convert the document’s text to the word embedding version. We use the word embedder to do such task. More formally, if we have a documentdcontaining a set of wordsW, we can convert every word ofWinto embedded vectors and organize them into a matrix matrixMi,j, in which each lineirepresents a different word
from the text and each columnjrepresents a feature of the word embedder. From this matrix we can calculate the mean of each column ofM, which results into a vectorvwithjdimensions, in which each valuejof the vector is the mean of the corresponding columnjofM.
With this technique we are capable of converting free text documents to vectors that can be used in our recommender system. The length of each of those vectors depends only on the number of features of the word embedder, in the sense that every document vector has the same length, and therefore they can be directly compared, feature by feature.
A major advantage of using this technique when compared to other techniques is the complexity of the recommendation. A recommender system recommendation time is directly influenced by the size of the document representation, so a more compact representation becomes attractive for such system since having fast recommendations is always desired. By using the Column Average Representation, the complexity of the recommendation algorithm will beO(n)×D, in whichDis the set of documents contained in the corpora.
4.3. Doc2vec
Doc2vec was presented in 2014 by Mikolov and Le [13] and tries to solve the problem of representing a document as a vector, regardless of the document length.
The concept they used was an extension of the word2vec model. They added another vector that contains the paragraph id, and maps it to a document.
4.4. Baseline Recommendation Characteristics
As stated in Subsection4.1, to be able to perform recommendations, the system needs to fetch documents into a database. Our baseline approach will fetch the whole database when making a recommendation.
To have an idea of the efficiency of this approach, we can calculate the complexity of the search on this set. Since we need to comparendocuments, represented as vectorsv, the complexity of the baseline algorithm isO(n×v). Also, we need to perform a sorting operation after the distances are calculated. We use Timsort, which has complexityO(n×log(n))for the average and worst case. So, the total complexity of a recommendation for our baseline case isO(n×v) +O(n×log(n)).
4.5. Our approach characteristics
In our approach, we try to reduce the search time by clustering the results and searching on a fraction of the recommendation space.
In this work, we want to apply those clustering algorithms to our content-based recommender system in order to reduce the recommendation time when performing recommendations. The main motivation behind this idea is that as we separate the documents into groups, the amount of calculations required to make a recommendation are reduced. A reduction in the amount of calculations can be directly translated into a reduction in recommendation time. In order to test our hypothesis, we separate the whole database into clusters.
More formally, assume that for a query documentqi, contained in the test setQ=q1, ...,qnthe
system returns a set containing a fixed numberkof documents determinedR= r1, ...,rk. For each
document ofR, we will apply an arbitrary functiongthat compares the class of the documentrkand
the query documentqiand returns 1 in case they have the same class and 0 otherwise. Now assume
that we have a search space that contains all theddocuments from the train set represented as one of the vectorial techniques introduced in the previous subsections.
If the documents are expressed in their vectorial form, we can represent them as a matrixZi,j ∈
Rd×f. Each line ofZcontains a documentd. Thej-th column,x∈Rf, represents the feature f of the
document in a multi-dimensional space. Every time the system receives a query documentq, it will search for recommendation on its whole database. It will have to compare all the f columns of eachd
document and theq. The search algorithm performance will beO(d×f). If we partition this space
Sand intoβsub-spacesSS = s1, ...,sβ,β ∈ S, and perform searches on an arbitrary groupsβ. It is
expected that the number of comparisons are reducedβtimes. Figure4illustrates how clustering can be used to prune the search space and improve recommendation time.
By dividing the search space, when we perform a search using aquery document, we can use a model to, based on the query document contents, would select which group fits it better. If the groups are uniformly distributed, the expected speedup for the application is directly proportional to the number of clusters. Partitioning the search space means that we are able of reducing the complexity of searching for recommendation items fromO(d×c). toO(d×c
β ).
d1 d2 d3 d4 d5 d6 d7 d9 d10 d12 d13 d14 d15 d16 d17 d18 d20 d21 d23 d8 d11 d19 d22 β1 β2 β3 β4 β5 Search Time: O(d×c
β )
(d1,c1), (d1,c2), ... , (d1,ck) (d2,c1), (d2,c2), ... , (d2,ck)
... (dβ,c1), (dβ,c2), ... , (dβ,ck)
[Mβ×c] ⊂ [Md×c]
ClusterβDocuments
(b) d1 d2 d3 d4 d5 d6 d7 d9 d10 d12 d13 d14 d15 d16 d17 d18 d20 d21 d23 d8 d11 d19 d22 Search Time: O(d×c)
(d1,c1), (d1,c2), ... , (d1,ck) (d2,c1), (d2,c2), ... , (d2,ck)
... (dn,c1), (dn,c2), ... , (dn,ck)
[Md×c]
Corpora Documents
(a)
Figure 4.(a) Non-clustered corpora with search time ofO(d×c). (b) Clustered corpora reducing the search time by a fractionβ.
5. Dataset and Experimental Setup
This section will give details of the dataset we used as well as the experimental setup we used for our experiments.
5.1. Dataset
In the remainder of this article we use the Reuters-22172 [15] dataset to evaluate the performance of the recommendation system. Reuters is a classic news dataset labeled by news topics (we use the 8-class version). It contains 8 classes, 5485 training documents and 2189 test documents. We will evaluate the quality of the recommendations based on whether or not the recommended documents are in the same class as the query document.
5.2. Experimental Setup
to assign a cluster to this document. It then retrieves all the documents from the assigned cluster from the database. It will then calculate the distance between each document and the query document, sort the results, and return thekfirst documents.
To extract the bag-of-words of a document, we used the NLTK’s sentence tokenizer and extracted all the words from sentences. For all the steps that required clustering, we used the sci-kit learn’s version of K-Means. For the steps that required database for storing documents and labels, we used MongoDB.
Regarding word-embeddings, we download the pre-trained one from Google’s webpage. To load the model and furthermore be able to convert words to its respective embeddings, we used Gensim, an open-source tool that can be used to load word pre-trained embedding and converts words to an embedding vector.
All the code necessary to run those experiments, and all the experimental results introduced on the next sections is public and available at github1.
Our experiments were run in a Ubuntu 17.10 virtual machine hosted in a dedicated 10-core 3.2GHZ Intel i7-6900K with 16Gb of memory.
6. Experimental Results
In this section, we will present the experimental results for the system and dataset introduced in Section5. In this recommender system, we will use both document representations introduced in Section4, and we will analyze how the system will perform using each of them with and without clustering.
6.1. Testing and Analysis Criteria
The system in this work will be evaluated based on two metrics: recommendation time and precision. The recommendation time is the total time the system takes to perform all the recommendations. Precision is the ratio between the number of recommended documents that are relevant and irrelevant.
For the data described in Subsection5.1, we recommend 10 documents for each document of the test set. This means that for our test set of 2189 documents, we will make 2189 recommendations, each of them returning up to 10 documents. We then compare the classes of the test document and recommended items to calculate the precision. The recommendation time will be calculated by summing the time of each individual recommendation.
6.2. Time Efficiency
We start our analysis by evaluating how much clustering influences recommendation time. Figure5displays the sum of each individual recommendation time for against the number of clusters. For our first case, the baseline in which all the documents are grouped into a single cluster, the total recommendation time is 795 seconds, which averages a time of 0.36 second per recommendation.
After the baseline, we increase the number of clusters from 8 to 104 (with steps of 8) and display their time. We notice that by using clustering only, regardless of the number of selected clusters, we have a positive impact over the recommendation time, as expected. We can also see that although the total recommendation time keeps decreasing from 8 clusters until we have 24 clusters, the recommendation time of the system starts to increase until we reach 48 clusters, after that it reduces to 258 seconds and stabilizes on numbers near 270 seconds for the rest of the experiment.
The system in general had an overall improvement, reaching highly improvements specially when we had over 100 clusters. Doc2Vec was the one that benefit the most from using clustering to
0 100 200 300 400
0 25 50 75 100
Number of Clusters
T
otal Recommendation Time
Converter Name
CAR Doc2Vec
Time Comparison
Figure 5.Reduction of the size of the document representation by means of using our model. The model is able to reduce the size of the corpora representation from a 3D matrix to a 2D one.
separate the database, having a speedup of near 30 times. Column Average Representation also had a significant improvement, being the most significant of them the one when we went from using no clustering (1 cluster) to using clusters. Table1gives us more details about the maximum variance on time for each representation.
Despite the system overall positive results using clustering, our maximum speedup was far from the theoretical speedup that could have been achieved. One of the reasons that may be causing this disparity between the real speedup and the theoretical one may be in the division of documents. If the clusters are separated evenly, this speedup should be linear, since the system would requiren1less calculations to achieve a result. In order to better understand the effects of the partition configuration over the time, we take a closer look into the configuration of the partitions.
Table 1.Maximum difference in time and precision for each document representation.
Converter Name Time Variance Speedup (x times) Precision Variance (x times)
1 baseline 5.90 1.01
2 d2v 29.03 1.03
6.3. Assessing the Cluster Partitions
0 250 500 750 1000
0 2 4 6
Cluster Id
Number of Documents
(a) 8 Clusters
0 250 500 750 1000
0 5 10 15 20
Cluster Id
Number of Documents
(b) 24 Clusters
0 250 500 750 1000
0 10 20 30 40
Cluster Id
Number of Documents
(c) 40 Clusters
0 250 500 750 1000
0 25 50 75 100
Cluster Id
Number of Documents
(d) 104 Clusters
Figure 6.Cluster individuals distribution for every cluster using k-Means with 8(a), 24(b), 40(c) and 104(d) clusters configuration. The higher the number of clusters, the more distributed the elements should be among the clusters.
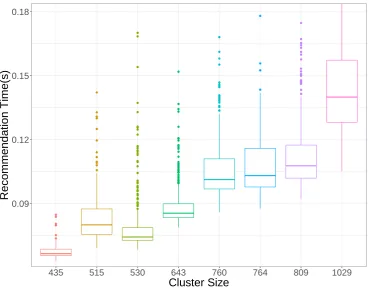
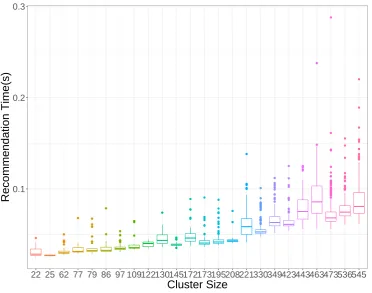
To reason over the difference in time of a small and a big cluster, we analyze the recommendation time of each cluster size for two out of four cases aforementioned. Figures7and8displays the recommendation time separated by cluster size for each k-Means version. The recommendation time grows as the number of elements inside a cluster grows. For 8 clusters, we can see that the bigger cluster has 2 times the size of the smallest one, but it can reach up to 4 times the recommendation time. For 24 clusters, this difference cannot be so easily perceived because the clusters have a more similar size, and consequently a more similar recommendation time.
6.4. Effects on Precision
We compute the precision by calculating the amount of correct guesses inside the set of recommended items. If we recommend 10 items, and 8 are from the same label as the query document, we say that the recommendation had 80% of precision.
Since we artificially separated the data, we expected the precision to be negatively impacted. However, the impact on the precision were minimal. The results for the baseline alongside with all the cluster sizes is displayed on Figure9.
0.09 0.12 0.15 0.18
435 515 530 643 760 764 809 1029
Cluster Size
Recommendation Time(s)
Figure 7.Recommendation time for every cluster size generated using k-Means with 8 clusters. We can see a pattern that the recommendation time increases as function of the cluster size.
without clustering, we had 90% precision for the CAR representation and around 55% for the Doc2vec representation. From these results we can draw the conclusions that both the document representations chosen for this experiment were sufficient accurate to capture the distinction that separates documents for this dataset; With CAR being more precise than Doc2vec. A more elaborated discussion over those two and other document representations can be found at [12].
7. Conclusion and Future Works
In this paper, we have studied the effects of adding clustering when doing recommendations of text files. Our main goal was to reduce the search time, without greatly affecting the precision. We investigated how different number of clusters for k-Means can affect the performance in relation of time and accuracy. We empirically tested our hypothesis using a real-world dataset and assessed that the time can be improved up to almost 30 times when using a correct configuration of clustering. We also verified that disregarding the number of clusters or document representation, using k-Means to partition the documents usually yields improvements in terms of time, without affecting much of the precision.
Author Contributions: Conceptualization, M.I. and T.A.; Methodology, M.I. and T.A.; Software: M.I.; Investigation, M.I. and T.A; Writing—Original Draft Preparation, M.I.; Writing—Review & Editing, M.I. and T.A.; Supervision, F.A.; Funding Acquisition, F.A. and M.K.
Funding:This research was funded by National Council of Scientific and Technological Development (CNPQ).
Acknowledgments: The authors are grateful to the National Council of Scientific and Technological Development (CNPQ) for its financial support through the Science Without Borders program, see (http://www.cienciasemfronteiras.gov.br).
0.1 0.2 0.3
22 25 62 77 79 86 97 109122130145172173195208221330349423443463473536545
Cluster Size
Recommendation Time(s)
Figure 8.Recommendation time for every cluster size generated using k-Means with 24 clusters. We can see a pattern that the recommendation time increases as function of the cluster size.
References
1. Mikolov, T.; Chen, K.; Corrado, G.; Dean, J. Efficient estimation of word representations in vector space.
arXiv preprint arXiv:1301.37812013.
2. Cutting, D.R.; Karger, D.R.; Pedersen, J.O. Constant Interaction-time Scatter/Gather Browsing of Very Large Document Collections. Proceedings of the 16th Annual International ACM SIGIR Conference on Research and Development in Information Retrieval; ACM: New York, NY, USA, 1993; SIGIR ’93, pp. 126–134. doi:10.1145/160688.160706.
3. Hearst, M.A.; Pedersen, J.O. Reexamining the cluster hypothesis: scatter/gather on retrieval results. Proceedings of the 19th annual international ACM SIGIR conference on Research and development in information retrieval. ACM, 1996, pp. 76–84.
4. Zamir, O.; Etzioni, O. Web document clustering: A feasibility demonstration. Proceedings of the 21st annual international ACM SIGIR conference on Research and development in information retrieval. ACM, 1998, pp. 46–54.
5. Kobayashi, M.; Takeda, K. Information retrieval on the web. ACM Computing Surveys (CSUR)2000,
32, 144–173.
6. Zeng, H.; He, Q.; Chen, Z.; Ma, W.; Ma, J. Learning to cluster web search results. SIGIR 2004: Proceedings of the 27th Annual International ACM SIGIR Conference on Research and Development in Information Retrieval, Sheffield, UK, July 25-29, 2004, 2004, pp. 210–217. doi:10.1145/1008992.1009030.
7. inc., G. word2vec, 2013. https://code.google.com/archive/p/word2vec/.
8. Collobert, R.; Weston, J.; Bottou, L.; Karlen, M.; Kavukcuoglu, K.; Kuksa, P. Natural language processing (almost) from scratch.Journal of Machine Learning Research2011,12, 2493–2537.
60 70 80 90
0 25 50 75 100
Number of Clusters
Precision
Converter Name
CAR Doc2Vec
Precision Comparison
Figure 9.Precision Comparison for both document representations.
10. Turian, J.; Ratinov, L.; Bengio, Y. Word representations: a simple and general method for semi-supervised learning. Proceedings of the 48th annual meeting of the association for computational linguistics. Association for Computational Linguistics, 2010, pp. 384–394.
11. Jain, A.K.; Murty, M.N.; Flynn, P.J. Data clustering: a review. ACM computing surveys (CSUR)1999,
31, 264–323.
12. Mendonca, I.; Trouve, A.; Fukuda, A.; Murakami, K. Exploring a Topical Representation of Documents for Recommendation Systems. The 9th IEEE International Conference on Awareness Science and Technology (iCAST 2018), 2018, pp. 95–100.
13. Le, Q.; Mikolov, T. Distributed representations of sentences and documents. International Conference on Machine Learning, 2014, pp. 1188–1196.
14. Altman, N.S. An introduction to kernel and nearest-neighbor nonparametric regression. The American Statistician1992,46, 175–185.