Social Sentiment Sensor in Twitter for Predicting
Cyber-Attacks Using
`
1
Regularization
Aldo Hernandez-Suarez1ID, Gabriel Sanchez-Perez1, Karina Toscano-Medina1, Victor Martinez-Hernandez1, Hector Perez-Meana1,*, Jesus Olivares-Mercado1 and Victor Sanchez2
1 Instituto Politecnico Nacional, ESIME Culhuacan, Mexico City 04440, Mexico;
[email protected] (A.H.-S.); (G.S.-P.); (K.T.-M.); (V.M.-H.); (J.O.-M.) 2 Department of Computer Science, University of Warwick, Coventry CV4 7AL, UK;
* Correspondence: [email protected]; Tel.: +52-55-5624-2000
Abstract:In recent years, online social media information has been subject of study in several data science fields due to its impact on users as a communication and expression channel. Data gathered from online platforms such as Twitter has the potential to facilitate research over social phenomena based on sentiment analysis, which usually employs Natural Language Processing and Machine Learning techniques to interpret sentimental tendencies related to users opinions and make predictions about real events. Cyber attacks are not isolated from opinion subjectivity on online social networks. Various security attacks are performed by hacker activists motivated by reactions from polemic social events. In this paper, a methodology for tracking social data that can trigger cyber attacks is developed. Our main contribution lies in the monthly prediction of tweets with content related to security attacks and the incidents detected based on`1regularization.
Keywords:security; social sentiment sensor; hackers; social media; statistics; L1 regression; twitter; cyber attacks
1. Introduction
Online Social Networks (OSN) are platforms designed as communication channels for information exchange in real-time. Web services like Twitter [1] are expected to generate approximately 1 billon of user-generated content per month around the world. Twitter statistics [2] report the generation of 313 million posts monthly, better known as tweets, over different countries, which is advantageous for data gathering mechanisms because large volumes of data can be collected over different time intervals. Different topics in Twitter reflect polarized opinions from celebrities, corporations and regular users about daily life aspects [3], some of them with well defined geographic embedded data (assisted gps coordinates). Streams of tweets generate valuable information which can be modeled as asocial sentiment sensorfor real-world event detection [4] by analyzing topic clustering like rumour spreading analysis [5], human mobility sensing [6], spam & botnet detection [7] and disaster response [8].
Correlation between high impact social events and sentimental polarity extracted from user groups from Twitter can be interpreted by probabilistic and classification models [9], whose results are predictive by nature and can be used as a social behavior warning tool. In [10], an early warning process related to abnormal behavior is developed relating intrusion techniques and terrorist attacks. Regional language and lexical variations derived from users are key factors in searching patterns related to sentimental tendencies. For example, natural language processing has shown that negative-oriented textual features [11] related to information security lexicons used byhacktivists groups can send warning alarms to sysadmins to mitigate web attacks. Political, religious and cultural events can serve as predictive targets for data extraction in social media platforms, noting that malicious users may redirect such contexts to negative-oriented ones [12].
This paper focuses on sentiment analysis extracted from tweets, which are processed with probabilistic techniques [13] in order to measure the correlation among user groups within a common context; specifically, those who use Twitter in a regular basis and those who generate content with malicious intentions related tohacktivism, which according to [14] is the marriage of hacking and social activism.
Tweets are analyzed to create security warnings based on sentimental response on users. The latter is done comparing three supervised learning algorithms [15–18] daily corpus of tweets. A statistical model is created with the assumption that given the volumes of tweets with sentimental polarity there is a response from security attacks.
2. Related Work
According to [19], cyber attacks are increasing as a result of global insurgency given geopolitical contexts. These attacks pose major concerns due to their potential effects in denial of service, data leaking and application compromising. Alternative security measures, like forecasting threatening security events, are thus gaining credibility.
Data from OSNs is useful for extending capabilities from intrusion detection systems (IDSs) and intrusion prevention systems (IPSs) from outer-level networks. In [20], an LDA-based (Latent Dirichlet Allocation) model is proposed to discover semantically related concepts to analyze cyber-crime forensics. More recently, a bipartite and monopartite network analysis is achieved by crawling hackers forums to identify members by specific malicious tool usage [21]. A list of anti-threats strategies is proposed in [22] to prevent and visualize common practices regarding privacy, spamming and malicious attacks. In [23], the authors present a relationship of social unrest between countries and directed cyber attacks. These works proves that Arbor Networks data is useful to determine if attacks such as DDoS (Distributed Denial-of-Service attacks) are expected to grow if radical or extremist sentiments from users are perceived in streams of OSNs posts.
Predictive analysis has an important concept in Twitter, due to the fact that certain elements such as retweets, favorites and replies can be characterized, which, together with the polarity of the text, can provide data that increases the forecasting of events [24] such as political elections and product outcomes. According to [25] the predictive power in social networks has two important aspects, those based on the human factor (inspection of publications) and statistical models, which through a list of predictors on measures of opportunity as number of followers, and favorite publications , can be modeled to predict an increase in users influence. In [26] a`1regularized regression model was presented in order to predict Influenza-like Illness by training data from Twitter and comparing outcomes with official health reports.
3. Proposed Algorithm
Figure 1.Proposed algorithm steps.
4. Data Gathering and Pre-Processing
4.1. Data Acquisition
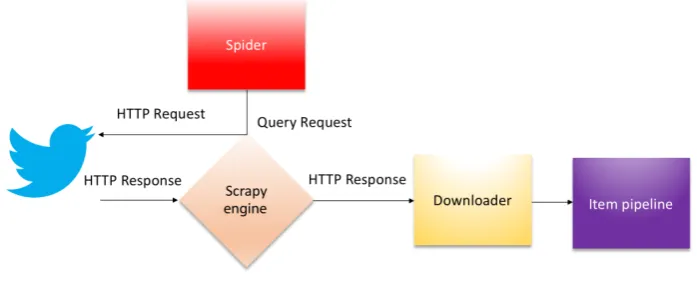
Data gathering schemes are designed for querying Twitter endpoints to obtain chronological tweets. Notorious works in sentiment analysis [27–29] use a public information streaming platform known as Twitter Standard Search API, which is an interface that has capabilities for information retrieval in chronological order for no longer than seven days [30]. In this paper is used an approach for historical retrieval by querying Twitter search endpoints proposed in [31]. The web crawling tasks are done with web spiders engines designed for document scraping in an automated and efficient manner. Information is processed by Scrapy, a Python Web Scraping Framework that extracts embedded text in HTML tags and simultaneously uses recursive functions to analyze each link to follow other tweets. This data gathering scheme is depicted in Figure2.
Figure 2.Data gathering scheme.
Collecting data is achieved by querying the endpoints in time intervals sorted by days. Each query qis based onn-grams(set of co-occurring words within a given text) bags of words related to specific events defined asq= [{1-gram,2-gram,3-gram, . . . ,n-gram},{date}].
and retrieve each tweet in plain text. As depicted in Figure3, retrieved text is processed independently in Scrapy pipes that handle data streams into objects to be stored in a relational database.
Figure 3.Embedded Text in HTML.
The set of retrieved queriesqis thecorpus of tweets,C, and is directly proportional to the daily number of tweets stored for query. According to each tweet can be represented as a structure containing fundamental attributes depicted in Table1.
Table 1.Tweet object.
Attribute Description
id the integer representation of the unique identifier for this Tweet created_at UTC time when a tweet was created
text The actual UTF-8 text of the status update
Each tweet is stored with its ownidas a primary key, that is used to sort them in a sequentially and non-repeatable way, and is denoted byC(q) =ci ∈ {tid,ttext,tdate}ni=1.
4.2. Tokenization and Noise Removal
A cleaning task is applied to a corpusC to generate individual arrays of words (i.e., tokens) for each tweet. A normalization step is required to transform each token into lower case words, a dimensional reduction [32] ofCis important to reduce textual noise. Noise is considered as frequent uni-gramsorstop-words(very commonly used words) that do not provide valuable information as candidate textual markers. In the case of the English language, sets ofstop-wordswidely used in Natural Language Processing are used in text cleaning tasks. This work uses a the publicly-available English stop-words set published in [33], and each word is weighted by textual and lexical functions in a sentence [34]. URL patterns are removed from the corpus and other expressions, such as retweets RTand appearances of@username, are considered non-informative attributes and are deleted in the same way.
4.3. Lexical Derivations
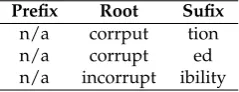
Textual markers have lexical derivations as part of ungrammatical text structures written by most of users. Grammatical restriction is performed to stem each token, thus avoiding repeated samples from the same grammatical root and bias in the training step for classification. An example of stemming is shown in Table2.
Table 2.Stemmed lexical variations.
We use Snowball Stemmer for lexicographical lemmatisation, which is a set of probabilistic algorithms based on Porter stemmer [35] of Indo-European languages and has been shown to attain high capabilities for searching pattern inflections into roots from composed words [36].
5. Pre-Classification and Class Labeling
Supervised classification provides predefined class labels given specific inputs, where each class must be independent from the others. Selecting relevant and high impact tweets are important for good training performance due to the fact that some words give most information about a particular context. We use The Stanford sentiment corpus [37] along with tweets crawled by our own scraping approach in a first instance, tweets are labeled as negative (neg) or positive (pos) based on users emotions. A second set of tweets related to cyber-security and cyber-attacks topics is scraped by querying terms contained in The Glossary of Common Cybersecurity Terminology [48], and other manually annotated hacker-activists terms [11]. Crawled tweets where labeled by asec(security−oriented)tag. The set of labels is then denoted bylabel ={pos,neg,sec}and the corpus for a training task is denoted by T = τi ∈ {tweetlabeltext}in=1, whereτiis theithtweet text and label on the training set. In Figure4are depicted some examples regarding class labeling.
Figure 4.Example of labeling for the three observed classes.
6. Supervised Classifier
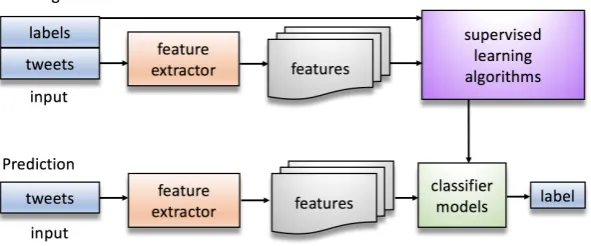
Building a supervised classifier is achieved by first transforming each input of textual markers into features, followed by a training step with labels. Features extracted fromTcontain basic information that allows forCto be successfully classified. The work flow is graphically depicted in Figure5.
Features and labels from T are processed by the supervised learning algorithms [15–18] to generate classifier models. A feature extractor computes features based on words by the the term frequency–inverse document frequency (Tf-idf) algorithm [38]. A label for each tweet of C is then predicted.
Feature Extraction and Selection
Features are based on sentimental relevance; i.e., words that better describe a user’s sentiment about a specific context are selected. As proposed in [39], identifying rawn-gramsis more useful for feature extraction than using speech tagging, because supervised classifiers tend to attain a higher accuracy with grammatical and positional independence in sentences.
In order to avoid over-fitting, we perform a model selection procedure to split data into random matrices for training and testing. By performing atrain-testselection procedure with Python sklearn library, we divideTinto a 80% training and 20% validation subsets. Training and validation tweets from regular users merged with security oriented users are denoted byXT, which contains pre-processed
text from tweets, whileydenotes their respective labels. Resulting subsets fromTare denoted by XT,yT, which are the training subset tuples, andXV,yV, the validation subsets tuples selected to
evaluate the classifier model.Word particles contained in tweets from the training set are extracted and transformed into toTf-idf term weights [40] using sklearnTf-idf vectorizer, then each resulting vector is normalized by an`2norm.
7. Classification Baseline
Choosing a good classifier is an important task to generate a robust model for testing corpus C. In other words, results must be accurate enough to eventually find relationships between the users sentiments and cyber attacks responses. In [37,41,42], different classifiers such as Naive Bayes, Maximum Entropy and Support Vector Machine are proposed and evaluated; results show that for noisy labels and the case of emotions in tweets, Support Vector Machine attains better results than other text classifiers.
7.1. Naive Bayes Classifier
Classifiers based on the Bayes theorem are widely used in text classification [15] for short messages like tweets, because of the simplicity in computing probabilistic evidence for class prediction given independent text features. This method contrasts with those that employ Bernoulli models [43], which are based in document counts for each class. Having a set label containingcclasses, we can define parameters to calculate the probability of a classcgiven a tweet by:
PNB(c|t) =
(P(c))
m
∑
i=1
p(fi|c)ni(t)
P(t) (1)
wheretis a tweet,ca class (label), fi ∈ f(XT)is the feature,ni(t)is a word presence giventandmis the number of features.
7.2. Support Vector Machine
Support Vector Machines [16] are suitable for bounding data in linear and non-linear ways. By its nature SVM is a binary classifier, meaning that data is separated into two labeled classes. For a multi-class approach for the training set(XT,yT)with labelsyT ∈ {0, 2}, an optimization approach is
proposed by solving:
φ(w,ξ) = 1 2kwk
2+C
∑
`i=1m
∑
6=yiξmi (2)
constrained to(wy·ti) +byi ≥(wm·ti) +bm+2−ξmi ,ξmi ≥0,i=1, . . . ,`,m∈ {1, . . . ,k}, thus this, we can find an optimized decision function by finding the saddle point of the Lagrangian:
f(x,α) =argmax
n [ `
∑
i=1
wherewis the hyper plane,αiis the non-negative Variable Lagrange Multiplier,yiis theith input class
(label) from the label set,tare input tweets,bdenotes the hyper-plane parameters (bias),ξis a slack variable (0<ξ≤iis the point between the margin and the correct side of the hyper-plane withξ>1 mean a misclassified point) andCis the regularization parameter.
7.3. Maximum Entropy Classifier
Maximum Entropy classifiers are widely used for learning from input features in a weighted manner, such that it results in a discriminative model that evaluates possible values from possible classes [17,18]. The model is represented by:
PME(c|t) = 1
Z(t)exp(
n
∑
i=1
λi,cFi,c(t,c)) (4)
In the previous formulacdenotes the class (label),tis a tweet,λis the weight vector (considering that a higher weight assumes a strong indicator about the class),Z(t)is the normalization function givent, andFi,cis the feature-class function for a feature fi∈ f(XT).
8. Prediction—Statistical Analysis
`1Regularized Regression
Regression is suitable for prediction and forecasting events given multiple inputs, better known as observations, that are linearly independent from each others [44]. A lineal model is interpreted as:
f(XC) =cyCsecurity_oriented =β0+β1XCpos+β2XCneg+ε (5) where:
1. XCis the observation matrix of all classified tweets from corpus 2. XCpos andXCnegare the observations total with daily scores 3. XCis the observation matrix of all classified tweets from corpusC 4. XCnegare the observations total with daily sentiment scores
(a) XCpos =
n
∑
i=1
Ci(positive)
(b) XCneg=
n
∑
i=1
Ci(negative)
5. cyCsecurity_orientedthe fitted security-oriented response from regression coefficients[β1,β2]extracted fromyCsecurity_oriented =
n
∑
i=1
Ci(security_oriented)
Because of the negative effect on computing regression by ordinary least squares over highly correlated observations and an increase of variance, a regularized regression using selection and reduction is proposed. Regression based on vector norm`1can adjust the linear model by making some coefficients zero, which is suitable for large multivariate observation matrices. LASSO (Least Absolute Shrinkage and Selection Operator) is an adaptation to linear models that minimizes the error in the limit of absolute values from prediction coefficients:
b
βlasso=arg min
β∈RP
kXCβ−yCk22+λkβk`1 (6)
9. Experimental Results
This section shows the evaluation of the proposed sensor for sentiment analysis, using a total of 1,800,000 tweets in English. One million were extracted using the method proposed in [31] from regular and cyber-security-related accounts and 800,000 belonging to the Stanford dataset [45]. In Table3 some well identified Twitter accounts related to hackers activists, cyber-security feeds, researchers and enthusiasts users are presented.
Table 3.Identified Twitter accounts related to hacking and cyber security.
Account Type Identified Accounts
hacktivism
anonymouspress, youranonglobal, wapoanon,
werallanonymous, observingsentin, theanonmovement, freeanons, global_hackers, anonymousvideo, anonrrd
cyber-security feeds and sensors nitdefender, malwarebytes, oinionid, moixec, uscert_gov, nakedsecurity, kaspersky, fsecure, nortononline, nsc
researchers and enthusiasts
peerlyst, cyber, mikko, briankrebs, nieljrubenking, dangoodin001, gcluley, campuscodi, peterkruse, e_kaspersky, troyhunt, swiftonsecurity, icheylus
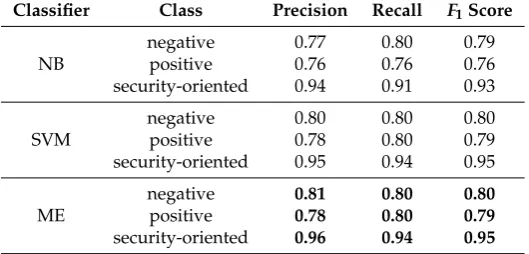
In Table 4. the results using Support Vector Machine, Naive Bayes and Maximum Entropy classifiers for training(XT,yT)as well as testing(XV,yV)are shown. These results were obtained
using parameters related to document frequency (df) which is a threshold for support applied to weight terms where the minimum and maximum support are in the interval [0.5, 0.95].
Table 4.Classification Results. The Maximum Entropy classifier show the best classification result.
Classifier Class Precision Recall F1Score
negative 0.77 0.80 0.79
NB positive 0.76 0.76 0.76
security-oriented 0.94 0.91 0.93
negative 0.80 0.80 0.80
SVM positive 0.78 0.80 0.79
security-oriented 0.95 0.94 0.95
negative 0.81 0.80 0.80
ME positive 0.78 0.80 0.79
security-oriented 0.96 0.94 0.95
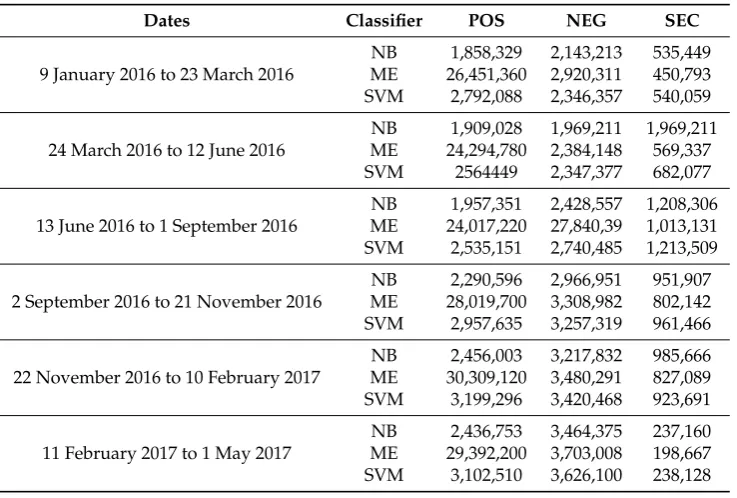
9.1. Testing the Proposed Model: A Case Study
(SEC) classes with its corresponding classifiers: Naive Bayes (NB), Maximum Entropy (ME) and Support Vector Machine (SVM).
Table 5.Classified tweets over time series.
Dates Classifier POS NEG SEC
NB 1,858,329 2,143,213 535,449 9 January 2016 to 23 March 2016 ME 26,451,360 2,920,311 450,793 SVM 2,792,088 2,346,357 540,059
NB 1,909,028 1,969,211 1,969,211 24 March 2016 to 12 June 2016 ME 24,294,780 2,384,148 569,337
SVM 2564449 2,347,377 682,077
NB 1,957,351 2,428,557 1,208,306 13 June 2016 to 1 September 2016 ME 24,017,220 27,840,39 1,013,131 SVM 2,535,151 2,740,485 1,213,509
NB 2,290,596 2,966,951 951,907 2 September 2016 to 21 November 2016 ME 28,019,700 3,308,982 802,142 SVM 2,957,635 3,257,319 961,466
NB 2,456,003 3,217,832 985,666 22 November 2016 to 10 February 2017 ME 30,309,120 3,480,291 827,089 SVM 3,199,296 3,420,468 923,691
NB 2,436,753 3,464,375 237,160 11 February 2017 to 1 May 2017 ME 29,392,200 3,703,008 198,667 SVM 3,102,510 3,626,100 238,128
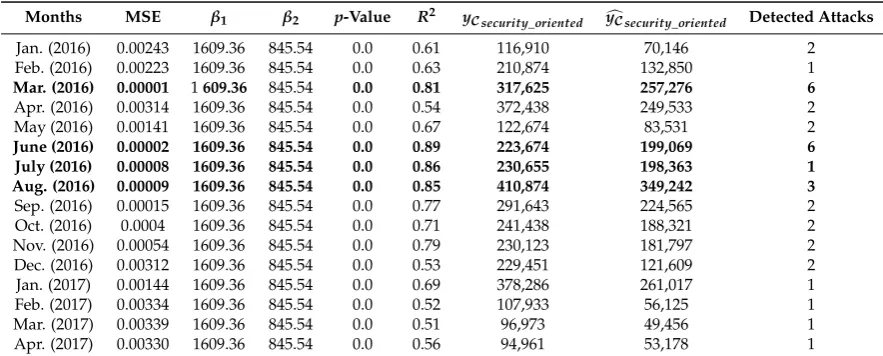
9.2. Regularized Regression Approach
Prediction over high volumes of scores can be difficult with ordinary regression due to unbiassed coefficients. By computing LASSO (east Absolute Shrinkage and Selection Operator) [46] we can shrink coefficients in order to optimize our prediction model. Moreover, regularized regression tasks can be only implemented in multivariate sets, as presented in Table. the Maximum Entropy (ME) classifier showed better accuracy results, so we propose an`1normalization for overall daily ME [47]. Given the transition over presidential elections, normalized scores fromXCare divide into monthly prediction tasks, a statistical report containing the following measures is depicted in Table6:
• M.S.E. (Mean Squared Error): shows the difference or loss of the predicted scores with the inputs between the actual scoresyCsecurity_orientedand the predictedcyCsecurity_oriented.
• p-value (probability value): determines how well the observations (XCneg,XCpos) are adjusted in the predictive model, thus rejecting the null hypothesis, that related to the low effectiveness of the samples, the lower the probability value (p-value≈0), the greater adjustment in the model. • R2(coefficient of determination): explains the proportion of adjustment from the observations
Table 6.Regularized Regression Measures Report.
Months MSE β1 β2 p-Value R2 yCsecurity_oriented ycCsecurity_oriented Detected Attacks
Jan. (2016) 0.00243 1609.36 845.54 0.0 0.61 116,910 70,146 2 Feb. (2016) 0.00223 1609.36 845.54 0.0 0.63 210,874 132,850 1
Mar. (2016) 0.00001 1609.36 845.54 0.0 0.81 317,625 257,276 6
Apr. (2016) 0.00314 1609.36 845.54 0.0 0.54 372,438 249,533 2 May (2016) 0.00141 1609.36 845.54 0.0 0.67 122,674 83,531 2
June (2016) 0.00002 1609.36 845.54 0.0 0.89 223,674 199,069 6
July (2016) 0.00008 1609.36 845.54 0.0 0.86 230,655 198,363 1
Aug. (2016) 0.00009 1609.36 845.54 0.0 0.85 410,874 349,242 3
Sep. (2016) 0.00015 1609.36 845.54 0.0 0.77 291,643 224,565 2 Oct. (2016) 0.0004 1609.36 845.54 0.0 0.71 241,438 188,321 2 Nov. (2016) 0.00054 1609.36 845.54 0.0 0.79 230,123 181,797 2 Dec. (2016) 0.00312 1609.36 845.54 0.0 0.53 229,451 121,609 2 Jan. (2017) 0.00144 1609.36 845.54 0.0 0.69 378,286 261,017 1 Feb. (2017) 0.00334 1609.36 845.54 0.0 0.52 107,933 56,125 1 Mar. (2017) 0.00339 1609.36 845.54 0.0 0.51 96,973 49,456 1 Apr. (2017) 0.00330 1609.36 845.54 0.0 0.56 94,961 53,178 1
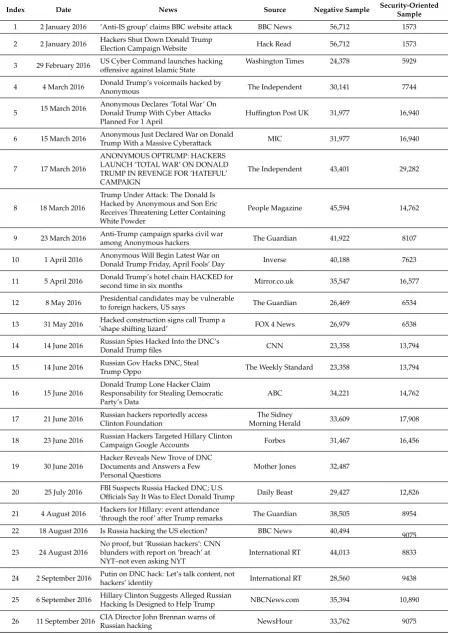
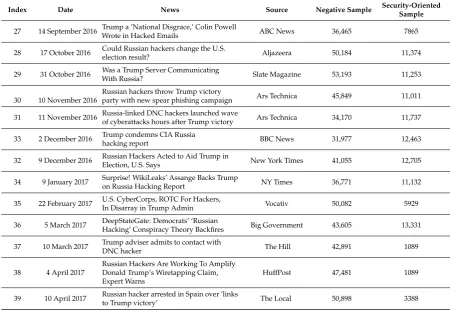
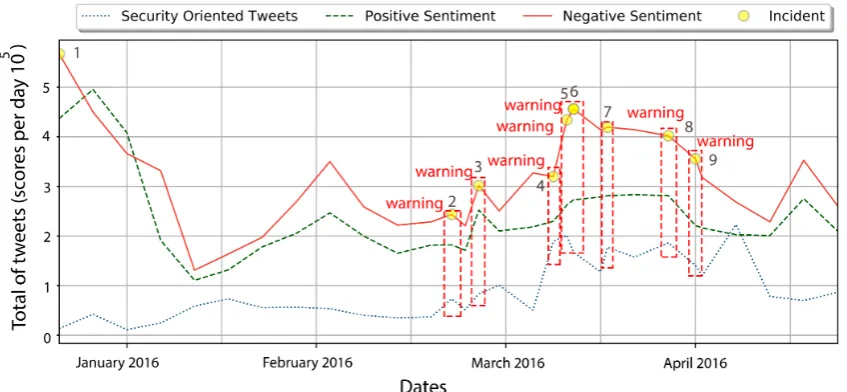
Bold rows represent the maximum correlation between users sentiment and a security oriented response given byR2. Historical data extracted from Google News can help to determine ifR2values related to users sentiment can trigger an alarm related to hacking incidents. During mid-March 2016, Trump’s comments and behaviors regarding abortion, the violence on his rallies and his declarations about Brussels terrorist attacks, increase users negative opinions towards him and, in retaliation, hackers started a raid under the banner ofOpTrumpand election sites, voice-mails and public information was threatened. June 2016 was also a hard month during the election; rumors about hackers hijacking elections by cyber-intrusions increase people’s reaction by posting DNC compromised servers revealing Hillary Clinton’s private emails. The observations obtained in these time series show that there is a relationship between the negative opinions regarding the tweets by activist hackers. A chronological time-line for users negative, positive and security oriented classified tweets by Maximum Entropy; as well as important incidents (with their respective index), as reported by Google News is presented in Figure6. News titles and original source from Google News describing Security-oriented incidents are depicted and mapped in Table7.
Table 7.News Reporting Security Oriented Incidents.
Index Date News Source Negative Sample Security-Oriented
Sample
1 2 January 2016 ’Anti-IS group’ claims BBC website attack BBC News 56,712 1573
2 2 January 2016 Hackers Shut Down Donald TrumpElection Campaign Website Hack Read 56,712 1573
3 29 February 2016 US Cyber Command launches hacking offensive against Islamic State
Washington Times 24,378 5929
4 4 March 2016 Donald Trump’s voicemails hacked by
Anonymous The Independent 30,141 7744
5 15 March 2016
Anonymous Declares ‘Total War’ On Donald Trump With Cyber Attacks Planned For 1 April
Huffington Post UK 31,977 16,940
6 15 March 2016 Anonymous Just Declared War on Donald
Trump With a Massive Cyberattack MIC 31,977 16,940
7 17 March 2016
ANONYMOUS OPTRUMP: HACKERS LAUNCH ’TOTAL WAR’ ON DONALD TRUMP IN REVENGE FOR ’HATEFUL’ CAMPAIGN
The Independent 43,401 29,282
8 18 March 2016
Trump Under Attack: The Donald Is Hacked by Anonymous and Son Eric Receives Threatening Letter Containing White Powder
People Magazine 45,594 14,762
9 23 March 2016 Anti-Trump campaign sparks civil waramong Anonymous hackers The Guardian 41,922 8107
10 1 April 2016 Anonymous Will Begin Latest War on
Donald Trump Friday, April Fools’ Day Inverse 40,188 7623
11 5 April 2016 Donald Trump’s hotel chain HACKED for
second time in six months Mirror.co.uk 35,547 16,577
12 8 May 2016 Presidential candidates may be vulnerableto foreign hackers, US says The Guardian 26,469 6534
13 31 May 2016 ’shape shifting lizard’Hacked construction signs call Trump a FOX 4 News 26,979 6538
14 14 June 2016 Russian Spies Hacked Into the DNC’s
Donald Trump files CNN 23,358 13,794
15 14 June 2016 Russian Gov Hacks DNC, StealTrump Oppo The Weekly Standard 23,358 13,794
16 15 June 2016
Donald Trump Lone Hacker Claim Responsability for Stealing Democratic Party’s Data
ABC 34,221 14,762
17 21 June 2016 Russian hackers reportedly access Clinton Foundation
The Sidney
Morning Herald 33,609 17,908
18 23 June 2016 Russian Hackers Targeted Hillary ClintonCampaign Google Accounts Forbes 31,467 16,456
19 30 June 2016
Hacker Reveals New Trove of DNC Documents and Answers a Few Personal Questions
Mother Jones 32,487
20 25 July 2016 FBI Suspects Russia Hacked DNC; U.S.
Officials Say It Was to Elect Donald Trump Daily Beast 29,427 12,826
21 4 August 2016 ’through the roof’ after Trump remarksHackers for Hillary: event attendance The Guardian 38,505 8954
22 18 August 2016 Is Russia hacking the US election? BBC News 40,494
9075
23 24 August 2016
No proof, but ‘Russian hackers’: CNN blunders with report on ‘breach’ at NYT–not even asking NYT
International RT 44,013 8833
24 2 September 2016 Putin on DNC hack: Let’s talk content, nothackers’ identity International RT 28,560 9438
25 6 September 2016 Hillary Clinton Suggests Alleged RussianHacking Is Designed to Help Trump NBCNews.com 35,394 10,890
26 11 September 2016 CIA Director John Brennan warns of
Table 7.Cont.
Index Date News Source Negative Sample Security-Oriented
Sample
27 14 September 2016 Wrote in Hacked EmailsTrump a ’National Disgrace,’ Colin Powell ABC News 36,465 7865
28 17 October 2016 Could Russian hackers change the U.S.
election result? Aljazeera 50,184 11,374
29 31 October 2016 Was a Trump Server Communicating
With Russia? Slate Magazine 53,193 11,253
30 10 November 2016
Russian hackers throw Trump victory
party with new spear phishing campaign Ars Technica 45,849 11,011
31 11 November 2016 Russia-linked DNC hackers launched waveof cyberattacks hours after Trump victory Ars Technica 34,170 11,737
33 2 December 2016 Trump condemns CIA Russia
hacking report BBC News 31,977 12,463
32 9 December 2016 Russian Hackers Acted to Aid Trump inElection, U.S. Says New York Times 41,055 12,705
34 9 January 2017 Surprise! WikiLeaks’ Assange Backs Trumpon Russia Hacking Report NY Times 36,771 11,132
35 22 February 2017 U.S. CyberCorps, ROTC For Hackers,
In Disarray in Trump Admin Vocativ 50,082 5929
36 5 March 2017 DeepStateGate: Democrats’ ‘Russian
Hacking’ Conspiracy Theory Backfires Big Government 43,605 13,331
37 10 March 2017 Trump adviser admits to contact withDNC hacker The Hill 42,891 1089
38 4 April 2017
Russian Hackers Are Working To Amplify Donald Trump’s Wiretapping Claim, Expert Warns
HuffPost 47,481 1089
39 10 April 2017 Russian hacker arrested in Spain over ’links
to Trump victory’ The Local 50,898 3388
Figure 7.Propossed model PoC.
10. Conclusions
In this paper, a Social Sentiment Sensor in Twitter is proposed collecting historical tweets using [31] in order to classify negative, positive and security-oriented tweets. After comparing three different classification algorithms [15–18] the evaluation results show that the Maximum Entropy provides the most effective results than Naive Bayes and the Support Vector Machine for negative, positive and security oriented tweets. The use of the`1regularization helped to improve the estimation of optimal prediction coefficients, which thesocial sentiment sensorcould achieve 80% of precision between a cyber-attack and a Twitter social context. For the PoC 2016 USA election campaign, politicians appear to have influenced the sentiment of users and in response, hackers reacted as part of the opposition by threatening public information. Information leaking events like those that took place in June, July and August 2016 help to confirm if such acts increase users polarized opinions, this can be a subject of matter consideringR2results of June (0.89), July (0.86) and August (0.85) which can serve as thresholds, which can issue alerts if the opinions have to be correlated with tweets related to security attacks. The implementation of the proposed method is not limited to cyber-attacks, as future work intends to reproduce the proposed method to predict events in real life such as pandemics, prognosis, political alignment and market analysis.
Author Contributions: Regarding the author’s participation in this research, Aldo Hernandez-Suarez, Victor Sanchez, Gabriel Sanchez-Perez and Hector Perez-Meana developed the proposed algorithm and carried out the analysis of the final results. Victor Martinez-Hernandez and Karina Toscano-Medina developed the computer program used to evaluate the performance of proposed algorithm and finally, Jesus Olivares-Mercado developed the computer programs for classifying Twitter data, whose results are presented in the evaluation results sections. Finally, all authors participated in the elaboration and review of the paper.
Conflicts of Interest:The authors declare no conflict of interest.
References
1. Twitter. Available online:https://twitter.com/(accessed on 11 March 2018).
2. Twitter Company. Available online: https://about.twitter.com/en_us/company.html (accessed on 11 March 2018).
5. Zubiaga, A.; Liakata, M.; Procter, R.; Hoi, G.W.S.; Tolmie, P. Analysing how people orient to and spread rumours in social media by looking at conversational threads. PLoS ONE2016, 11, e0150989, doi:10.1371/journal.pone.0150989.
6. Cuenca-Jara, J.; Terroso-Saenz, F.; Valdes-Vela, M.; Skarmeta, A.F. Fuzzy Modelling for Human Dynamics Based on Online Social Networks.Sensors2017,11, 1949, doi:10.3390/s17091949.
7. Haustein, S.; Bowman, T.D.; Holmberg, K.; Tsou, A.; Sugimoto, C.R.; Larivière, V. Tweets as impact indicators: Examining the implications of automated “bot” accounts on Twitter.JASIST2016,67, 232–238, doi:10.1002/asi.23456.
8. Ashktorab, Z.; Brown, C.; Nandi, M.; Culotta, A. Tweedr: Mining twitter to inform disaster response. In Proceedings of the Eleventh International Conference on Information Systems for Crisis Response and Management, PA, USA, 18–21 May 2014; pp. 354–358.
9. Barnaghi, P.; Ghaffari, P.; Breslin, J.G. Opinion Mining and Sentiment Polarity on Twitter and Correlation Between Events and Sentiment. In Proceedings of the International Conference on Big Data Computing Service and Applications, Oxford, UK, 29 March–1 April 2016; pp. 52–57.
10. Amato, F.; Cozzolino, G.; Mazzeo, A.; Romano, S. Detecting anomalies in Twitter stream for Public Security Issues. In Proceedings of the 2nd International Forum In Research and Technologies for Society and Industry Leveraging a Better Tomorrow, Bologna, Italy, 17–21 September 2016; pp. 1–4.
11. Hernández, A.; Sanchez, V.; Sánchez, G.; Pérez, H.; Olivares, J.; Toscano, K.; Nakano, M.; Martinez, V. Security attack prediction based on user sentiment analysis of Twitter data. In Proceedings of the International Conference on Industrial Technology, Taipei, Taiwan, 14–17 March 2016; pp. 610–617.
12. Zhang, Y.; Ruan, X.; Wang, H.; Wang, H.; He, S. Twitter Trends Manipulation: A First Look Inside the Security of Twitter Trending. IEEE Trans. Inf. Forensics Secur.2017,12, 144–156, doi:10.1109/TIFS.2016.2604226. 13. Bifet, A.; Frank, E. Sentiment knowledge discovery in twitter streaming data. In Proceedings of the
International Conference on Discovery Science, Canberra, Australia, 6–8 October 2010; pp. 1–15.
14. Denning, D.E.Activism, Hacktivism, and Cyberterrorism: The Internet as a Tool for Influencing Foreign Policy. Networks and Netwars: The Future of Terror, Crime, and Militancy; The Nautilus Institute: Berkeley, CA, USA, 2001; 239, p. 288.
15. Prasad, S.Micro-Blogging Sentiment Analysis Using Bayesian Classification Methods; Technical Report; Stanford University: Stanford, CA, USA, 2010.
16. Christianini, N.; Shawe-Taylor, J.An Introduction to Support Vector Machines and Other Kernel-Based Learning Methods; Cambridge University Press: Cambridge, UK, 2000.
17. Nigam, K.; Lafferty, J.; McCallum, A. Using maximum entropy for text classification. In Proceedings of the IJCAI-99 Workshop on Machine Learning for Information Filtering, Stockholm, Sweden, 1 August 1999; Volume 1, pp. 61–67.
18. Indra, S.T.; Wikarsa, L.; Turang, R. Using logistic regression method to classify tweets into the selected topics. In Proceedings of the International Conference on Advanced Computer Science and Information Systems, Malang, Indonesia, 15–16 October 2016; pp. 385–390.
19. Kirichenko, L.; Radivilova, T.; Carlsson, A.Detecting Cyber Threats Through Social Network Analysis: Short Survey; SocioEconomic Challenges: Sumy, Ukraine, 2017.
20. Lau, R.Y.; Xia, Y.; Li, C. Social media analytics for cyber attack forensic.IRJET2012,1, 217–220.
21. Samtani, S.; Chen, H. Using social network analysis to identify key hackers for keylogging tools in hacker forums. In Proceedings of the Conference on Intelligence and Security Informatics, Tucson, AZ, USA, 27–30 September 2016; pp. 319–321.
22. Gharibi, W.; Shaabi, M. Cyber threats in social networking websites.arXiv2012, arXiv:1202.2420.
23. Kumar, S.; Carley, K.M. Understanding DDoS cyber-attacks using social media analytics. In Proceedings of the Conference on Intelligence and Security Informatics, Tucson, AZ, USA, 28–30 September 2016; pp. 231–236.
24. Gayo-Avello, D. A meta-analysis of state-of-the-art electoral prediction from Twitter data. Soc. Sci. Comput. Rev.2013,31, 649–679.
26. Lampos, V.; De Bie, T.; Cristianini, N. Flu detector-tracking epidemics on Twitter. InJoint European Conference on Machine Learning and Knowledge Discovery in Databases; Springer: Berlin/Heidelberg, Germany, 2010; pp. 599–602.
27. Yin, J., Karimi, S.; Lampert, A.; Cameron, M.; Robinson, B.; Power, R. Using social media to enhance emergency situation awareness.IEEE Intell. Syst.2012,27, 52–59.
28. Achrekar, H.; Gandhe, A.; Lazarus, R.; Yu, S.H.; Liu, B. Predicting flu trends using twitter data. In Proceedings of the Computer Communications Workshops, Shangai, China, 10–15 April 2011; pp. 702–707.
29. Asur, S.; Huberman, B.A. Predicting the future with social media. In Proceedings of the International Conference on Web Intelligence and Intelligent Agent Technology, Toronto, ON, Canada, 31 August–3 September 2010; pp. 492–499.
30. API Reference—Twitter Developers. Available online:https://developer.twitter.com/en/docs/tweets/ search/api-reference(accessed on 11 March 2018).
31. Hernandez-Suarez A.; Sanchez-Perez G; Toscano-Medina K.; Martinez-Hernandez V.; Sanchez V.; Perez-Meana H. A Web Scraping Methodology for Bypassing Twitter API Restrictions. arXiv 2018, arXiv:1803.09875.
32. Godfrey, D.; Johns, C.; Sadek, C. Interpreting Clusters of World Cup Tweets.arXiv2014, arXiv:1408.5427. 33. Ranks, N.L. Stop Words. Available online:http://www.ranks.nl/stopwords(accessed on 11 March 2018). 34. Saini, J.R.; Rakholia, R.M. On Continent and Script-Wise Divisions-Based Statistical Measures for Stop-words
Lists of International Languages.Procedia Comput. Sci.2016,89, 313–319.
35. Porter, M.F. A Language for Stemming Algorithms. 2001. Available online:https://snowball.tartarus.org/ texts/introduction.html(accessed on 11 March 2018).
36. Balakrishnan, V.; Lloyd-Yemoh, E. Stemming and lemmatization: A comparison of retrieval performances. Lect. Notes Softw. Eng.2014,2, 262.
37. -Go, A.; Bhayani, R.; Huang, L.Twitter Sentiment Classification Using Distant Supervision; CS224N Project Report; Stanford, CA, US, 2009.
38. Wang, Y.; Liu, Y.; Feng, L.; Zhu, X. Novel feature selection method based on harmony search for email classification.Knowl. Based Syst.2015,73, 311–323.
39. Pang, B.; Lee, L.Opinion mining and sentiment analysis.Found. Trends Inf. Retr.2008,2, 1–135.
40. Maas, A.L.; Daly, R.E.; Pham, P.T.; Huang, D.; Ng, A.Y.; Potts, C. Learning word vectors for sentiment analysis. In Proceedings of the 49th Annual Meeting of the Association for Computational Linguistics: Human Language Technologies, Portland, OR, USA, 19–24 June 2011; pp. 142–150.
41. Jiang, L.; Yu, M.; Zhou, M.; Liu, X.; Zhao, T. Target-dependent twitter sentiment classification. In Proceedings of the 49th Annual Meeting of the Association for Computational Linguistics: Human Language Technologies, Portland, OR, USA, 19–24 June 2011; Volume 1, pp. 151–160.
42. Collier, N.; Doan, S. Syndromic classification of twitter messages. InInternational Conference on Electronic Healthcare; Springer: Berlin/Heidelberg, Germany, 2011; pp. 186–195.
43. McCallum, A.; Nigam, K. A comparison of event models for naive bayes text classification. In Proceedings of the AAAI-98 Workshop on Learning for Text Categorization, Madison, WI, USA, 26–27 July 1998; pp. 41–48. 44. Böhme, R.; Moore, T. How do consumers react to cybercrime? InCrime Researchers Summit (eCrime); IEEE:
Piscataway, NJ, USA, 2012.
45. Saif, H.; Fernandez, M.; He, Y.; Alani, H. Evaluation datasets for Twitter sentiment analysis: A survey and a new dataset, the STS-Gold. In Proceedings of the 1st Interantional Workshop on Emotion and Sentiment in Social and Expressive Media: Approaches and Perspectives from AI (ESSEM 2013), At Turin, Italy, 3 December 2013.
46. Tibshirani, R. Regression shrinkage and selection via the lasso. J. R. Stat. Soc. Ser. B Methodol. 1996,58, 267–288.
47. Singhal, A.; Buckley, C.; Mitra, M. Pivoted document length normalization. In Proceedings of the 19th Annual International ACM SIGIR Conference on Research and Development in Information Retrieval, Zurich, Switzerland, 18–22 August 1996; pp. 21–29.