Cancer Management and Research 2018:10 3911–3929
Cancer Management and Research
Dove
press
submit your manuscript | www.dovepress.com 3911
O R i g i n a l R e s e a R C h
open access to scientific and medical research
Open Access Full Text Article
Prognostic value of the combination of
microsatellite instability and
BRAF
mutation
in colorectal cancer
Yingchi Yang Dong Wang lan Jin guocong Wu Zhigang Bai Jin Wang hongwei Yao Zhongtao Zhang
Department of general surgery, Beijing Key laboratory of Cancer invasion and Metastasis Research and national Clinical Research Center for Digestive Diseases, Beijing Friendship hospital, Capital Medical University, Beijing, China
Purpose: The aim of this study was to investigate the prognostic value of the combination of
microsatellite instability (MSI) and BRAF V600E mutation in colorectal cancer (CRC).
Materials and methods: We compare the prognosis difference among CRC patients with
four subtypes according to MSI and BRAF mutation, ie, microsatellite stable/BRAF wild type (MSS/BRAFwt), MSS/BRAF mutation (MSS/BRAFmut), MSI/BRAFwt, and MSI/BRAFmut, by pooling the previous related reports and public available data sets till December 2017 for the first time.
Results: Twenty-seven independent studies comprising 24,067 CRC patients were included.
Meta-analysis suggested that, compared with MSS/BRAFwt subtype, MSS/BRAFmut was associated with shorter overall survival (OS) (N=25, HR = 2.018, 95% CI = 1.706–2.388, P=2.220E-16), while there was a trend of association of MSI/BRAFmut with OS (N=13, HR = 1.324, 95% CI = 0.938–1.868, P=1.096E-01) and no association of MSI/BRAFwt with OS (N=17, HR = 0.996, 95% CI = 0.801–1.240, P=9.761E-01). Compared with MSI/
BRAFwt subtype, MSI/BRAFmut was a poor factor for OS (N=22, HR = 1.470, 95% CI =
1.243–1.740, P=7.122E-06). Compared with MSS/BRAFmut subtype, both MSI/BRAFwt (N=11, HR = 0.560, 95% CI = 0.433–0.725, P=1.034E-05) and MSI/BRAFmut (N=16, HR
= 0.741, 95% CI = 0.567–0.968, P=2.781E-02) were favorable for OS. Subgroup analysis revealed similar results in all subgroups except the subgroup of stage IV cancer, in which MSI showed poor effects on OS in BRAF wild-type patients (N=6, HR = 1.493, 95% CI =
1.187–1.879, P=6.262E-04) but not in BRAF-mutated patients (N=5, HR = 1.143, 95% CI
= 0.789–1.655, P=4.839E-01). Meta-analysis regression and test of interaction revealed no interaction of MSI with BRAF mutation when evaluating the associations of MSI/BRAF mutation subtypes with OS in CRC.
Conclusion: Among the four subtypes according to MSI and BRAF mutation, MSS/BRAFmut
was a poor prognostic factor, while MSS/BRAFwt and MSI/BRAFwt were comparable and favor-able and MSI/BRAFmut was moderate in CRC. The combination of MSI/BRAF mutations could facilitate the planning of individualized treatment strategies and prognosis improvement in CRC.
Keywords: meta-analysis, microsatellite instability, colorectal cancer, BRAF mutation, prognosis
Introduction
Colorectal cancer (CRC) is the third most common malignancy in adults worldwide, with more than 6,000 million deaths each year.1 Currently, the American Joint
Commit-tee on Cancer (AJCC) TNM staging system remains the strongest prognostic marker. However, growing evidence revealed that due to the considerable heterogeneity in CRC clinical presentation and prognosis, CRC should be subdivided into different prognostic Correspondence: Zhongtao Zhang
Department of general surgery, Beijing Key laboratory of Cancer invasion and Metastasis Research and national Clinical Research Center for Digestive Diseases, Beijing Friendship hospital, Capital Medical University, no 95 Yongan Road, Xi-Cheng District, Beijing 100050, China Tel +86 158 1015 2032
email zhangzhtyy@163.com
Journal name: Cancer Management and Research Article Designation: Original Research Year: 2018
Volume: 10
Running head verso: Yang et al
Running head recto: Prognostic value of MSI/BRAF mutation status in CRC DOI: http://dx.doi.org/10.2147/CMAR.S169649
Cancer Management and Research downloaded from https://www.dovepress.com/ by 118.70.13.36 on 20-Aug-2020
For personal use only.
Dovepress Yang et al
groups by additional prognostic or predictive factors such as molecular biomarkers that reflect the development path-ways of CRC.2–5 In the past cascades, the researchers have
investigated a series of biomarkers and pathways including microsatellite instability (MSI) and mutation in B-type Raf kinase (BRAF), which are used as significant prognostic fac-tors in intrinsic CRC subtypes.6–9
MSI, the molecular fingerprint of the deficient DNA mis-match repair (MMR) system, is caused by a lack of or alteration in MMR genes, which causes the accumulation of insertion and/or deletion in the microsatellite DNA domain.10,11 MSI,
ie, deficient MMR, results from inheritance of a germline mutation in one of the MMR genes (MLH1, MSH2, MSH6, and PMS2) or more commonly from epigenetic inactivation of MLH.12,13 MSI occurs in ~15% of cases in CRC and
usu-ally favorable for the clinical outcomes in CRC in contrast to microsatellite stable (MSS).14–16 MSI can be evaluated by
immunohistochemistry (IHC) analysis of MLH1, MSH2,
MSH6, and PMS2 or by MSI testing.
BRAF, a member of the RAF family, is an essential
inter-mediary in the RAS/RAF/mitogen-activated protein kinase (MAPK) signaling cascade and is commonly activated by its mutations.17–19 BRAF V600E missense mutation is a valine
(V) to glutamic acid (E) switch at codon 600 caused by the c.1799T>A transversion and accounts for 80% of BRAF mutations.20 BRAF V600E mutation occurs in about 14% of
CRC cases and more frequently in sporadic CRC with MSI.21
However, in contrast to MSI, BRAF V600E mutation shows an independent negative prognostic association with survival in CRC.22–25 Recent findings indicate that the prognostic
poten-tial of MSI can override the negative prognostic potenpoten-tial of
BRAFV600E.7,26 A number of studies have been performed to
investigate the clinical utility of the combination of MSI sta-tus and BRAF mutation; however, the results are inconsistent and inconclusive and the sample size of the individual study is limited.
In the present study, we performed a meta-analysis for the first time to explore the prognostic role of the combination of MSI status and BRAF V600E mutation in CRC.
Materials and methods
Publication search
A systematic search was performed to obtain the published articles that report the prognostic effects of the combination of MSI status and BRAF mutation in CRC in three English databases (PubMed, EMBASE, and Web of Science) up to December 30, 2017. The following terms were used as
keywords in searching: “colorectal OR colon OR rectal”, “cancer OR tumor OR carcinoma”, “mismatch repair OR MMR OR microsatellite instability OR MSI”, “B-type Raf kinase OR BRAF”, and “prognosis OR survival OR overall survival OR recurrence-free survival OR RFS OR progression-free survival OR PFS”. The retrieved articles were screened and selected by two independent investigators according to the inclusion and exclusion criteria. We also screened the review articles and the references of selected articles to identify additional eligible studies. In addition, the public databases, TCGA and NCBI GEO, were utilized to search for eligible studies.
inclusion and exclusion criteria
Inclusion criteria were as follows: 1) the histologic type of the tumors was limited to CRC; 2) the associations of the com-bination of MSI and BRAF mutation with RFS, PFS, and/or overall survival (OS) in CRC were evaluated; 3) the sample size of the study was more than 200, and when one study reported only MSI CRCs, the sample size should be more than 50; 4) full peer-reviewed articles that have been published as full texts; and 5) only the studies published in English. Exclusion criteria were as follows: 1) study with insufficient or duplicate data and 2) abstracts, letters, or review articles.
Data extraction
The following characteristics of eligible studies and related data were collected by two independent authors carefully: name of the first author; year of publication; country of origin; patient sex and age; cancer type; TNM stage; frequency of MSI/BRAFmut, MSI/BRAFwt, MSS/BRAFmut, and MSS/
BRAFwt; sample size; and HRs with their 95% CI that reflect
the associations of the combination of MSI and BRAF with RFS, PFS, or OS. If the study reports both the data calculated by univariate and multivariate analyses, only the adjusted HRs and 95% CIs in multivariate analysis were selected. If one study only reported a Kaplan–Meier plot curve, HR and its 95% CI were evaluated according to the previous reports.27
Inconsistency was solved by discussion among the authors.
Quality score assessment
The Newcastle Ottawa Scale (NOS) was used to evaluate the methodological quality of each eligible article in our meta-analysis according to the following three aspects: selection, comparability, and exposure, with scores ranging from 0 to 9. The study was defined as high quality if the NOS score was more than 7.
Cancer Management and Research downloaded from https://www.dovepress.com/ by 118.70.13.36 on 20-Aug-2020
Dovepress Prognostic value of MSI/BRAF mutation status in CRC
statistical analysis
Stata 12.0 software (StataCorp, College Station, TX, USA) was used to perform all the statistical analyses. The crude HRs and their 95% CIs were pooled to assess and compare the associations of RFS, PFS, or OS with the combination of MSI and BRAF mutation in CRC. The statistical significant level was determined by Z-test. A P-value less than 0.05 was considered as statistically significance. The heterogeneity among the studies was determined by Q statistic test. Fixed-effects model (Mantel–Haenszel method) was used when
P>0.1 or I2<50%, otherwise, the pooled HRs were calculated
by random-effects model.28 The stabilities of the pooled HRs
were evaluated by sensitivity analysis by omitting each study in every turn. At the same time, subgroup analyses were per-formed according to the cancer type (colon cancer [CC] and mixed types, which included both CC and rectal cancer, and the results of CC and rectal cancer could not be separated), tumor stage (TNM I–III and IV), therapeutic strategy (sur-gery with or without adjuvant chemotherapy and first-line chemotherapy), sample size (<500, 500-1000, and >1,000 cases), and methods for obtaining HR (M, U, and KM, which were obtained from multivariate analysis, univariate analy-sis, and Kaplan–Meier plot curves, respectively). Potential publication bias was explored by Begg’s funnel plots and
Egger’s test.29,30 Influence of a covariate on the association of
one factor with OS in CRC was analyzed by meta-analysis regression and test of interaction.31
Results
study characteristics
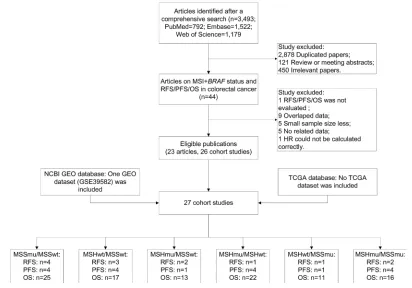
The literature selection process is shown in Figure 1. A total of 3,493 documents were initially identified from three English databases. After excluding those duplicated papers, reviews or meeting abstracts, and irrelevant papers, 44 articles were further evaluated. Subsequently, 21 articles were excluded according to the inclusion and exclusion criteria, of which three articles did not report RFS, PFS, or OS outcomes related to the MSI/BRAF mutation status,32–34
nine had overlapped data with other studies,35–43 five articles
included small sample size,44–48 six reported no sufficient
data,49–54 and HR in one article could not be calculated
cor-rectly from the Kaplan–Meier plot curve.55 Finally, 23 eligible
articles containing 26 cohort studies were included in the present meta-analysis.7,23,25,56–75 Venderbosch et al’s70 article
consisted of four independent cohort studies. Nam et al’s73
report contained 197 stage IV CRC cases and was included because the sample size was very close to 200. In addition, three cohort studies with overlapped data with other studies
Figure 1 Flow chart of study selection.
Abbreviations: Msi, microsatellite instability; geO, gene expression Omnibus; TCga, The Cancer genome atlas; Msimut, microsatellite instability and BRAF mutation; Msiwt, microsatellite instability and BRAF wild type; Mssmut, microsatellite stable and BRAF mutation; Msswt, microsatellite stable and BRAF wild type; Os, overall survival; PFs, progression-free survival; RFs, recurrence-free survival.
Cancer Management and Research downloaded from https://www.dovepress.com/ by 118.70.13.36 on 20-Aug-2020
Dovepress Yang et al
were also included in subgroup analysis stratified by cancer type and stage.38,39,42 Furthermore, public available data
sets from online databases, TCGA and NCBI GEO, were also screened according to the criteria, and only a data set, GSE39582, was selected.76 In total, 27 independent cohort
studies containing 24,067 cases were included. Quality assessment was performed, and all the studies achieved a high NOS score (≥7, data not shown). The characteristics of the included studies are summarized in Table 1.
associations of Msi/BRAF mutation status
with RFs and Os in CC in gse39582
There were 465 CC cases in GSE39582. The average age of the patients was 67.2 years. Two hundred fifty-seven cases were males and 208 were females. Two hundred sixty-five patients received adjuvant chemotherapy after resection. Kaplan–Meier plot curve and Cox proportional hazards models were performed to clarify the associa-tions of the MSI/BRAF mutation status with RFS and OS ( Figure 2 and Table 2). In univariate analysis, compared with MSS/BRAFwt, MSS/BRAFmut was poor for RFS (HR = 2.586, 95% CI = 1.262–5.296, P=9.408E-03), while MSI/BRAFwt was favorable for RFS (HR = 0.338, 95% CI = 0.138–0.827, P=1.746E-02) and MSI/BRAFmut showed a trend of favorable effects on RFS (HR = 0.396, 95% CI = 0.146–1.073, P=6.858E-02). BRAF mutation had no effects on RFS in patient with MSI phenotype. Compared with MSS/BRAFmut, both MSI/BRAFwt (HR = 0.134, 95% CI = 0.044–0.411, P=4.454E-04) and MSI/BRAFmut (HR = 0.158, 95% CI = 0.047–0.525,
P=2.631E-03) were favorable factors. After adjusting for TNM stage and adjuvant chemotherapy, only significant associations of RFS with MSI/BRAFwt (HR = 0.156, 95% CI = 0.036–0.616, P=8.069E-03) and MSI/BRAFmut (HR
= 0.196, 95% CI = 0.051–0.737, P=1.612E-02) compared with MSS/BRAFmut were found. For OS, MSS/BRAFmut was an unfavorable factor for the prognosis compared with MSS/BRAFwt phenotype in both univariate analysis (HR = 3.050, 95% CI = 1.548–6.007, P=1.264E-03) and multivariate analysis (HR = 2.600, 95% CI = 1.313–5.150,
P=6.132E-03). Compared with MSS/BRAFmut, both MSI/BRAFwt and MSI/BRAFmut were favorable factors in univariate analysis (MSI/BRAFwt vs MSS/BRAFmut: HR = 0.268, 95% CI = 0.108–0.660, P=4.199E-03; MSI/
BRAFmut vs MSS/BRAFmut: HR = 0.264, 95% CI =
0.098–0.710, P=8.322E-03) and multivariate analysis (MSI/BRAFwt vs MSS/BRAFmut: HR = 0.315, 95%
CI = 0.115–0.863, P=2.461E-02; MSI/BRAFmut vs MSS/BRAFmut: HR = 0.287, 95% CI = 0.104–0.793,
P=1.604E-02). At the same time, no interaction between MSI and BRAF mutation was observed.
Meta-analysis results
Rfs/PFsThere were four studies evaluating the associations of the MSI/BRAF mutation status with RFS in CRC. Compari-sons were performed in six pairs (MSS/BRAFmut vs MSS/
BRAFwt, MSI/BRAFwt vs MSS/BRAFwt, MSI/BRAFmut
vs MSS/BRAFwt, MSI/BRAFmut vs MSI/BRAFwt, MSI/
BRAFwt vs MSS/BRAFmut, and MSI/BRAFmut vs MSS/ BRAFmut). Overall, HRs of MSS/BRAFmut, MSI/BRAFwt,
and MSI/BRAFmut were 1.543 (95% CI = 1.159–2.053,
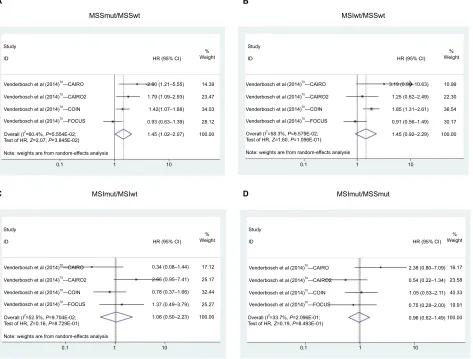
P=2.978E-03), 0.505 (95% CI = 0.308–0.828, P= 6.728E-03), and 0.535 (95% CI = 0.302–0.943, P=3.235E-02), respec-tively, compared to MSS/BRAFwt (Figure 3A–C and Table 3). MSI was also a favorable factor for RFS in BRAF-mutated patients (HR = 0.233, 95% CI = 0.069–0.783, P=1.827E-02; Figure 3D and Table 3) as well as wild-type patients. For the metastatic CRC (mCRC) treated with first-line chemotherapy, there were four studies evaluating the associations of MSI/
BRAF mutation status with PFS. The mCRC patients with
MSS/BRAFmut (HR = 1.452, 95% CI = 1.020–0.2.067,
P=3.845E-02) or MSI/BRAFmut (HR = 1.380, 95% CI =
1.070–0.1.770, P=1.207E-02) exhibited poor PFS compared with those with MSS/BRAF wild type (Figure 4 and Table 3). In contrast, there was no significant difference in PFS in other comparisons. Subgroup analysis was not performed due to the limited included studies.
Os
Next, the prognostic value of the combination of MSI and
BRAF mutation in OS in CRC was analyzed. Overall, BRAF
mutation was a poor factor for OS in both MSS (MSS/
BRAFmut vs MSS/BRAFwt: N=25, HR = 2.018, 95% CI
= 1.706–2.388, P=2.220E-16; Figure 5A and Table 4) and MSI patients (MSI/BRAFmut vs MSI/BRAFwt: N=22, HR
= 1.470, 95% CI = 1.243–1.740, P=7.122E-06; Figure 5B). MSI was a favorable factor for OS in BRAF-mutated patients (MSI/BRAFmut vs MSS/BRAFmut: N=16, HR = 0.741, 95% CI = 0.567–0.968, P=2.781E-02; Figure 5C) but not in
BRAF wild-type patients (MSI/BRAFwt vs MSS/BRAFwt:
N=17, HR = 0.996, 95% CI = 0.801–1.240, P=9.761E-01; Figure 5D). In addition, MSI decreased the negative prog-nostic potential of BRAF mutations to a non-significant
Cancer Management and Research downloaded from https://www.dovepress.com/ by 118.70.13.36 on 20-Aug-2020
Dovepress Prognostic value of MSI/BRAF mutation status in CRC
Table 1
Basal characteristics of the included studies in the present meta-analysis
Study
Treatment
Country
Sex (male/ female)
Age (years): N
Cancer type
TNM stage MSImut MSIwt MSSmut MSSwt Prognosis
HR resource
samowitz et al (2005)
23 na U sa 435/368 < 65: 317; ≥ 65: 486 CC i– iii : 717; iV: 158 40 40 39 758 O s M
French et al (2008)
56 s + a C U sa 254/236 61.4 CC ii– iii 35 23 42 390 O s U
Roth et al (2010)
57 s + a C europe 755/552 > 60: 659; ≤ 60: 648 CC ii– iii 45 143 53 1,002 RF
s and O
s
M
Tran et al(2011)
58 s/chemotherapy a ustralia/U sa 186/164 63.4 CRC iV 12 28 30 280 O s KM
Zlobec et al (2010)
59 s ± a C switzerland 186/215 69.5 CRC i– iV 19 38 26 291 O s KM g
avin et al (2012)
25 s + a C U sa 1,234/992 < 65: 1,516; ≥ 65: 710 CC ii– iii 71 130 176 1,358 O s KM
Kalady et al (2012)
60 s ± a C U sa 251/224 67 CRC i– iii : 322 29 47 9 251 O s M/KM
Ogino et al (2012)
61 s + a C U sa 274/232 59.7 CC iii 34 43 41 387 RF
s and O
s
M
Phipps et al (2012)
62 na U sa 900/1,080 < 60: 955; ≥ 60: 1,025 CRC i– iii : 1,722; iV: 226 126 172 109 1,494 O s M
sylvester et al (2012)
63 s ± a C U sa 182/245 67.4 CRC i– iii : 341; iV: 78 17 34 13 307 O s KM gse 39582 76 s ± a C France 257/208 67.2 CC i– iii : 407; iV: 58 31 42 14 378 RF
s and O
s
M
lochhead et al (2013)
7 na U sa 570/683 68.5 CRC i– iii : 972; iV: 170 101 92 81 979 O s M
Wangefjord et al (2013)
64 s ± a C sweden 247/277 70.5 CRC i– iii : 433; iV: 91 43 28 29 384 O s M
lin et al (2014)
65 s ± a C Taiwan, China 689/374 70.3 CC i– iii : 870; iV: 193 26 101 36 900 O s KM
luey et al (2014)
66 s ± a C a ustralia 563/546 72.0 CRC i– iii : 1,039; iV: 44 108 32 133 720 O s M/KM
Malesci et al (2014)
67 s ± a C italy 513/368 64.8 CRC i– iii : 668; iV: 213 37 25 23 764 O s M/KM
Ooki et al (2014)
68 s ± a C Japan 242/163 64.4 CRC iii 5 10 16 374 RF
s and O
s
M/KM
Toon et al (2014)
69 s ± a C a ustralia 683/743 74 CRC i– iii : 1,364; iV: 62 184 94 91 1,057 O s M/KM
Venderbosch et al (2014)
70—C ai RO Chemotherapy n etherlands 1,988/1,071 63.9 CRC iV 12 6 13 291 O
s and PF
s
U
Venderbosch et al (2014)
70—C ai RO2 Chemotherapy n etherlands CRC iV 12 17 33 454 O
s and PF
s
U
Venderbosch et al (2014)
70—CO in Chemotherapy UK CRC iV 20 45 100 1,296 O
s and PF
s
U
Venderbosch et al (2014)
70—FOCU s Chemotherapy UK CRC iV 9 31 51 672 O
s and PF
s
U
seppälä et al (2015)
71 s ± a C Finland 370/392 70.3 (11.5) CRC i– iii : 652; iV: 100 60 44 34 600 O s M
de Cuba et al (2016)
72 s ± a C n etherlands 62/81 ≤ 68: 72; > 69: 71 CC ii– iii 73 70 na na O s KM n
am et al (2016)
73 s ± a C Korea 103/88 59.77 CRC iV 0 3 6 188 O s M
Fujiyoshi et al (2017)
74 s ± a C Japan 231/170 63.4 CRC iV 4 11 21 360 O s U
Taieb et al (2017)
75 s + a C europe 2,397/2,014 58.1 CC iii 201 276 279 3,655 O s KM Abbreviations: a C, adjuvant
chemotherapy; CC, colon
cancer; CRC, colorectal cancer; KM,
h
R was obtained
indirectly from Kaplan–Meier
plot curves; M,
h
R was obtained
from multivariate analys
is; M
si
mut, microsatellite instability and
BRAF
mutation; M
si
wt, microsatellite instability
and
BRAF
wild
type; M
ss
mut, microsatellite stable and
BRAF
mutation; M
ss
wt, microsatellite stable and
BRAF
wild
type;
na
, not applicable; O
s,
overall survival; RF
s,
recurrence-free survival;
PF
s, progression-free survival;
s, surgery; U,
h
R was obtained from univariate analysis.
Cancer Management and Research downloaded from https://www.dovepress.com/ by 118.70.13.36 on 20-Aug-2020
Dovepress Yang et al
Figure 2 effect of Msi/BRAF mutation status on RFs and Os in colon cancer (gse39582).
Note: RFs (A) and Os (B) were compared among the colon cancer patients with four subtypes according to the combination of Msi and BRAF mutation, ie, Msswt, Mssmut, Msiwt, and Msimut.
Abbreviations: Msi, microsatellite instability; Msimut, microsatellite instability and BRAF mutation; Msiwt, microsatellite instability and BRAF wild type; Mssmut, microsatellite stable and BRAF mutation; Msswt, microsatellite stable and BRAF wild type; RFs, recurrence-free survival; Os, overall survival.
100
A B
RFS OS
n=29
n=14 n=41
n=41
n=29
n=378
n=14 n=373
log-rank test: P=2.968E-04 log-rank test: P=3.192E-03
90
80
Survival probability (%
)
70
60
50
40
30
0 50 100
RFS time (months)
150 200
MSImut MSIwt MSSmut MSSwt
MSImut MSIwt MSSmut MSSwt 100
80 90
70 60
Survival probability (%
)
50 40 30 20 10
0 50 100
OS time (months)
150 200
Table 2 Univariate and multivariate Cox proportional hazards regression models for RFs and Os of the patients with colon cancer
in gse39582 cohort
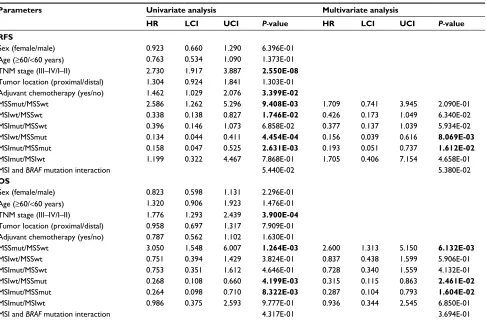
Parameters Univariate analysis Multivariate analysis
HR LCI UCI P-value HR LCI UCI P-value RFS
sex (female/male) 0.923 0.660 1.290 6.396e-01
age (≥60/<60 years) 0.763 0.534 1.090 1.373e-01
TnM stage (iii–iV/i–ii) 2.730 1.917 3.887 2.550E-08
Tumor location (proximal/distal) 1.304 0.924 1.841 1.303e-01
adjuvant chemotherapy (yes/no) 1.462 1.029 2.076 3.399E-02
Mssmut/Msswt 2.586 1.262 5.296 9.408E-03 1.709 0.741 3.945 2.090e-01
Msiwt/Msswt 0.338 0.138 0.827 1.746E-02 0.426 0.173 1.049 6.340e-02
Msimut/Msswt 0.396 0.146 1.073 6.858e-02 0.377 0.137 1.039 5.934e-02
Msiwt/Mssmut 0.134 0.044 0.411 4.454E-04 0.156 0.039 0.616 8.069E-03
Msimut/Mssmut 0.158 0.047 0.525 2.631E-03 0.193 0.051 0.737 1.612E-02
Msimut/Msiwt 1.199 0.322 4.467 7.868e-01 1.705 0.406 7.154 4.658e-01
Msi and BRAF mutation interaction 5.440e-02 5.380e-02
OS
sex (female/male) 0.823 0.598 1.131 2.296e-01
age (≥60/<60 years) 1.320 0.906 1.923 1.476e-01
TnM stage (iii–iV/i–ii) 1.776 1.293 2.439 3.900E-04
Tumor location (proximal/distal) 0.958 0.697 1.317 7.909e-01 adjuvant chemotherapy (yes/no) 0.787 0.562 1.102 1.630e-01
Mssmut/Msswt 3.050 1.548 6.007 1.264E-03 2.600 1.313 5.150 6.132E-03
Msiwt/Msswt 0.751 0.394 1.429 3.824e-01 0.837 0.438 1.599 5.906e-01
Msimut/Msswt 0.753 0.351 1.612 4.646e-01 0.728 0.340 1.559 4.132e-01
Msiwt/Mssmut 0.268 0.108 0.660 4.199E-03 0.315 0.115 0.863 2.461E-02
Msimut/Mssmut 0.264 0.098 0.710 8.322E-03 0.287 0.104 0.793 1.604E-02
Msimut/Msiwt 0.986 0.375 2.593 9.777e-01 0.936 0.344 2.545 6.850e-01
Msi and BRAF mutation interaction 4.317e-01 3.694e-01
Note: For RFs, TnM stage and adjuvant chemotherapy were adjusted in multivariate analysis; for Os, TnM stage was adjusted in multivariate analysis; Bold, statistically
significant.
Abbreviations: LCI, lower 95% confidence interval of HR; MSI, microsatellite instability; MSImut, microsatellite instability and BRAF mutation; Msiwt, microsatellite instability and BRAF wild type; Mssmut, microsatellite stable and BRAF mutation; Msswt, microsatellite stable and BRAF wild type; Os, overall survival; RFs, recurrence-free survival;
UCI, upper 95% confidence interval of HR.
Cancer Management and Research downloaded from https://www.dovepress.com/ by 118.70.13.36 on 20-Aug-2020
Dovepress Prognostic value of MSI/BRAF mutation status in CRC
Figure 3 Forest plot for Msi/BRAF mutation status and RFs in colorectal cancer.
Notes: The colorectal cancer was divided into four subtypes according to the combination of Msi and BRAF mutation, ie, Msswt, Mssmut, Msiwt, and Msimut. RFs was compared between Mssmut and Msswt (A), Msiwt and Msswt (B), Msimut and Msswt (C), and Msimut and Mssmut (D) by pooling the previous studies.
Abbreviations: Msimut, microsatellite instability and BRAF mutation; Msiwt, microsatellite instability and BRAF wild type; Mssmut, microsatellite stable and BRAF mutation; Msswt, microsatellite stable and BRAF wild type; RFs, recurrence-free survival.
Study
MSSmut/MSSwt MSIwt/MSSwt
MSImut/MSSwt MSImut/MSSmut
A B
C D
ID
Roth et al (2010)57
Ogino et al (2012)61
GSE3958276
Ooki et al (2014)68
Overall (I2=0.0%, P=5.499E-01; Test of HR, Z=2.97, P=2.978E-03)
Ogino et al (2012)61
GSE3958276
Ooki et al (2014)68
Overall (I2=0.0%, P=7.906E-01; test of HR, Z=2.71, P=6.728E-03) HR (95% CI)
1.36 (0.86–2.16) 38.57
33.39
11.70
16.34
100.00 1.38 (0.84–2.26)
1.71 (0.74–3.95)
2.42 (1.20–4.92)
1.54 (1.16–2.05)
0.63 (0.32–1.28) 68.11
31.89
100.00 0.38 (0.14–1.04)
0.53 (0.30–0.95)
0.57 (0.31–1.07) 63.84
30.16
5.99
100.00 0.43 (0.17–1.05)
0.32 (0.04–2.45)
0.50 (00.31–0.83)
0.19 (0.05–0.74) 82.35
17.65
100.00 0.56 (0.03–9.60)
0.23 (0.07–0.78) %
Weight
Study
ID HR (95% CI)
Study
0.1 1 10 0.1 1 10
0.1 1 10 0.1 1 10
ID
Ogino et al (2012)61
GSE3958276
Overall (I2=0.0%, P=4.131E-01; Test of HR, Z=2.14, P=3.235E-02)
Ogino et al (2012)61
GSE3958276
Ooki et al (2014)68
Overall (I2=0.0%, P=5.120E-01; test of HR, Z=2.36, P=1.827E-02) HR (95% CI)
% Weight
Study
ID HR (95% CI)
% Weight
% Weight
Table 3 Meta-analysis results for associations of Msi/BRAF mutation status with RFs/PFs in colorectal cancer
Groups N HR HRlci HRuci PHR Model I2 (%) P
heter PBegg PEgger
RFS
Mssmut/Msswt 4 1.543 1.159 2.053 2.978E-03 F 0.0 5.499e-01 3.077e-01 2.388e-01
Msiwt/Msswt 3 0.505 0.308 0.828 6.728E-03 F 0.0 7.906e-01 2.983e-01 3.043e-01
Msimut/Msswt 2 0.535 0.302 0.943 3.235E-02 F 0.0 4.131e-01
Msimut/Mssmut 2 0.233 0.069 0.783 1.827E-02 F 0.0 5.120e-01
PFS
Mssmut/Msswt 4 1.452 1.020 2.067 3.845E-02 R 60.4 5.554e-02 3.077e-01 4.938e-01
Msiwt/Msswt 4 1.453 0.920 2.294 1.096e-01 R 58.3 6.579e-02 7.339e-01 9.647e-01
Msimut/Msswt 1 1.380 1.070 1.770 1.207E-02
Msimut/Msiwt 4 1.061 0.505 2.232 8.729e-01 R 52.5 9.704e-02 7.339e-01 8.668e-01
Msiwt/Mssmut 1 0.990 0.790 1.240 9.283e-01
Msimut/Mssmut 4 0.958 0.618 1.486 8.493e-01 F 33.7 2.096e-01 7.339e-01 7.859e-01
Note: Bold, statistically significant.
Abbreviations: hRlci, lower 95% Ci of hR; hRuci, upper 95% Ci of hR; Msi, microsatellite instability; Msimut, microsatellite instability and BRAF mutation; Msiwt, microsatellite instability and BRAF wild type; Mssmut, microsatellite stable and BRAF mutation; Msswt, microsatellite stable and BRAF wild type; R, random-effects model; F,
fixed-effects model; PFS, progression-free survival; RFS, recurrence-free survival.
Cancer Management and Research downloaded from https://www.dovepress.com/ by 118.70.13.36 on 20-Aug-2020
Dovepress Yang et al
level (MSI/BRAFmut vs MSS/BRAFwt: N=13, HR = 1.324, 95% CI = 0.938–1.868, P=1.096E-01; Figure 5E). HR of the patients with MSI/BRAFwt was 0.560 (N=11, 95% CI =
0.433–0.725, P=1.034E-05, Figure 5F) compared to MSS/
BRAFmut. Subgroup analyses were also performed according
to the cancer type, tumor stage, therapeutic strategy, sample size, and methods for obtaining HR. Associations of MSI/
BRAF mutation status with OS in CRC in subgroups were
similar with the results overall except the subgroup of stage IV cancers and first-line chemotherapy–treated stage IV cancers. In the subgroup of stage IV CRC, BRAF mutation was a poor factor for OS in both MSS (MSS/BRAFmut vs MSS/BRAFwt: N=8, HR = 2.180, 95% CI = 1.844–2.578,
P=0.000E+00) and MSI patients (MSI/BRAFmut vs MSI/
BRAFwt: N=6, HR = 1.865, 95% CI = 1.205–2.887,
P=5.110E-03; Table 4). However, unlike the subgroup of Figure 4 Forest plot for Msi/BRAF mutation status and PFs in colorectal cancer.
Notes: The colorectal cancer was divided into four subtypes according to the combination of Msi and BRAF mutation, ie, Msswt, Mssmut, Msiwt, and Msimut. PFs was compared between Mssmut and Msswt (A), Msiwt and Msswt (B), Msimut and Msiwt (C), and Msimut and Mssmut (D) by pooling the previous studies.
Abbreviations: Msi, microsatellite instability; Msimut, microsatellite instability and BRAF mutation; Msiwt, microsatellite instability and BRAF wild type; Mssmut, microsatellite stable and BRAF mutation; Msswt, microsatellite stable and BRAF wild type; PFs, progression-free survival.
-2.60 (1.21–5.55)
1.79 (1.09–2.93)
1.42(1.07–1.88)
0.93 (0.63–1.39)
1.45 (1.02–2.07)
0.34 (0.08–1.44)
2.65 (0.95–7.41)
0.78 (0.37–1.66)
1.37 (0.49–3.79)
1.06 (0.50–2.23) 17.12
25.17
32.44
25.27
100.00
3.19 (0.96–10.63)
1.25 (0.62–2.49)
1.85 (1.31–2.61)
0.91 (0.56–1.49)
1.45 (0.92–2.29)
2.38 (0.80–7.09)
0.54 (0.22–1.34)
1.05 (0.53–2.11)
0.75 (0.28–2.00)
0.96 (0.62–1.49) 16.17
23.58
40.33
19.91
100.00 10.99
22.30
36.54
30.17
100.00 14.39
23.47
34.03
28.12
100.00 Study
A B
C D
ID
Note: weights are from random-effects analysis
HR (95% CI)
MSSmut/MSSwt MSIwt/MSSwt
MSImut/MSIwt MSImut/MSSmut
% Weight
Study
ID HR (95% CI)
% Weight
Study
0.1 1 10 0.1 1 10
0.1 1 10 0.1 1 10
ID HR (95% CI)
% Weight
Study
ID HR (95% CI)
% Weight Overall (I2
=60.4%, P=5.554E-02; Test of HR, Z=2.07, P=3.845E-02)
Venderbosch et al (2014)70
—CAIRO
Venderbosch et al (2014)70—CAIRO2
Venderbosch et al (2014)70—COIN
Venderbosch et al (2014)70
—FOCUS Venderbosch et al (2014)70
—CAIRO
Venderbosch et al (2014)70—CAIRO2
Venderbosch et al (2014)70—COIN
Venderbosch et al (2014)70
—FOCUS
Note: weights are from random-effects analysis Overall (I2
=52.5%, P=9.704E-02;
Test of HR, Z=0.16, P=8.729E-01) Overall (I
2
=33.7%, P=2.096E-01; Test of HR, Z=0.19, P=8.493E-01) Venderbosch et al (2014)70
—CAIRO
Venderbosch et al (2014)70—CAIRO2
Venderbosch et al (2014)70—COIN
Venderbosch et al (2014)70
—FOCUS
Venderbosch et al (2014)70—CAIRO
Venderbosch et al (2014)70
—CAIRO2
Venderbosch et al (2014)70—COIN
Venderbosch et al (2014)70—FOCUS
Note: weights are from random-effects analysis Overall (I2=58.3%, P=6.579E-02; Test of HR, Z=1.60, P=1.096E-01)
stage I–III, whose results were similar with the overall results, MSI showed poor effects on OS in BRAF wild-type patients (MSI/BRAFwt vs MSS/BRAFwt: N=6, HR = 1.493, 95% CI
= 1.187–1.879, P=6.262E-04), and no significant effects in
BRAF-mutated patients (MSI/BRAFmut vs MSS/BRAFmut:
N=5, HR = 1.143, 95% CI = 0.789–1.655, P=4.839E-01; Table 4). In the subgroup of first-line chemotherapy–treated stage IV CRCs, BRAF mutation was a poor factor for OS in MSS patients (MSS/BRAFmut vs MSS/BRAFwt: N=4, HR
= 1.981, 95% CI = 1.606–2.444, P=9.963E-10) and MSI had no prognostic effects on OS in BRAF-mutated or BRAF wild-type patients (Table 4). As both MSI and BRAF mutation were correlated with proximal/right-sided CC compared with other CRCs, subgroup analysis according to the tumor location was necessary. However, the data from the included studies were not sufficient to support the subgroup analysis. Instead, we
Cancer Management and Research downloaded from https://www.dovepress.com/ by 118.70.13.36 on 20-Aug-2020
Dovepress Prognostic value of MSI/BRAF mutation status in CRC
Figure 5 Forest plot for Msi/BRAF mutation status and Os in colorectal cancer.
Notes: The colorectal cancer was divided into four subtypes according to the combination of Msi and BRAF mutation, ie, Msswt, Mssmut, Msiwt, and Msimut. Os was compared between Mssmut and Msswt (A), Msimut and Msiwt (B), Msimut and Mssmut (C), Msiwt and Msswt (D), Msimut and Msswt (E), and Msiwt and Mssmut (F) by pooling the previous studies.
Abbreviations: Msi, microsatellite instability; Msimut, microsatellite instability and BRAF mutation; Msiwt, microsatellite instability and BRAF wild type; Mssmut, microsatellite stable and BRAF mutation; Msswt, microsatellite stable and BRAF wild type; Os, overall survival.
Cancer Management and Research downloaded from https://www.dovepress.com/ by 118.70.13.36 on 20-Aug-2020
Dovepress Yang et al
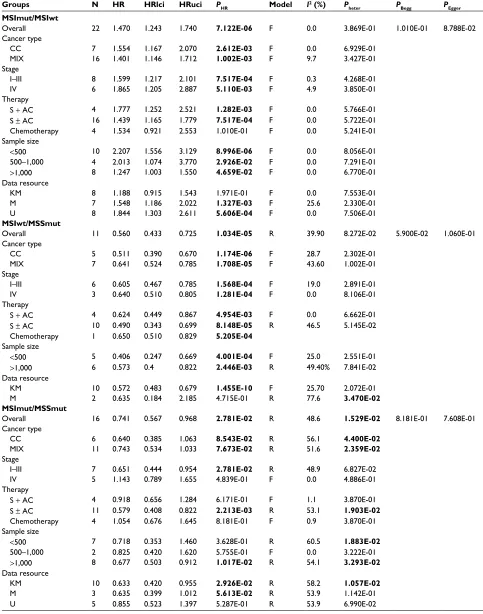
Table 4 Meta-analysis results for associations of Msi/BRAF mutation status with Os in colorectal cancer
Groups N HR HRlci HRuci PHR Model I2 (%) P
heter PBegg PEgger
MSSmut/MSSwt
Overall 25 2.018 1.706 2.388 2.220E-16 R 71.3 1.681E-08 2.937e-01 3.369e-01
Cancer type
CC 10 2.104 1.584 2.795 2.747E-07 R 77.6 6.932E-06
MiX 17 1.913 1.561 2.344 3.850E-10 R 66.7 4.565E-05
stage
i–iii 12 2.047 1.623 2.582 1.448E-09 R 61.9 2.352E-03
iV 8 2.180 1.844 2.578 0.000e+00 F 0.0 4.341e-01
Therapy
s + aC 7 2.000 1.488 2.687 4.225E-06 R 63.3 1.200E-02
s ± aC 21 2.112 1.701 2.624 1.380E-11 R 73.5 2.391E-08
Chemotherapy 4 1.981 1.606 2.444 9.963E-10 F 5.7% 3.640e-01
sample size
<500 9 2.515 1.805 3.505 5.037E-08 R 51.2% 3.713E-02
500–1,000 8 1.856 1.415 2.432 7.464E-06 R 56.5% 2.431E-02
>1,000 9 1.933 1.472 2.540 2.137E-06 R 82.9% 1.681E-07
Data resource
KM 6 3.213 2.728 3.783 0.000e+00 F 20.5% 2.790e-01
M 14 1.668 1.389 2.002 4.253E-08 R 49.2% 1.923E-02
U 7 1.702 1.489 1.946 6.217E-15 F 15.2% 3.144e-01
MSIwt/MSSwt
Overall 17 0.996 0.801 1.24 9.761e-01 R 69.0 1.247E-05 9.045e-01 3.712e-01
Cancer type
CC 6 0.999 0.677 1.475 9.970e-01 R 74.9 1.272E-03
MiX 12 1.018 0.785 1.322 8.887e-01 R 65.4 8.364E-04
stage
i–iii 6 0.912 0.589 1.412 6.818e-01 R 73.2 2.214E-03
iV 6 1.493 1.187 1.879 6.262E-04 F 40.5 1.350e-01
Therapy
s + aC 5 0.912 0.511 1.628 7.566e-01 R 77.5 1.369E-03
s ± aC 11 0.979 0.763 1.255 8.650e-01 R 57.2 9.493E-03
Chemotherapy 4 1.242 0.779 1.979 3.628e-01 R 53.3 9.246e-02
sample size
<500 5 1.321 0.981 1.779 6.577e-02 F 28.4 2.319e-01
500–1,000 4 0.904 0.669 1.223 5.157e-01 F 11.5 3.353e-01
>1,000 8 1.023 0.719 1.456 8.966e-01 R 81.4 3.425E-06
Data resource
KM 7 1.388 1.168 1.650 1.992E-04 F 17.4 2.966e-01
M 7 0.878 0.614 1.256 4.777e-01 R 75.2 4.737E-04
U 4 0.742 0.546 1.008 5.613e-02 F 9.2 3.476e-01
MSImut/MSSwt
Overall 13 1.324 0.938 1.868 1.096e-01 R 88.2 2.766E-16 8.572e-01 9.922e-01
Cancer type
CC 5 1.289 0.810 2.051 2.846e-01 R 72.8 5.389E-03
MiX 9 1.346 0.878 2.064 1.738e-01 R 90.6 5.235E-15
stage
i–iii 6 1.623 0.999 2.637 5.000E-02 R 74.1 1.697E-03
iV 2 2.634 1.232 5.633 1.242E-02 R 91.8 4.909E-04
Therapy
s + aC 3 1.669 0.919 3.031 9.296e-02 R 66.4 5.079e-02
s ± aC 10 1.196 0.829 1.727 3.371e-01 R 80.5 5.600E-07
Chemotherapy 1 1.800 1.371 2.362 2.235E-05
sample size
<500 4 2.551 1.009 6.447 4.770E-02 R 85.4 1.305E-04
500–1,000 3 1.185 0.684 2.055 5.485e-01 R 79.9 6.874E-03
>1,000 6 1.090 0.715 1.663 6.892e-01 R 85.1 2.782E-06
Data resource
KM 8 1.907 1.255 2.898 2.528E-03 R 87.1 1.916E-09
M 6 0.849 0.713 1.010 6.431e-02 F 0.0 5.365e-01
(Continued)
Cancer Management and Research downloaded from https://www.dovepress.com/ by 118.70.13.36 on 20-Aug-2020
Dovepress Prognostic value of MSI/BRAF mutation status in CRC
Groups N HR HRlci HRuci PHR Model I2 (%) Pheter PBegg PEgger
MSImut/MSIwt
Overall 22 1.470 1.243 1.740 7.122E-06 F 0.0 3.869e-01 1.010e-01 8.788e-02
Cancer type
CC 7 1.554 1.167 2.070 2.612E-03 F 0.0 6.929e-01
MiX 16 1.401 1.146 1.712 1.002E-03 F 9.7 3.427e-01
stage
i–iii 8 1.599 1.217 2.101 7.517E-04 F 0.3 4.268e-01
iV 6 1.865 1.205 2.887 5.110E-03 F 4.9 3.850e-01
Therapy
s + aC 4 1.777 1.252 2.521 1.282E-03 F 0.0 5.766e-01
s ± aC 16 1.439 1.165 1.779 7.517E-04 F 0.0 5.722e-01
Chemotherapy 4 1.534 0.921 2.553 1.010e-01 F 0.0 5.241e-01
sample size
<500 10 2.207 1.556 3.129 8.996E-06 F 0.0 8.056e-01
500–1,000 4 2.013 1.074 3.770 2.926E-02 F 0.0 7.291e-01
>1,000 8 1.247 1.003 1.550 4.659E-02 F 0.0 6.770e-01
Data resource
KM 8 1.188 0.915 1.543 1.971e-01 F 0.0 7.553e-01
M 7 1.548 1.186 2.022 1.327E-03 F 25.6 2.330e-01
U 8 1.844 1.303 2.611 5.606E-04 F 0.0 7.506e-01
MSIwt/MSSmut
Overall 11 0.560 0.433 0.725 1.034E-05 R 39.90 8.272e-02 5.900e-02 1.060e-01
Cancer type
CC 5 0.511 0.390 0.670 1.174E-06 F 28.7 2.302e-01
MiX 7 0.641 0.524 0.785 1.708E-05 F 43.60 1.002e-01
stage
i–iii 6 0.605 0.467 0.785 1.568E-04 F 19.0 2.891e-01
iV 3 0.640 0.510 0.805 1.281E-04 F 0.0 8.106e-01
Therapy
s + aC 4 0.624 0.449 0.867 4.954E-03 F 0.0 6.662e-01
s ± aC 10 0.490 0.343 0.699 8.148E-05 R 46.5 5.145e-02
Chemotherapy 1 0.650 0.510 0.829 5.205E-04
sample size
<500 5 0.406 0.247 0.669 4.001E-04 F 25.0 2.551e-01
>1,000 6 0.573 0.4 0.822 2.446E-03 R 49.40% 7.841e-02
Data resource
KM 10 0.572 0.483 0.679 1.455E-10 F 25.70 2.072e-01
M 2 0.635 0.184 2.185 4.715e-01 R 77.6 3.470E-02
MSImut/MSSmut
Overall 16 0.741 0.567 0.968 2.781E-02 R 48.6 1.529E-02 8.181e-01 7.608e-01
Cancer type
CC 6 0.640 0.385 1.063 8.543E-02 R 56.1 4.400E-02
MiX 11 0.743 0.534 1.033 7.673E-02 R 51.6 2.359E-02
stage
i–iii 7 0.651 0.444 0.954 2.781E-02 R 48.9 6.827e-02
iV 5 1.143 0.789 1.655 4.839e-01 F 0.0 4.886e-01
Therapy
s + aC 4 0.918 0.656 1.284 6.171e-01 F 1.1 3.870e-01
s ± aC 11 0.579 0.408 0.822 2.213E-03 R 53.1 1.903E-02
Chemotherapy 4 1.054 0.676 1.645 8.181e-01 F 0.9 3.870e-01
sample size
<500 7 0.718 0.353 1.460 3.628e-01 R 60.5 1.883E-02
500–1,000 2 0.825 0.420 1.620 5.755e-01 F 0.0 3.222e-01
>1,000 8 0.677 0.503 0.912 1.017E-02 R 54.1 3.293E-02
Data resource
KM 10 0.633 0.420 0.955 2.926E-02 R 58.2 1.057E-02
M 3 0.635 0.399 1.012 5.613E-02 R 53.9 1.142e-01
U 5 0.855 0.523 1.397 5.287e-01 R 53.9 6.990e-02
Note: Bold, statistically significant.
Abbreviations: aC, adjuvant chemotherapy; CC, colon cancer; M, hR was obtained from multivariate analysis; MiX, the studies included both CC and rectal cancer and results of which could not be separated; KM, hR was obtained indirectly from Kaplan–Meier plot curves; Msi, microsatellite instability; Msimut, microsatellite instability and
BRAF mutation; Msiwt, microsatellite instability and BRAF wild type; Mssmut, microsatellite stable and BRAF mutation; Msswt, microsatellite stable and BRAF wild type; RFs,
recurrence free survival; S, surgery; U, HR was obtained from univariate analysis; R, random-effects model; F, fixed-effects model.
Table 4 (Continued)
Cancer Management and Research downloaded from https://www.dovepress.com/ by 118.70.13.36 on 20-Aug-2020
Dovepress Yang et al
analyzed the influence of prevalence of proximal/right-sided cancer on the associations in comparisons of different MSI/
BRAF mutation subtypes by meta-analysis regression and no
significant result was found (Table S1).
heterogeneity, publication bias, and
sensitivity analysis
For RFS, no heterogeneity was found by all comparisons (Table 3). For PFS, heterogeneity was found in comparing MSS/BRAFwt with MSI/BRAFwt and MSI/BRAFmut and in comparing MSI/BRAFwt with MSI/BRAFmut. When evaluating the associations of OS with MSI/BRAF mutation status, heterogeneity existed in all analyses overall except for the comparison of MSI/BRAFmut with MSI/BRAFwt (Table 4). During comparison of MSS/BRAFmut with MSS/
BRAFwt, heterogeneity reduced to no significance in
sub-groups of stage IV, KM, and U. During comparison of MSI/
BRAFwt with MSS/BRAFwt, heterogeneity reduced to no
significance in subgroups of stage IV, <500 cases, 500–1000 cases, KM, and U. During comparison of MSI/BRAFmut with MSS/BRAFwt, heterogeneity reduced to no significance in subgroups of M. For MSI/BRAFwt vs MSS/BRAFmut, het-erogeneity decreased in subgroups of CC, stage 1–III and IV, surgery plus adjuvant chemotherapy, <500 cases, and KM. For MSI/BRAFmut vs MSS/BRAFmut, heterogeneity reduced in subgroups of stage IV, surgery plus adjuvant chemotherapy, chemotherapy, and 500–1000 cases. Potential publication bias was first evaluated by Begg’s funnel plots. Symmetrical fun-nel plots were obtained in all analyses (Figure 6). The Egger’s test was also performed to provide the statistical evidence of publication bias, and the results did not show publication bias in all the pooling analyses (Tables 3 and 4). Finally, the sensitivity analysis was performed to examine the influence set by the individual study on the pooled HRs by deleting each study once. All the results were almost same with the overall results in all comparisons (Figure 7).
interaction of Msi and BRAF mutation
In the included studies, the prevalence of BRAF mutation in MSI cases was much higher than that in MSS cases (45.5% vs 7.1%, pooled OR = 11.247, 95% CI = 8.734–14.482,
P=0.000E+00), suggesting a significant association of MSI with BRAF mutation in CRC, which promoted us to investi-gate the interaction of MSI and BRAF mutation when evaluat-ing the associations of MSI/BRAF mutation status with OS in CRC. Meta-analysis regression suggested that MSI did not influence the association of BRAF mutation with OS in CRC (coefficient = −0.041, Z=−0.290, P=7.718E-01; Table 5), and
BRAF mutation did not influence the association of MSI with
OS in CRC (coefficient = −0.239, Z=−0.770, P=4.413E-01; Table 5). Test of interaction was performed according to the method suggested in the previous report,31 and no interaction
of MSI with BRAF mutation was observed.
Discussion
CRC is a heterogeneous disease and presents significant difference in clinical presentation, prognosis, and treatment response, even at the same pathological stage. Additional molecular biomarkers such as MSI and BRAF mutation have been mostly investigated to classify CRC into intrinsic subtypes and predict the therapy response and prognosis.6–9
However, due to the opposing effects between MSI and BRAF mutation in general, whether the concomitant evaluation of both MSI and BRAF status provides an additive or subtractive effect on patient outcome is not conclusive and consistent.
The previous studies suggested that the frequencies of MSI and BRAF mutation in CRC were ~15% and 14%, respectively.14,15,77 In the present study, of the 24,067 cases,
11.9% cases were with MSI phenotype and 11.6% cases with
BRAF mutation, a little smaller than that in the previously
reported study.21 The prevalence of BRAF mutation in MSI
cases was much higher than that in MSS cases. However, the frequency of MSI or BRAF mutation in individual stud-ies ranged drastically (MSI: 1.5%–22.6%; BRAF mutation: 3.0%–24.3%), which might be due to the diversity of the included CRC patients and different detection methods for the molecular biomarkers.
Currently, several meta-analyses studies have been per-formed to investigate the prognostic value of MSI or BRAF mutation in CRC. Gkekas et al78 have pooled 19 studies
containing 5,998 cases and found no significant associa-tion of MSI with OS (HR = 0.73, 95% CI = 0.33–1.65) and disease-free survival (DFS; HR = 0.60, 95% CI = 0.27–1.32) in stage II CC. In 2012, Safaee Ardekani et al79 combined
26 studies including 11,773 patients and found that BRAF mutation was significantly associated with OS in CRC (HR
= 2.25, 95% CI = 1.82–2.83). Multiple meta-analyses were performed in mCRC to explore the associations of BRAF mutation with prognosis and achieved consistent results that
BRAF mutation was significantly associated with shorter
PFS and OS.80–84 In stage II–III CRC treated with surgery
and adjuvant therapy, BRAF mutation was also found to be associated with shorter OS and DFS.85 However, there was
no meta-analysis study summarizing the prognosis of the CRC patients with different subtypes defined by MSI and
BRAF mutation, ie, MSS/BRAFwt, MSS/BRAFmut, MSI/
Cancer Management and Research downloaded from https://www.dovepress.com/ by 118.70.13.36 on 20-Aug-2020
Dovepress Prognostic value of MSI/BRAF mutation status in CRC
Figure 6 Begg’s funnel plot for the publication bias analysis for associations of Msi/BRAF mutation status with Os in colorectal cancer.
Notes: The colorectal cancer was divided into four subtypes according to the combination of Msi and BRAF mutation, ie, Msswt, Mssmut, Msiwt, and Msimut. Potential publication bias was explored by Begg’s funnel plots for Os comparison between Mssmut and Msswt (A), Msiwt and Msswt (B), Msimut and Msswt (C), Msimut and Msiwt (D), Msiwt and Mssmut (E), and Msimut and Mssmut (F).
Abbreviations: Msi, microsatellite instability; Msimut, microsatellite instability and BRAF mutation; Msiwt, microsatellite instability and BRAF wild type; Mssmut, microsatellite stable and BRAF mutation; Msswt, microsatellite stable and BRAF wild type; Os, overall survival.
Begg's funnel plot with pseudo 95% CI
MSSmut/MSSwt MSIwt/MSSwt
MSImut/MSSwt MSImut/MSIwt
MSIwt/MSSmut MSImut/MSIwt
Begg's funnel plot with pseudo 95% CI
Begg's funnel plot with pseudo 95% CI Begg's funnel plot with pseudo 95% CI
Begg's funnel plot with pseudo 95% CI Begg's funnel plot with pseudo 95% CI 2
A
C D
E F
B
1
log [HR]
0
–1
2
1
log [HR] 0
–1
–2 0
0 –2
0 2 4
log [HR]
–2 0 2 4
log [HR]
0.5 1 1.5 0 0.5 1
0.2
SE of log[HR]
SE of log[HR] SE of log[HR]
0.4 0.6 0 0.2
SE of log[HR]0.4 0.6 0.8
2
1
log [HR]
0
–1
2
1
log [HR]
0
–1
–2
0 0.5
SE of log[HR] 1 0 0.2 SE of log[HR]0.4 0.6 0.8
Cancer Management and Research downloaded from https://www.dovepress.com/ by 118.70.13.36 on 20-Aug-2020
Dovepress Yang et al
Table 5 Influence of MSI on the association of BRAF mutation with Os in colorectal cancer was analyzed by meta-analysis regression
and test of interaction
Comparison Covariate/ stratification
Meta-analysis regression Test of interaction
Coef Z P T P
BRAFmut/wt Msi –0.041 –0.290 7.718e-01 –0.304 7.639e-01
Msi/Mss BRAF mutation –0.239 –0.770 4.413e-01 –0.725 4.850e-01
Note: The test of interaction was performed according to the report by altman and Bland.31
Figure 7 sensitivity analyses for publication bias analysis for associations of Msi/BRAF mutation status with Os in colorectal cancer.
Notes: The colorectal cancer was divided into four subtypes according to the combination of Msi and BRAF mutation, ie, Msswt, Mssmut, Msiwt, and Msimut. sensitivity analyses were performed for Os comparison between Mssmut and Msswt (A), Msiwt and Msswt (B), Msimut and Msswt (C), Msimut and Msiwt (D), Msiwt and Mssmut (E), and Msimut and Mssmut (F).
Abbreviations: Msi, microsatellite instability; Msimut, microsatellite instability and BRAF mutation; Msiwt, microsatellite instability and BRAF wild type; Mssmut, microsatellite stable and BRAF mutation; Msswt, microsatellite stable and BRAF wild type; Os, overall survival.
Cancer Management and Research downloaded from https://www.dovepress.com/ by 118.70.13.36 on 20-Aug-2020
Dovepress Prognostic value of MSI/BRAF mutation status in CRC
BRAFwt, and MSI/BRAFmut. In the present study, our results
suggested that BRAF mutation was associated with shorter OS in both MSS CRC patients and MSI CRC patients overall and in all subgroups stratified by cancer type, tumor stage, and treatment, which were similar with the prognostic value of BRAF mutation in entire CRC and mCRC.79–84 Similar to
the previous results, we also found the poor prognostic effects of BRAF mutation in both MSS and MSI CRC treated with surgery and adjuvant therapy, and MSI did not change the poor effect of BRAF mutation.85 Our results also revealed
that MSI was not associated with OS in BRAFwt patents with CRC overall or in stage I–III CRC, similar to the study by Gkekas et al78 performed in stage II CC regardless of BRAF
mutation. In contrast, MSI was a favorable factor for OS in
BRAF-mutated CRC patients. On the basis of the previous
reports and our results, we speculated that the effect of BRAF mutation was bigger than that of MSI. To predict prognosis, CRC should be stratified by BRAF mutation first (Figure 8A). MSS/BRAFmut was a poor prognostic factor, while MSS/
BRAFwt and MSI/BRAFwt were comparable and favorable
Figure 8 CRC stratification and prognosis comparison according to MSI and BRAF mutation status.
Note: (A) Overall, (B) stage i–iii CRC, and (C) stage iV CRC.
Abbreviations: CRC, colorectal cancer; Msi, microsatellite instability; Msi/BRAFmut, microsatellite instability and BRAF mutation; Msi/BRAFwt, microsatellite instability and
BRAF wild type; Mss/BRAFmut, microsatellite stable and BRAF mutation; Mss/BRAFwt, microsatellite stable and BRAF wild type.
BRAF mutation status Overall
Stage IV
Stage I–III
A
C
B
Poor
Poorer Poor
Favorable
Comparable
Poor
Poorer Poor
Favorable
Comparable
BRAF V600E
MSS/BRAFmut MSI/BRAFmut MSI/BRAFwt MSI/BRAFwt MSS/BRAFmut MSI/BRAFmut MSS/BRAFwt MSI/BRAFwt
HR = 1,350, P = 2.781E-02
HR = 1,930, P = 0.000E+00
HR = 1.786, P = 1.034E-05
N = 16 N = 13
N = 22
N = 25
N = 5 N = 3
N = 8
N = 2 N = 6
N = 6 N = 11
N = 17 N = 7 N = 6
N = 8
N = 12
N = 6
N = 6
HR = 1,324, P = 1.096E-01 HR = 1,004, P = 9.761E-01 HR = 1.536, P = 2.781E-02
HR = 1.599, P = 7.517E-04
HR = 1,623, P = 5.00E-02 HR = 1,096, P = 6.818E-01
HR = 1.653, P = 1.568E-04
HR = 2.047, P = 1.448E-09
HR = 1,470, P = 7.122E-06
BRAF wild type
BRAF mutation status
Poor
Comparable
Favorable
Favorable More favorable
BRAF V600E
MSS/BRAFmut MSI/BRAFmut MSI/BRAFwt MSS/BRAFwt
HR = 1,143, P = 4.839E-01
HR = 1.865, P = 5.110E-03
HR = 2.634, P = 1.242E-02
HR = 1.563, P = 1.281E-04
HR = 2.180, P = 0.000E-00
HR = 1,493, P = 6.262E-04
BRAF wild type
BRAF mutation status
BRAF V600E BRAF wild type
Cancer Management and Research downloaded from https://www.dovepress.com/ by 118.70.13.36 on 20-Aug-2020
Dovepress Yang et al
and MSI/BRAFmut was moderate in CRC. Almost the same results were observed in all subgroup analyses except in the subgroup of stage IV CRC (Figure 8B and C and Table 4). In the subgroup of stage IV, unlike the subgroup of stage I–III, MSI showed poor effects on OS in BRAF wild-type patients (Figure 8C and Table 4). This might be not consistent with the current knowledge that MSI status did not affect the prognosis in mCRC. Due to the limited included studies of mCRC, the results for MSI might be not stable. Thus, we screened the published literature reporting the prognostic value of MSI status in mCRC regardless of BRAF mutations. After pooling the crude HRs from 20 primary studies, we did not find significant associations of MSI with OS in CRC. However, when stratifying by the frequency of MSI, we found that MSI was a poor factor for OS in the subgroup with low frequency of MSI, while MSI was a favorable factor for OS in the subgroup with high frequency of MSI (data not shown). We speculated that the prognostic value of MSI in mCRC was affected by the detected frequency of MSI.
Although we pooled all the potential studies with big sample size and high methodological quality, some con-clusions in the present studies should be treated carefully. First, although we performed subgroup analysis accord-ing to the cancer type, stage, and therapy, other tumor characteristics such as vascular invasion, tumor differen-tiation, and tumor budding in localized CRC and ECOG performance status and number of organs in mCRC were not analyzed due to the rare original data in the primary studies. Second, crude HRs were obtained by different methods, such as univariate and multivariate analyses and Kaplan–Meier plot curve, especially for HRs calculated from Kaplan–Meier plot curve, which might deviate from the “real” HRs derived from original data. All these dif-ferences might bring unreliability to the conclusions of the present meta-analysis. Thus, further well-designed studies with larger sample size and detailed clinical characteristics and treatments should be conducted to confirm the results and avoid potential biases.
In summary, we got a comprehensive result from the cur-rent meta-analysis that among the four subtypes according to MSI and BRAF mutation in CRC, MSS/BRAFmut was a poor prognostic factor, while MSS/BRAFwt and MSI/BRAFwt were comparable and favorable and MSI/BRAFmut was moderate in overall and stage I–III CRC. In stage IV CRC, especially those with BRAF wt, MSI played an unfavorable role in prognosis. The results suggested that the combina-tion of MSI and BRAF could predict prognosis in CRC and facilitated the planning of individualized treatment strategies,
thereby improving the prognosis in the CRC patients with more aggressive genetic background.
Acknowledgment
This study was supported by Beijing Municipal Administra-tion of Hospitals Clinical Medicine Development of Special Funding Support (ZYLX201504) and Capital Foundation of Medical Developments (Z20150405090022).
Disclosure
The authors report no conflicts of interest in this work.
References
1. Jemal A, Siegel R, Ward E, et al. Cancer Statistics, 2008. CA: A Cancer Journal for Clinicians. 2008;58(2):71–96.
2. Samadder NJ, Vierkant RA, Tillmans LS, et al. Associations Between Colorectal Cancer Molecular Markers and Pathways With Clinicopathologic Features in Older Women. Gastroenterology. 2013;145356(2):348e341–356. 3. Phipps AI, Limburg PJ, Baron JA, et al. Association Between Molecular Subtypes of Colorectal Cancer and Patient Survival. Gastroenterology. 2015;14887(1):77–87.
4. Gunderson LL, Jessup JM, Sargent DJ, Greene FL, Stewart AK. Revised TN Categorization for Colon Cancer Based on National Survival Outcomes Data. Journal of Clinical Oncology. 2010;28(2): 264–271.
5. Ross JS, Torres-Mora J, Wagle N, Jennings TA, Jones DM. Biomarker-Based Prediction of Response to Therapy for Colorectal Cancer. Am J Clin Pathol. 2010;134(3):478–490.
6. Bosman FT, Yan P. Molecular pathology of colorectal cancer. Polish Journal of Pathology. 2014;4(4):257–266.
7. Lochhead P, Kuchiba A, Imamura Y, et al. Microsatellite Instability and BRAF Mutation Testing in Colorectal Cancer Prognostication. JNCI: Journal of the National Cancer Institute. 2013;105(15): 1151–1156.
8. Phipps AI, Limburg PJ, Baron JA, et al. Association Between Molecular Subtypes of Colorectal Cancer and Patient Survival. Gastroenterology. 2015;148(1):77–87.
9. Stachler MD, Rinehart E, Lindeman N, Odze R, Srivastava A. Novel molecular insights from routine genotyping of colorectal carcinomas. Hum Pathol. 2015;46(4):507–513.
10. Boland CR, Goel A. Microsatellite Instability in Colorectal Cancer. Gastroenterology. 2010;138(6):e2073:2073–2087.
11. Yamamoto H, Imai K. Microsatellite instability: an update. Arch Toxicol. 2015;89(6):899–921.
12. Peltomaki P, Lothe RA, Aaltonen LA, et al. Microsatellite instability is associated with tumors that characterize the hereditary non-polyposis colorectal carcinoma syndrome. Cancer Res. 1993;53(24):5853–5855. 13. Herman JG, Umar A, Polyak K, et al. Incidence and functional conse-quences of hMLH1 promoter hypermethylation in colorectal carcinoma. Proceedings of the National Academy of Sciences. 1998;95(12):6870–6875. 14. Bertagnolli MM, Niedzwiecki D, Compton CC, et al. Microsatellite
Instability Predicts Improved Response to Adjuvant Therapy With Irinotecan, Fluorouracil, and Leucovorin in Stage III Colon Cancer: Cancer and Leukemia Group B Protocol 89803. Journal of Clinical Oncology. 2009;27(11):1814–1821.
15. Sargent DJ, Marsoni S, Monges G, et al. Defective Mismatch Repair As a Predictive Marker for Lack of Efficacy of Fluorouracil-Based Adjuvant Therapy in Colon Cancer. Journal of Clinical Oncology. 2010;28(20):3219–3226.
16. Popat S, Hubner R, Houlston RS. Systematic Review of Microsatel-lite Instability and Colorectal Cancer Prognosis. Journal of Clinical Oncology. 2005;23(3):609–618.
Cancer Management and Research downloaded from https://www.dovepress.com/ by 118.70.13.36 on 20-Aug-2020
Dovepress Prognostic value of MSI/BRAF mutation status in CRC
17. Davies H, Bignell GR, Cox C, et al. Mutations of the BRAF gene in human cancer. Nature. 2002;417(6892):949–954.
18. Rajagopalan H, Bardelli A, Lengauer C, Kinzler KW, Vogelstein B, Velculescu VE. RAF/RAS oncogenes and mismatch-repair status. Nature. 2002;418(6901):934.
19. Peyssonnaux C, Eychène A. The Raf/MEK/ERK pathway: new concepts of activation. Biol Cell. 2001;93(1-2):53–62.
20. Zheng G, Tseng L-H, Chen G, et al. Clinical detection and categoriza-tion of uncommon and concomitant mutacategoriza-tions involving BRAF. BMC Cancer. 2015;15(1):779.
21. Chen D, Huang J-F, Liu K, et al. BRAFV600E Mutation and Its Asso-ciation with Clinicopathological Features of Colorectal Cancer: A Systematic Review and Meta-Analysis. PLoS One. 2014;9(3):e90607. 22. Phipps AI, Buchanan DD, Makar KW, et al. BRAF Mutation Status and Survival after Colorectal Cancer Diagnosis According to Patient and Tumor Characteristics. Cancer Epidemiology Biomarkers & Prevention. 2012;21(10):1792–1798.
23. Samowitz WS, Sweeney C, Herrick J, et al. Poor Survival Associated with the BRAF V600E Mutation in Microsatellite-Stable Colon Cancers. Cancer Res. 2005;65(14):6063–6069.
24. Ogino S, Shima K, Meyerhardt JA, et al. Predictive and Prognostic Roles of BRAF Mutation in Stage III Colon Cancer: Results from Intergroup Trial CALGB 89803. Clinical Cancer Research. 2012;18(3):890–900. 25. Gavin PG, Colangelo LH, Fumagalli D, et al. Mutation Profiling and
Microsatellite Instability in Stage II and III Colon Cancer: An Assess-ment of Their Prognostic and Oxaliplatin Predictive Value. Clinical Cancer Research. 2012;18(23):6531–6541.
26. Hamilton SR. BRAF Mutation and Microsatellite Instability Status in Colonic and Rectal Carcinoma: Context Really Does Matter. JNCI Journal of the National Cancer Institute. 2013;105(15):1075–1077. 27. Tierney JF, Stewart LA, Ghersi D, Burdett S, Sydes MR. Practical
meth-ods for incorporating summary time-to-event data into meta-analysis. Trials. 2007;8(1):16.
28. Dersimonian R, Laird N, N. L. Meta-analysis in clinical trials. Control Clin Trials. 1986;7(3):177–188.
29. Begg CB, Mazumdar M. Operating Characteristics of a Rank Correla-tion Test for PublicaCorrela-tion Bias. Biometrics. 1994;50(4):1088–1101. 30. Egger M, Smith GD, Schneider M, Minder C. Bias in meta-analysis
detected by a simple, graphical test. BMJ. 1997;315(7109):629–634. 31. Altman DG, Bland JM. Statistics Notes: Interaction revisited: the
dif-ference between two estimates. BMJ. 2003;326(7382):219.
32. Y-J L, Wang P, Peng J, Wang X, Y-W Z, Shen N. Meta-analysis Reveals the Prognostic Value of Circulating Tumour Cells Detected in the Peripheral Blood in Patients with Non-Metastatic Colorectal Cancer. Scientific Reports. 2017;7(1):905.
33. Fariña-Sarasqueta A, van Lijnschoten G, Moerland E, et al. The BRAF V600E mutation is an independent prognostic factor for survival in stage II and stage III colon cancer patients. Annals of Oncology. 2010;21(12):2396–2402.
34. Fariña-Sarasqueta A, van Lijnschoten G, Moerland E, et al. The BRAF V600E mutation is an independent prognostic factor for survival in stage II and stage III colon cancer patients. Annals of Oncology. 2010;21(12):2396–2402.
35. Popovici V, Budinska E, Bosman FT, Tejpar S, Roth AD, Delorenzi M. Context-dependent interpretation of the prognostic value of BRAF and KRAS mutations in colorectal cancer. BMC Cancer. 2013;13(1). 36. Tie J, Gibbs P, Lipton L, et al. Optimizing targeted therapeutic
devel-opment: Analysis of a colorectal cancer patient population with the BRAFV600E mutation. Int J Cancer. 2011;128(9):2075–2084. 37. Goldstein J, Tran B, Ensor J, et al. Multicenter retrospective analysis
of metastatic colorectal cancer (CRC) with high-level microsatellite instability (MSI-H. Annals of Oncology. 2014;25(5):1032–1038. 38. Dienstmann R, Mason MJ, Sinicrope FA, et al. Prediction of
over-all survival in stage II and III colon cancer beyond TNM system: a retrospective, pooled biomarker study. Annals of Oncology. 2017;28(5):1023–1031.
39. Ogino S, Nosho K, Kirkner GJ, et al. CpG island methylator phenotype, microsatellite instability, BRAF mutation and clinical outcome in colon cancer. Gut. 2009;58(1):90–96.
40. Kadowaki Set al. Prognostic value of KRAS and BRAF mutations in curatively resected colorectal cancer. World J Gastroenterol. 2015;21(4):1275–1283.
41. Smith CG, Fisher D, Claes B, et al. Somatic Profiling of the Epider-mal Growth Factor Receptor Pathway in Tumors from Patients with Advanced Colorectal Cancer Treated with Chemotherapy Cetuximab. Clinical Cancer Research. 2013;19(15):4104–4113.
42. Chan JCY, Chan DL, Diakos CI, et al. The Lymphocyte-to-Monocyte Ratio is a Superior Predictor of Overall Survival in Comparison to Established Biomarkers of Resectable Colorectal Cancer. Ann Surg. 2017;265(3):539–546.
43. Taieb J, Zaanan A, Le Malicot K, et al. Prognostic Effect of BRAF and KRAS Mutations in Patients With Stage III Colon Cancer Treated With Leucovorin, Fluorouracil, and Oxaliplatin With or Without Cetuximab. JAMA Oncol. 2016;2(5):643–652.
44. Pai RK, Jayachandran P, Koong AC, et al. BRAF-mutated, Microsat-ellite-stable Adenocarcinoma of the Proximal Colon: An Aggressive Adenocarcinoma With Poor Survival, Mucinous Differentiation, and Adverse Morphologic Features. Am J Surg Pathol. 2012;36(5): 744–752.
45. Kakar S, Deng C, Sahai V, et al. Clinicopathologic characteristics, CpG island methylator phenotype, and BRAF mutations in microsatellite-stable colorectal cancers without chromosomal instability. Archives of Pathology and Laboratory Medicine. 2008;132(6):958–964. 46. Umeda Y, Nagasaka T, Mori Y, et al. Poor prognosis of KRAS or BRAF
mutant colorectal liver metastasis without microsatellite instability. J Hepatobiliary Pancreat Sci. 2013;20(2):223–233.
47. Khan SA, Morris M, Idrees K, et al. Colorectal cancer in the very young: a comparative study of tumor markers, pathology and survival in early onset and adult onset patients. J Pediatr Surg. 2016;51(11):1812–1817. 48. Shaukat A, Arain M, Thaygarajan B, Bond JH, Sawhney M. Is BRAF
Mutation Associated with Interval Colorectal Cancers? Dig Dis Sci. 2010;55(8):2352–2356.
49. Zlobec I, Kovac M, Erzberger P, et al. Combined analysis of specific KRAS mutation, BRAF and microsatellite instability identifies prog-nostic subgroups of sporadic and hereditary colorectal cancer. Int J Cancer. 2010;127(11):2569–2575.
50. Maestro ML, Vidaurreta M, Sanz-Casla MT, et al. Role of the BRAF Mutations in the Microsatellite Instability Genetic Pathway in Sporadic Colorectal Cancer. Ann Surg Oncol. 2007;14(3):1229–1236. 51. Lee S, Cho N-Y, Choi M, Yoo EJ, Kim J-H, Kang GH.
Clinicopatho-logical features of CpG island methylator phenotype-positive colorectal cancer and its adverse prognosis in relation to KRAS/BRAF mutation. Pathol Int. 2008;58(2):104–113.
52. Saridaki Z, Papadatos-Pastos D, Tzardi M, et al. BRAF mutations, mic-rosatellite instability status and cyclin D1 expression predict metastatic colorectal patients’ outcome. Br J Cancer. 2010;102(12):1762–1768. 53. Markovic S, Antic J, Dragicevic N, Hamelin R, Krivokapic Z.
High-frequency microsatellite instability and BRAF mutation (V600E) in unselected Serbian patients with colorectal cancer. J Mol Histol. 2012;43(2):137–143.
54. André T, de Gramont A, Vernerey D, et al. Adjuvant Fluorouracil, Leucovorin, and Oxaliplatin in Stage II to III Colon Cancer: Updated 10-Year Survival and Outcomes According to BRAF Mutation and Mismatch Repair Status of the MOSAIC Study. Journal of Clinical Oncology. 2015;33(35):4176–4187.
55. Nakaji Y, Oki E, Nakanishi R, et al. Prognostic value of BRAF V600E mutation and microsatellite instability in Japanese patients with sporadic colorectal cancer. J Cancer Res Clin Oncol. 2017;143(1): 151–160.
56. French AJ, Sargent DJ, Burgart LJ, et al. Prognostic Significance of Defective Mismatch Repair and BRAF V600E in Patients with Colon Cancer. Clinical Cancer Research. 2008;14(11):3408–3415.
Cancer Management and Research downloaded from https://www.dovepress.com/ by 118.70.13.36 on 20-Aug-2020