Optical Polarimetry in Undergraduate Education
Gregory Topasna1 1Virginia Military Institute
Abstract.Polarimetry plays an important part in observational astronomy, but it is all too often given limited attention in astronomy textbooks. Coupled with a sometimes confus-ing mathematical introduction, students may feel that polarization is a difficult subject best left for study at a different time, or worse, not at all. Additionally, polarimetric ob-servations and analysis are not typical exercises students are likely to engage in as part of an observational astronomy course. Over the past few years students at Virginia Military Institute have used an optical polarimeter, which was designed and constructed in-house, on the 20 cm Cassegrain telescope at the VMI Observatory to study the polarization of stars. These observations have enhanced their astronomical knowledge and allowed them the opportunity to gain valuable experience using this important technique. The subse-quent analysis of stellar polarization has led to a better understanding of the mathematics of polarization, its interpretation, and statistical treatment. In this paper I describe the design and construction of an optical polarimeter suitable for a small college observatory and outline the observing and data analysis strategies. I will also present observations that range from brief introduction exercises that can be included as part of an observational astronomy course to longer programs suitable for undergraduate research projects.
1 Introduction
Polarimetry plays an important role in astronomy. In optical astronomy, for example, polarimetry provides a wealth of information to help us understand the nature of dust grains in the interstellar medium (ISM) (their composition, distribution, and alignment with magnetic fields). Polarimetric observations of star clusters can help measure the extinction caused by dust, which in turn can lead to better estimates of not only cluster distances but can perhaps reveal distances for individual stars. To be sure, polarization measurements at other wavelengths (UV, Infrared, Radio) all contribute vi-tal information; however, the optical wavelength range is perhaps better suited as an introduction to polarimetry since students will have been exposed more to optics as part of their undergraduate ed-ucation as well as the fact that observational astronomy courses are typically geared toward optical observations.
Likewise, textbook treatment of polarization mathematics is usually introduced from a theoretical standpoint. While this may fit the pedagogical approach of any one particular textbook, its presenta-tion may not necessarily be typical of the mathematical methods used in the analysis of polarimetric observations. Similarly, understanding the statistical treatment of uncertainties is crucial and may often be overlooked. Books dedicated to the subject of polarimetery (for example [4],[10],[21]) exist
and should be consulted by anyone wishing to throughly understand the mathematics of polarization as well as the nature of polarimetric observations.
In this paper I present an overview of the optical polarimeter that was designed and constructed for use with the 0.5 meter (20 inch) telescope at the VMI Observatory. Section 2 reviews the design of the instrument with a goal toward showing how this can be a learning process for the students. In section 3 I present the basic mathematics necessary to analyze the images that are obtained. Section 4 presents three observing projects that could be utilized during an observational astronomy class or as long-term undergraduate research projects.
2 Polarimeter
A detailed description of the design and construction of the optical polarimeter used at the VMI observatory is presented by Topasna et al. [17] and should be consulted by anyone wishing to learn more about this particular instrument. Briefly presented here, however, is an overview of the design and building process to aid anyone wishing to build a similar type of polarimeter.
The VMI polarimeter is a dual-beam polarimeter. The two main optical components are a half-wave plate and Wollaston prism. The 22 mm diameter magnesium fluoride/crystalline quartz half-wave plate is from Karl Lambrecht Corporation while the Wollaston prism is from Bernhard Halle Nachfl. GmbH and has a 30 x 30 mm cross section and 0.5 degree divergence angle. Both are suitable for work in the visual range. The other optical components are the CCD camera and Johnson-Cousins
UBVRI filters.
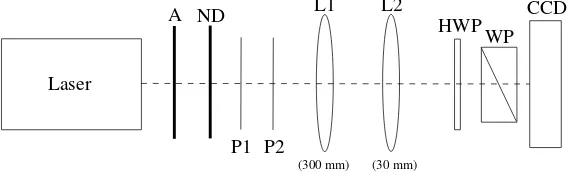
In designing the instrument it is useful to first mount the optical components on an optical bread-board as shown in Figure 1. This allows you to determine the exact position necessary for each component and it allows students the opportunity to see how the polarimeter actually works. Refer-ring to Figure 1, a laser is used to simulate the light of a star. An aperture (A) is used to reduce scattered light while a neutral density filter (ND) is used to reduce the light’s intensity. Two polarizers (P1) and (P2) are used to help further reduce the light’s intensity as well as established a preferred direction of vibration for the electric vector. Lenses (L1) and (L2) make a telescope that is used to reduce the size of the beam. Most of these optical components are found in a typical optics laboratory so there is nothing vital that needs to be specified about these components.
Laser
ND A
P1 P2
L1 L2
(300 mm) (30 mm)
HWP WP
CCD
Figure 1. Layout of the components on an optical breadboard. The individual components and their labels are explained in the text.
and should be consulted by anyone wishing to throughly understand the mathematics of polarization as well as the nature of polarimetric observations.
In this paper I present an overview of the optical polarimeter that was designed and constructed for use with the 0.5 meter (20 inch) telescope at the VMI Observatory. Section 2 reviews the design of the instrument with a goal toward showing how this can be a learning process for the students. In section 3 I present the basic mathematics necessary to analyze the images that are obtained. Section 4 presents three observing projects that could be utilized during an observational astronomy class or as long-term undergraduate research projects.
2 Polarimeter
A detailed description of the design and construction of the optical polarimeter used at the VMI observatory is presented by Topasna et al. [17] and should be consulted by anyone wishing to learn more about this particular instrument. Briefly presented here, however, is an overview of the design and building process to aid anyone wishing to build a similar type of polarimeter.
The VMI polarimeter is a dual-beam polarimeter. The two main optical components are a half-wave plate and Wollaston prism. The 22 mm diameter magnesium fluoride/crystalline quartz half-wave plate is from Karl Lambrecht Corporation while the Wollaston prism is from Bernhard Halle Nachfl. GmbH and has a 30 x 30 mm cross section and 0.5 degree divergence angle. Both are suitable for work in the visual range. The other optical components are the CCD camera and Johnson-Cousins
UBVRIfilters.
In designing the instrument it is useful to first mount the optical components on an optical bread-board as shown in Figure 1. This allows you to determine the exact position necessary for each component and it allows students the opportunity to see how the polarimeter actually works. Refer-ring to Figure 1, a laser is used to simulate the light of a star. An aperture (A) is used to reduce scattered light while a neutral density filter (ND) is used to reduce the light’s intensity. Two polarizers (P1) and (P2) are used to help further reduce the light’s intensity as well as established a preferred direction of vibration for the electric vector. Lenses (L1) and (L2) make a telescope that is used to reduce the size of the beam. Most of these optical components are found in a typical optics laboratory so there is nothing vital that needs to be specified about these components.
Laser
ND A
P1 P2
L1 L2
(300 mm) (30 mm)
HWP WP
CCD
Figure 1. Layout of the components on an optical breadboard. The individual components and their labels are explained in the text.
The half-wave plate (HWP), Wollaston prism (WP), and CCD camera (CCD) are also secured to the breadboard using proper mounts and in relative positions based on calculations using the manufac-ture’s specification for each element. Individual elements are then adjusted slightly until the desired image on the CCD is obtained. At this point final measurements are made and the design of holders
and rotation stages can proceed. While the polarimeter is still on the breadboard it is instructive to have the student operate the instrument and observe the noticeable changes in brightness of the two rays to gain a better understanding of the instrument’s operation. Images of the simulated star can then be used to practice the analysis presented in Section 3.
3 Polarization Mathematics
The mathematics needed to analyze the dual-beam polarimeter images is straightforward alge-braically. The starting point is to calculate the normalized Stokes parameters q and u, which are determined by measuring the stellar flux of the ordinary and extraordinary rays Io andIe from the CCD image (using aperture photometry, for instance). While the simplest way to determineqandu
from two rotation positionsI(θ) of the half-wave plate isq =[Ie(0◦)−Io(0◦)]/[Ie(0◦)+Io(0◦)] and u = [Ie(22.5◦)−Io(22.5◦)]/[Ie(22.5◦)+Io(22.5◦)], a better method that eliminates the instrumental polarization caused by the CCD chip’s response is to make two additional measurements with the half-wave plate set 45◦and 67.5◦and follow the procedure outlined by di Serego Alighieri [5] and compute
R2q =I o
0◦ I0e◦
Ie
45◦ I45o◦
R2u= I o
22.5◦ I22e.5◦
Ie
67.5◦ I67o.5◦
(1)
with the Stokes parameters then given byq =(Rq −1)/(Rq+1) andu =(Ru −1)/(Ru+1). While the method above will remove the inherent bias caused by the CCD chip, it does not remove the instrumental polarization caused by the telescope. In order to remove this bias, images of unpolarized standard stars (taken from the list by Serkowski [15]) are taken and their normalized Stokes parameters are determined using the procedure above and vectorially subtracted from the program stars.
Fromq and u the degree of polarization is po =
(q2+u2) and the position angle given by
θ=0.5 arctan(u/q). Through repeated measurements the uncertainties can be computed usingσp = [q2σ2q +u2σ2u]1/2/p andσθ = [q2σ2u+u2σ2q]1/2/2p2. Finally, to remove the inherent bias in the
calculation of the polarization, the Wardle-Kronberg [19] estimator p = p2
o−σ2p is the final, best estimate of the degree of polarization.
To calibrate the position angle the usual practice is to observe standard polarized stars from the list given by Serkowski [15] and then compare the known listed angle with the one you compute. Any offset can then be determined and the position angle of the electric vector is then referenced to a line of constant right ascension with the position angle increasing toward the east.
While this has been a brief review a thorough introduction to the mathematics of polarization can be found in Clark [4].
4 Projects
Having either constructed or obtained a polarimeter, there are some interesting projects that students can do that will help them understand the nature of polarization and the role it plays in astronomy. I will describe three projects that can be easily incorporated into an observational astronomy course or can be the starting point for longer undergraduate research projects.
4.1 Serkowski Relationship
p(λ)/pmax=exp[−Kln2(λmax/λ)] (2)
where pmax is the maximum degree of polarization at the wavelengthλmax. The parameter K was originally a constant, set to a value of 1.15 by Serkowski [16] but was later shown by Wilking et al. [22] to exhibit a wavelength dependence given byK =(−0.10±0.05)+(1.86±0.09)λmax. The wavelength dependence ofKhowever was later shown by Clark and Al-Roubaie [2][3] to also depend on such factors as the signal-to-noise ratio, presence of ISM clouds along the line of sight, and the choice of bandpass used for the observations.
As an example of the Serkowski relationship, Topasna et al. [17] determined the wavelength dependence of the star HD 43384 (9 Gem) [their Figure 6 reproduced here as Figure 2] usingBVRI
broadband filters. From a nonlinear fit to the Serkowski equation the degree of polarization was found to be 3.00±0.01 percent with the wavelength of maximum polarization at (0.526±0.005)µmand a position angle in the V band of 170.2◦
±0.01◦. From the original analysis by Serkowski [15] HD 43384 has a degree polarization of 3.0 percent at 0.53µmwithθ(λmax)=170◦. Additionally, a later analysis of this standard star by Hsu and Breger [8] found that p(λmax),λmax, andθV are 3.01±0.04 percent, 0.531±,0.011µm, and 169.8◦±0.7◦respectively.
The agreement between the polarization parameters of HD 43384 determined by Topasna et al. [17] with their accepted values shows that by using broadband filters on a moderately-sized telescope, students can accurately measure the wavelength dependence of polarization. The determination of these parameters can be quite useful as pointed out in the next section.
4.2 Interstellar Extinction
An important use of the wavelength dependence of polarization is the role it can play in helping to determine extinction by interstellar dust. By determining the wavelength at which the maximum polarization occurs, the ratio of total-to-selective extinction can be computed by the equation R =
(5.6±0.3)λmax, Whittet and van Breda [20]. If the color excess of the star happens to be known, then the visual extinction can be found fromAV =RE(B−V).
Consider for instance the previous star HD 43384. It is listed in the Simbad Database as a B3Iab supergiant with a V magnitude of 6.25. However, its spectral type has also been listed as a B3Ia by Bouigue [1] and Johnson and Morgan [9] and as a B3Ib by Hiltner [7] and Morgan and Roman [11]. Using the Schmidt-Kaler [14] absolute magnitudes in the MK system, the average absolute magnitude for HD 43384 is reasonably−6.27±0.43. It should be noted however that the preponderance of mea-surements in the Simbad Database suggests that the star is a B3Iab, which has an absolute magnitude of -6.3.
Likewise, from the eight measurements of the apparent magnitude found in the Simbad Database, an estimate of the apparent magnitude is 6.256±0.007. Using the value ofλmax from Topasna et al. [17] the ratio of total-to-selective extinction isR=2.95±0.03. From the color excess ofE(B−
p(λ)/pmax=exp[−Kln2(λmax/λ)] (2)
wherepmax is the maximum degree of polarization at the wavelengthλmax. The parameter K was originally a constant, set to a value of 1.15 by Serkowski [16] but was later shown by Wilking et al. [22] to exhibit a wavelength dependence given byK =(−0.10±0.05)+(1.86±0.09)λmax. The wavelength dependence ofKhowever was later shown by Clark and Al-Roubaie [2][3] to also depend on such factors as the signal-to-noise ratio, presence of ISM clouds along the line of sight, and the choice of bandpass used for the observations.
As an example of the Serkowski relationship, Topasna et al. [17] determined the wavelength dependence of the star HD 43384 (9 Gem) [their Figure 6 reproduced here as Figure 2] usingBVRI
broadband filters. From a nonlinear fit to the Serkowski equation the degree of polarization was found to be 3.00±0.01 percent with the wavelength of maximum polarization at (0.526±0.005)µmand a position angle in the V band of 170.2◦
±0.01◦. From the original analysis by Serkowski [15] HD 43384 has a degree polarization of 3.0 percent at 0.53µmwithθ(λmax)=170◦. Additionally, a later analysis of this standard star by Hsu and Breger [8] found thatp(λmax),λmax, andθV are 3.01±0.04 percent, 0.531±,0.011µm, and 169.8◦±0.7◦respectively.
The agreement between the polarization parameters of HD 43384 determined by Topasna et al. [17] with their accepted values shows that by using broadband filters on a moderately-sized telescope, students can accurately measure the wavelength dependence of polarization. The determination of these parameters can be quite useful as pointed out in the next section.
4.2 Interstellar Extinction
An important use of the wavelength dependence of polarization is the role it can play in helping to determine extinction by interstellar dust. By determining the wavelength at which the maximum polarization occurs, the ratio of total-to-selective extinction can be computed by the equationR =
(5.6±0.3)λmax, Whittet and van Breda [20]. If the color excess of the star happens to be known, then the visual extinction can be found fromAV =RE(B−V).
Consider for instance the previous star HD 43384. It is listed in the Simbad Database as a B3Iab supergiant with a V magnitude of 6.25. However, its spectral type has also been listed as a B3Ia by Bouigue [1] and Johnson and Morgan [9] and as a B3Ib by Hiltner [7] and Morgan and Roman [11]. Using the Schmidt-Kaler [14] absolute magnitudes in the MK system, the average absolute magnitude for HD 43384 is reasonably−6.27±0.43. It should be noted however that the preponderance of mea-surements in the Simbad Database suggests that the star is a B3Iab, which has an absolute magnitude of -6.3.
Likewise, from the eight measurements of the apparent magnitude found in the Simbad Database, an estimate of the apparent magnitude is 6.256±0.007. Using the value ofλmax from Topasna et al. [17] the ratio of total-to-selective extinction isR=2.95±0.03. From the color excess ofE(B−
V) =0.58 from Wallerstein el al. [18] the visual extinction is AV =1.71±0.08. Therefore, using m=M+AV +5 log(d)−5 and propagation of uncertainties, the distance to HD 43384 is found to be 1467±56 pc. This agrees well with the result of 1465±263 pc by Megier et al. [13] who used the equivalent widths of Ca II K and Ca II H lines to estimate the star’s distance. The agreement between two independent methods in determining the star’s distance is quite striking and reveals the power and potential of distance estimations using polarimetric methods.
4.3 Open Clusters
Open clusters offer the opportunity to make polarimetric measurements of many stars at once. The VMI polarimeter described here has a usable 10 arcminute field-of-view and can therefore image clusters (or parts of clusters) depending on the cluster’s angular size. From the previous discussion it is clear that a polarimeter on a moderately-sized telescope can contribute meaningful scientific results and open clusters can be especially revealing.
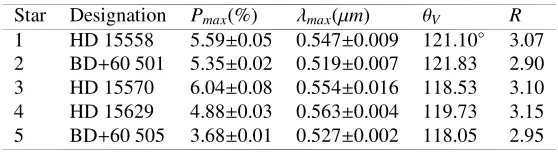
Table 1 lists the polarization parameters of 5 stars in the open cluster IC 1805. These data were ob-tained by analyzing the bright stars in polarization images of the cluster obob-tained in a student project on the night of 29 February 2016. The first column in the table lists the star’s number for reference on Figure 2. The remaining columns give the star’s Henry Draper (or Bonner Durchmusterung) des-ignation, degree of polarization, wavelength of maximum polarization, position angle in the V band, and its value ofR =5.6λmax. Figure 2 is a plot of the electric vectors for the five stars on the plane of the sky with dot sizes proportional to the star’s apparent magnitude and the dashed line indicating the galactic plane at ab=1.0◦. The polarization vectors are generally aligned in the direction of the galactic plane in this region. Since it is known that the optical polarization vectors trace the direc-tion of the magnetic field, this is a very good exercise for students to perform to learn one method of observing the magnetic field in the galaxy.
Table 1.Polarization parameters of five stars in IC 1805
Star Designation Pmax(%) λmax(µm) θV R 1 HD 15558 5.59±0.05 0.547±0.009 121.10◦ 3.07 2 BD+60 501 5.35±0.02 0.519±0.007 121.83 2.90 3 HD 15570 6.04±0.08 0.554±0.016 118.53 3.10 4 HD 15629 4.88±0.03 0.563±0.004 119.73 3.15 5 BD+60 505 3.68±0.01 0.527±0.002 118.05 2.95
These observations also yield information about the cluster. From the measurements listed in Table 1, the average value of the maximum wavelength of polarization is 0.542±0.008µm. This is in excellent agreement with the value of 0.541±0.003µmfound by Medhi et al. [12] and is similar to the mean wavelength for the ISM. Additionally, the measurements yield an average value ofR=3.04±0.05, which is also in excellent agreement with the value of 3.1±0.1 found by Guetter and Vrba [6]. Further analysis of the cluster is complicated by the fact that IC 1805 is located in the W4 HII region, but students can nevertheless use these measurements to perhaps estimate distances to individual cluster stars. For example, Guetter and Vrba [6] calculated the distance to IC 1805 to be 2.4±0.1 kpc. However, recent parallax measurements from the first data release of the Gaia satellite for the five stars in Table 1 imply distances ranges from 0.71 - 2.62 kpc. Polarization measurements can help reveal distances to individual cluster members.
5 Summary
Figure 2.Polarization map of IC 1805. Dashed line is the galactic plane atb=1◦.
AcknowledgmentsThis work is supported by a Jackson-Hope Foundation Grant-in-aid of research at the Virginia Military Institute. This work has made use of data from the European Space Agency (ESA) mission Gaia (http://www.cosmos.esa.int’gaia), processed by the Gaia Data Processing and Analysis Consortium (DPAC, http;//www.cosmos.esa.int/web/gaia/dpac/consortium). Funding for the DPAC has been provided by national institution, in particular the institution participating in the Gaia Multilateral Agreement. This study made use of the NASA Astrophysics Data System, and the SIM-BAD database of theCentre de Donn´ees Stellaires(http://cdsweb.u-strasbg.fr/)
References
[1] Bouigue, M. R. Publ. Obs. Haute-Provence4, 52 (1959) [2] Clarke, D., Al-Roubaie, A. MNRAS202, 173 (1983) [3] Clarke, D., Al-Roubaie, A. MNRAS206, 729 (1984)
[4] Clarke, D. C.Stellar PolarimetryWILEY-VCH Verlag Gmbh & Co. KGaA, Weinheim, (2010) [5] di Serego Alighieri, S. inInstrumentation for Large TelescopesJ. M. Rodriguez Espinosa Ed.,
Cambridge Univ. Press, (1998) 287
[6] Guetter, Harry H. and Vrba, Frederick J. AJ98, 611 (1989) [7] Hiltner, W. A. AJ114, 241 (1951)
[8] Hsu, Jin-Chung and Breger, Michel ApJ262, 732 (1982) [9] Johnson, H. L. and Morgan, W. W. ApJ117, 313 (1953)
[10] Ludmilla Kolokolova, James Hough, and Anny-Chantal Levasseur-Regourd Ed.Polarimetry of Stars and Planetary SystemsCambridge Univ. Press (2015)
[11] Morgan, W. W. and Roman, N. G. ApJ112, 362 (1950)
[12] Medhi, Biman J., Maheswar, G., Brijesh, K., Pandey, J. C., Kumar, T. S. and Sagar, R. MNRAS 378, 881 (2007)
[13] Megier, A., Strobel, A., Galazutdinov, G. A. and Krelowski, J. A&A507, 833 (2009)
[14] Schmidt-Kaler, T. H. Physical Parameters of Stars in Landolt-Bornstein New Series, Vol. 2b
Schaifers, K and Voigt, H. H. Ed., Springer-Verlag, New York (1982)
[15] Serkowski, K. in Planets, Stars, and Nebulae studied with photopolarimetry, Ed. T. Gehrels, University of Ariozona Press, (1974) 135
[16] Serkowski, K., Mathewson, D.S., Ford, V.L. ApJ,196, 261 (1975) [17] Topasna, G. A., Topasna, D. M., and Popko, G. B. PASP125, 1056 (2013) [18] Wallerstein, G., Sandstrom, K. and Gredel, R. PASP119, 1268 (2007) [19] Wardle, J.F.C and Kronberg, P. P. ApJ194, 249 (1974)
[20] Whittet, D. C. B. and van Breda, I. G. A&A66, 57 (1978)