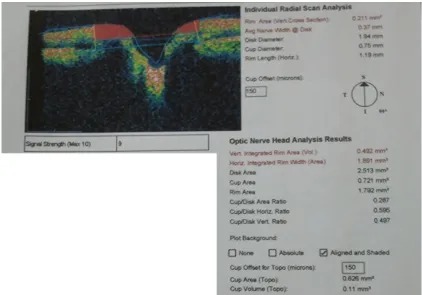
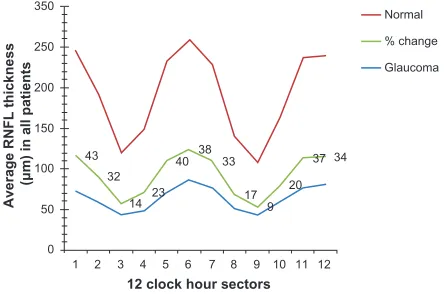
Changes in retinal nerve fiber layer and optic disc algorithms by optical coherence tomography in glaucomatous Arab subjects
Full text
Figure


![Table 1 Demographic characteristics of the study sample (65 patients [36 glaucoma and 29 normal patients])](https://thumb-us.123doks.com/thumbv2/123dok_us/8019502.1333691/5.612.70.308.550.702/table-demographic-characteristics-sample-patients-glaucoma-normal-patients.webp)

Related documents
Heat transfer augmentation technique is widely used to increase heat transfer rate out of which passive heat transfer technique is conveniently used as compare to
No sampling was done as it was intended to carry out the study for a period of 6 months (half year); hence allpregnant women who attended the antenatal clinic forthe first
Since the forearm and upper arm are the preferred sites for AVF (6), cryotherapy could effectively reduce the pain perception of patients during AVF cannulation. This
In Section 2, We derived a six point difference scheme which is equivalent to multi-symplectic integrator for coupled nonlinear Schrödinger system.. In Section 3,
He has extensive experience of large scale research projects having worked as Principal Investigator and co-applicant on a number of funded studies including: National Evaluation
The model was originally published in Harvard Business Review issue 57 (pages 86-93, March 1979) in an article “How Competitive Forces Shape Strategy”. The theory was dealt more
The mean of a density curve (including the normal curve) is denoted by μ (the Greek lowercase letter mu) and the standard deviation is denoted by σ (the Greek lowercase letter
With an objective to access the predictability, robustness, and strength of survival analysis approach as compared to logistic regression, we carried out an analysis in the context
