_____________________________________________________________________________________________________
*Corresponding author: Email: [email protected];
www.sciencedomain.org
Evaluation of Spatial Accessibility to Ohio Trauma
Centers Using a GIS-Based Gravity Model
Wei Chen
1, Krista K. Wheeler
2,3, Yungui Huang
1, Simon M. Lin
1, Daniel Z. Sui
4and Huiyun Xiang
2,3*1Research Information Solutions and Innovations, The Research Institute at Nationwide Children’s
Hospital, Columbus, Ohio, USA. 2
Center for Injury Research and Policy, The Research Institute at Nationwide Children’s Hospital, Columbus, Ohio, USA.
3Center for Pediatric Trauma Research, Nationwide Children’s Hospital, Columbus, Ohio, USA.
4
Department of Geography, The Ohio State University, Columbus, Ohio, USA.
Authors’ contributions
This work was carried out in collaboration between all authors. Authors HX and DZS designed the study and obtained funding. Author WC participated in the study design, performed the analysis, and wrote the first draft of the manuscript. Authors HX and SML supervised the analyses of the study. All authors contributed to the writing and analysis. All authors read and approved the final manuscript.
Article Information
DOI: 10.9734/BJMMR/2015/20378
Editor(s):
(1) Salomone Di Saverio, Emergency Surgery Unit, Department of General and Transplant Surgery, S. Orsola Malpighi University Hospital, Bologna, Italy.
Reviewers:
(1) Nitin Gupta, Ivy Hospital, Hoshiarpur, India. (2) Takashi Nakamura, Jichi Medical University, Japan. (3) Nnadi, Mathias O Nnanna, University of Calabar, Calabar, Nigeria. Complete Peer review History:http://sciencedomain.org/review-history/10668
Received 25th July 2015 Accepted 8th August 2015 Published 24th August 2015
ABSTRACT
Aims: Traumatic injury is one of the leading causes of death in all age groups. Ensuring adequate and effective access to trauma centers is key to improving the quality of care for injured patients. This study evaluates the spatial accessibility of Ohio trauma centers and identifies potentially underserved Ohio counties.
Study Design: A gravity based accessibility model using a Geographic Information System (GIS) was implemented.
Place and Duration of Study: The study was conducted in Nationwide Children’s Hospital in 2015.
Methodology: A gravity based accessibility model using a Geographic Information System (GIS)
was adapted to incorporate US census data, trauma center location data, and trauma center utilization data to quantify accessibility to trauma centers at both the zip code and county levels. An underserved index was developed to identify the location and clustering pattern of underserved regions within the state.
Results: Most served counties were about 10 times more served than an average county while least served counties were about 4 times less served than an average county.
Conclusion: Findings of this study are potentially useful for evaluating regionalized trauma care and provide evidence for trauma care system improvements.
Keywords: Spatial accessibility; traumatic injury; GIS; gravity model; spatial clustering.
1. INTRODUCTION
Regionalized trauma care is considered the best approach for matching patient needs with the available resources and provider expertise to achieve optimal patient outcomes [1-4]. In our recent study based on the 2010 Nationwide Emergency Department Sample, we reported that as high as 34% of U.S. major trauma patients are undertriaged to lower level of emergency departments (EDs) [5]. In another study, we found a significant reduction in the odds of ED mortality – by approximately half – in severely injured trauma patients who were properly triaged to a level I or level II trauma center versus those who were undertriaged to a nontrauma center [6].
As of 2013, the state of Ohio had 178 hospitals with emergency departments, 48 of these were verified trauma centers by the American College of Surgeons Committee on Trauma (ACS-COT). However, the 2013 ACS-COT review for Ohio reported on a likely misdistribution of trauma centers in Ohio and recommended “conducting an assessment of the current trauma system to guide data-driven decisions regarding the location and level of new trauma center designations” [7]. The Report further stated that the current Ohio Emergency Medical Services (EMS) triage guidelines do not “account for geographic proximity or facility designation levels.”
The study of spatial accessibility and the assessment of underserved areas of trauma centers have drawn lots of research attentions recently. In general, geographic proximity can be assessed using spatial accessibility models that take into account the locations of both the demand (e.g. population in the region) and the supply (e.g. trauma centers) [8]. There are two types of popularly adopted accessibility models. One is based on the concept of catchment area, while the other is based on a gravity model of
demand and supply. A catchment area is defined as the extended area from a service center (e.g. trauma center). The catchment area-based accessibility model divides the entire region into binary zones: accessible (within the catchment area) and inaccessible (outside the catchment area). Studies found that catchment areas, Euclidean distance, and drive-time distance could all be effective in defining the catchment area of a service center [9-11].
However, the catchment area-based method of evaluating accessibility has limitations. First, its binary classification of the region is sometimes too idealistic and insufficiently granular especially for large geographic regions such as states. In addition, it does not consider a distance decay effect. It typically treats each location within the catchment area as having equal opportunities of access. Furthermore, the definition of the catchment area varies between applications and, consequently, the results are often difficult to compare across studies. Alternatively, the gravity-based accessibility model can be used to overcome these limitations. A gravity model evaluates accessibility on a more granular scale for all locations in the region by incorporating both spatial and aspatial factors into the modeling process [12,13]. The gravity model has been shown to be a reliable measure of assessing spatial access, whether potential or realized [8].
largely unaddressed. To our best knowledge, geospatial accessibility to trauma centers has not been formally studied at the state level.
The primary goal of this paper is to develop a gravity-based accessibility model using GIS to assess the trauma center service area in Ohio. More specifically, this paper has two objectives. The first objective is to explore how both levels of service and realized access (such as trauma center utilization data) can be incorporated into a GIS-based gravity model to conduct an assessment of spatial access to trauma center care in Ohio. The second objective is to identify underserved areas in terms of access to trauma care in Ohio. By doing so, we not only will develop an improved methodology using a GIS-based gravity model but also conduct a data-driven assessment of the current trauma center system in Ohio. We hope results of this study can be used to guide the decisions regarding the location and level of services of new trauma centers, maximizing their accessibility and minimizing the underserved areas.
2. DATA AND METHODS
2.1 Data
Two data sources were used in our analysis of trauma center accessibility. The first data were the general information about the 47 trauma centers in Ohio and the 86 trauma centers in five bordering states (Indiana, Kentucky, Michigan, Pennsylvania and West Virginia) including trauma center classification (Level I, II, and III), and street address. Trauma centers are verified by the American College of Surgeons using a standard set of criteria, with Level I centers providing the highest level of care followed by Level II and III centers. There are no Level IV and V trauma centers in Ohio, but some neighboring states have those designations [7]. Since our study was focused on Ohio, only Level I, II, and III were included. In 2013 and 2014, there were 14 Level I, 12 Level II, and 21 Level III trauma centers in Ohio. In five bordering states, there were 37 Level I, 41 Level II, and 8 Level III trauma centers.
The second data source we used was the trauma center utilization information represented by 2013 Ohio hospital discharge data, which included the zip code and county information of the trauma patients. Trauma patients were defined as having any International Classification of Diseases, Ninth Revision (ICD-9-CM)
diagnosis code of 800-959.9 (excluding injuries from late effects [905-909.9], superficial injuries [910-924.9], and injuries due to foreign bodies [930-939.9]). Up to 15 diagnosis codes could be listed in the hospital discharge data. This ICD-9-CM definition of traumatic injury is consistent with the National Trauma Data Standard Patient Inclusion Criteria [18]. Using hospital discharge data, total discharge counts can be aggregated based on patient’s residence zip code and county. The hospital discharge data did not collect information about the location of injury events. This is a limitation even though more than half of injuries in the U.S. usually happen on people’s residential property.
In addition to the trauma center data, our study also used U.S. census datasets. These population datasets are freely available from the U.S. census website for all census levels including census blocks. Because the hospital discharge data were at the zip code level, we needed to produce estimates of the population for each zip code by aggregating the population on the census block level.
2.2 Methods
A series of analyses was carried out in sequential steps using GIS. These steps included geocoding, estimating the zip code population, building the gravity model, mapping accessibilities, and identifying underserved areas.
2.2.1 Geocoding trauma center locations
Locations of all Level I, II, III trauma centers in both Ohio and five bordering states were geocoded with geographic coordinates using ArcGIS software, a popular geographic information system software application. ArcGIS was also used to carry out the modeling, mapping, and analysis described in the following sections. A GIS layer including all point representations of trauma center locations was created.
2.2.2 Estimating population by zip code
was estimated based on the total population of the block and the percentage of the overlapped area. A geometric point was used to represent the overlapped area (the dot shown in Fig. 1). As a block area is relatively small compared to a zip code, we assumed the population is evenly distributed within the block segment A. The total population of zip code is therefore calculated as:
= ∑ (1)
where p , the population of zip code is the sum of the population of each block k (or partial block k within the zip code); is the total number of block (segments) within the zip code.
Fig. 1. Population mapping from block to zip code
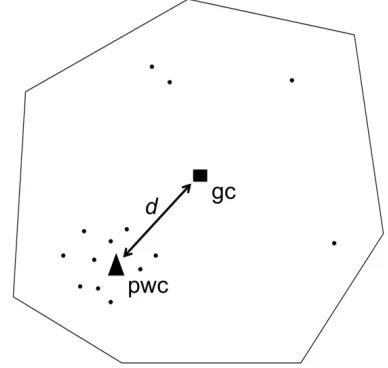
Distance calculation for the gravity model in our study was based on point-based locations. When producing a point representation of a zip code area, the geometric centroid is often not accurate. Population-weighted centroids (pwc) have been used previously to more accurately estimate point locations of areal units [19,20]. Based on point locations of blocks, we estimated the total population of the zip code using the pwc calculation. In Fig. 2, each dot represents a block location. The population-weighted centroids of a zip code were calculated as:
x =∑
∑ y =
∑
∑ (2)
where and are the x and y coordinates of a zip code area. and are the x and y coordinates of the i-th block centroid within the
zip code; is the population at the i-th census block within the zip code.
Fig. 2. Geometric centroid (gc) vs. population weighted centroid (pwc)
2.2.3 The gravity-based accessibility model
The gravity model was first introduced by Lowe in 1996 [13]. The model is based on Newton's Law of Gravitation which postulates that the attraction of object A to object B is proportional to the mass of object A and inversely proportional to the distance between them. In our study, both supply and demand were modeled using a gravity analogy. The general assumption is that the geospatial accessibility of a trauma center increases with the increase of its supply capacity and decreases with its distance to the demand location. Similarly, more demand from the vicinity of the trauma center could lead to decreased accessibility for each location in the vicinity.
U = β (3)
S is the total supply capacity at trauma center location j . Previously, the total number of physicians and the total number of beds were the most commonly used proxies for supply capacity. However, in our case these, or similar, variables, were not available. Therefore, we set = 1, for all trauma centers to reflect our inability to consider the difference between their service capacity in terms of total number of physicians and total number of beds.
S was weighted by the service level parameter k
and divided by distance decay component dβ. The service level parameter, k, was set to be 4, 2 and 1 respectively for Level I, II and III trauma centers to quantify the service levels. In this case, the quality of service as indicated by service levels were accounted for by a linear function = 2 , n was the level of the trauma center.
We further used V to denote the total potential demand to trauma center locationjand calculated it as:
V = ∑ β (4)
The total number of population locations (zip code areas) was m, and was the sum of the demand D weighted by k and distance decay component dβ. D is the total population of the census block i. The weight of the demand at location, k withi suggesting the level or the intensity of the demand. In our study we set k to be 1 for all demand locations. One could set a different relating to different levels of demand (e.g. population at different risk levels).
Based on U and V, the final gravity model in our study was calculated as:
A = ∑ (5)
where A was the final accessibility score of the zip code i with a larger value indicating better accessibility, and n was the total number of trauma center locations. The accessibility of any particular zip code was the sum of its potential access to all trauma centers.
Our gravity model was implemented at the zip code level of population location but we also
mapped our results to counties for interpretation purposes. Policy makers may be more familiar with a county as a target unit rather than a zip code. It is also beneficial to be able to map accessibility results between different geographic levels to integrate different kinds of demographic data available at different geographic levels into the analysis. Real data such as hospital discharge data can then be used to conduct sensitivity analyses for a gravity model when mapping results between different geographic levels is possible.
To project accessibility index results from zip code level to county level, we followed an approach similar to the process of mapping block population to the zip code level as discussed previously. However, instead of using the sum of accessibility on the zip code level, a population-weighted average was used to calculate the accessibility index of each county as follows:
A =∑
∑ (6)
where A was the accessibility of county i, and
A was the accessibility of zip code j in county i.
p was the population of zip code j in county , and was the total number of zip codes within county . The accessibility of the county i was calculated as the population weighted average of the accessibility of all zip codes (or zip code fragments) that were completely within that county. If a zip code was cut off by a county boundary, a similar area-weighted accessibility equation was applied to estimate the accessibility of the part of zip code that was within the county boundary.
Previously, gravity models have been employed both in their classic form [16] and with modifications of travel time function [13]. In both cases, the gravity model was applied at a single geographic level. Here, we made two modifications. First, we introduced the weight parameter to model trauma center levels, which was an important attraction factor. This is not available in the classic gravity model, which only considers service capacity as the only attraction factor. Assigned weights (4, 2, 1) differentiate Level I, II, and III trauma centers with higher weights indicating higher service levels [21].
larger scale (county level) for interpretation. The modified gravity model considered both spatial factors (distance or equivalently 60 minute driving time) and aspatial factors (the trauma center service level and the demand). We dropped the supply capacity variable because we did not have service capacity data for hospitals outside of Ohio.
To implement the gravity model on two geographic levels, in ArcGIS we first calculated the accessibility index at the zip code level based on Equations [1-5]. Then, a sequence of spatial join and field calculations operations were applied to map zip code level accessibility results to the county level based on Equation (6). For supply locations (trauma center locations), the service weight parameter kwas set to be 4, 2 and 1 respectively for Level I, II and III trauma centers. For demand locations (zip code locations), total population of each zip code was used as D . The distance between demand location and supply location was calculated based on Euclidian distance and travel friction coefficient β was set to be 0.6, representing the 60 minutes of travel time [16].
2.2.4 Accessibility classification and visualization of results
Accessibility results were visualized in ArcGIS for spatial pattern interpretation. Two steps were involved: data classification and class symbolization. Data classification decided the grouping of accessibility results. There are several methods for classifying real-valued data in GIS. One of these is the natural breaks (Jens] method. This method maximizes the variance between groups and minimizes the variance within each group [22]. We applied this method in ArcGIS to classify the accessibility index into three classes high, medium, and low corresponding to areas of high access, good access and low access, respectively. Accessibility was symbolized using the graduated colors on a grey scale color ramp with darker color indicating better access. Aggregated results at the county level also used the same classification scheme.
2.2.5 Identifying and ranking of underserved counties
In our study, underserved counties were defined as those with high discharge and low accessibility. An underserve index should be positively correlated with discharge volume and negatively associated with the accessibility.
Thus, we defined underserve index U for county
i using the following equation:
U = (7)
where d was the total hospital trauma patient discharge volume for county ; was the total population of county , and was the accessibility index for county .
Since the accessibility index was calculated as a population ratio, the scale effect of the population amount was removed from the model. Therefore, county level hospital trauma patient discharge data were normalized by the total population of each county as accomplished by Equation (7).
One of the limitations of a gravity model is that it only calculates potentials and its relationship to the reality usually is unknown. Hospital trauma patient discharge data are a type of commonly available reality data that can be used as a measure of revealed access (compared to potential access based on the gravity model). As shown here by leveraging both accessibility results and reality data in the underserved index, we have overcome this limitation of the gravity model.
In our study, the underserved index of all counties was also classified using the ArcGIS natural breaks method. Three classes of underserved area were identified: highly underserved, underserved and served corresponding to high, medium and low underserved index respectively. In addition, we scaled the underserved index score based on a range of 1 to 100 with the maximum value being 100. Finally, we ranked and identified the top 10 underserved and served counties.
3. RESULTS AND DISCUSSION
3.1 Results
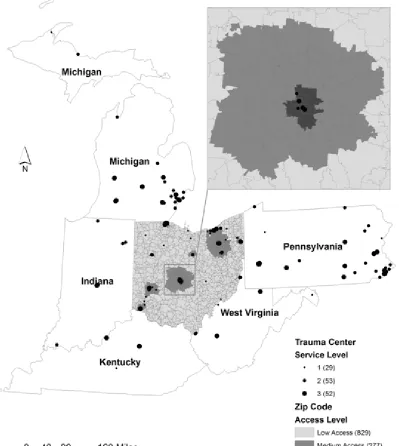
Fig. 3 shows that the potential access to Ohio trauma centers at the zip code level was unevenly distributed. High access zip codes clustered around urban centers where a concentration of high-level trauma centers was located. We also observed that a large number of zip codes had relatively low access compared to a small number of high access zip codes.
the one at the zip code level in which areas of good access clustered around urban centers (Cincinnati, Columbus and Cleveland). Additionally, northeastern regions had overall better access than other parts of Ohio due to a
high concentration of trauma centers at different levels. Available access to out-state trauma centers might have met some of the needs for border populations such as those in northern part of the state that is adjacent to Michigan.
Fig. 3. Access to trauma centers in Ohio by zip code1
1 In the legend, graduated size symbols were used to represent trauma center locations with the size proportional to their
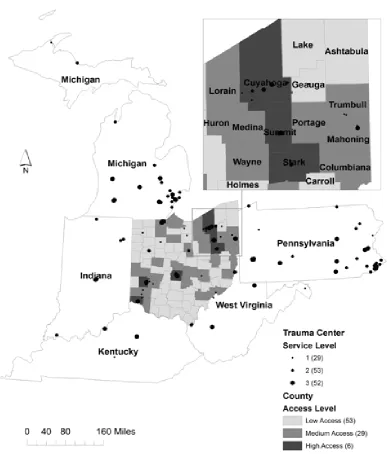
Fig. 4. Access to trauma centers in Ohio by county
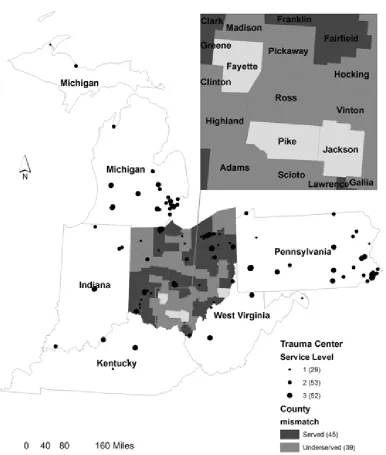
The underserved index map of Ohio counties (Fig. 5) identified counties of different underserved levels. The underserved levels range from high to low; high score indicated that the county was in a great need of service (high hospital trauma patient discharge volume and low access) while a low score indicated that the county was relatively well served (low hospital trauma patient discharge volume and high access).
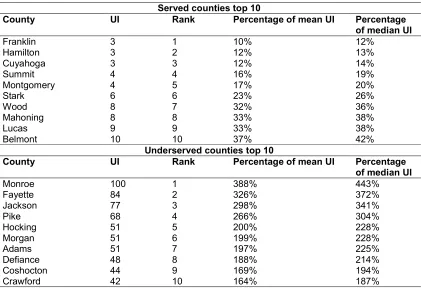
Table 1 shows the ranking of top 10 served and underserved counties, respectively. The degree
Fig. 5. Underserved counties
3.2 Discussion
Results of the gravity model at the zip code level suggested that location of trauma centers and travel times were the two biggest factors in deciding accessibility. This finding is consistent with the conclusion from previous research [23] which also identified distance to service location as the most important factor. High access regions correlated well with clusters of trauma center locations and overall accessibility tapered off from the center of the cluster.
Table 1. Ranking of served and underserved counties
Served counties top 10
County UI Rank Percentage of mean UI Percentage
of median UI
Franklin 3 1 10% 12%
Hamilton 3 2 12% 13%
Cuyahoga 3 3 12% 14%
Summit 4 4 16% 19%
Montgomery 4 5 17% 20%
Stark 6 6 23% 26%
Wood 8 7 32% 36%
Mahoning 8 8 33% 38%
Lucas 9 9 33% 38%
Belmont 10 10 37% 42%
Underserved counties top 10
County UI Rank Percentage of mean UI Percentage
of median UI
Monroe 100 1 388% 443%
Fayette 84 2 326% 372%
Jackson 77 3 298% 341%
Pike 68 4 266% 304%
Hocking 51 5 200% 228%
Morgan 51 6 199% 228%
Adams 51 7 197% 225%
Defiance 48 8 188% 214%
Coshocton 44 9 169% 194%
Crawford 42 10 164% 187%
Given the available hospital trauma patient discharge data we identified underserved areas by comparing revealed accessibility with potential accessibility. Previous studies identified underserved areas by aggregating variables that represented disadvantageous population groups [24]. Those variables worked well to some degree but they were still demographic measures rather than actual patient demand measures. In our study, we incorporated hospital patient discharge data in identifying underserved regions, which has not been done previously. The underserved counties map revealed big mismatch between real access (total hospital trauma patient discharge) and potential access (accessibility index) at the county level. These results may be used by policy makers to quickly identify counties with unmet needs.
Our study has several limitations. Discrete classification of accessibility values was subject to interpretation as the classification results largely depended on the classification method chosen. The total number of physicians, nurses, and the total number of beds of trauma centers were not available so the supply capacity variable was set to be a same constant for all supply locations in our analysis. This study was
also restricted to spatial accessibility evaluation, demographic factors like income, which could potentially affect access to transportation, were not considered. Another limitation is that the service level parameter for level I, II and III trauma centers was arbitrarily set. Although we chose the parameter based on experts’ opinions and our previous trauma care research, this parameter needs to be evaluated further in future research.
Nonetheless, GIS has been shown to be a powerful tool in integrating different sources of data and visualizing results on a map. Hospital location data and demographics data could be easily integrated on a spatial basis using GIS. Spatial patterns could be quickly identified by looking at clusters on a map rather than by querying raw data tables. Accessibility can be modeled and analyzed using capabilities of a GIS, which may not be always available elsewhere.
4. CONCLUSION
difficult when both spatial and nonspatial factors are involved. This study implemented a GIS-based gravity model to evaluate accessibility to trauma centers in Ohio and further identified the distribution of underserved counties. In this study, we adapted the classic gravity model and introduced two modifications: The introduction of a weight parameter for factoring trauma center service levels and a method of transferring the accessibility results to different geographic levels. Both modifications were shown to be necessary for the final step of identifying underserved areas at a county level.
By incorporating hospital trauma patients discharge data, we identified the mismatch between simulated results and real world situations. Based on the ranking of underserved areas, policy makers are given scientific evidence to develop more clear destination protocols to ensure appropriate triage of injured patients from the field to the appropriate trauma center based on trauma center level, proximity, and patients at risk. Local agencies with statutory authority in Ohio can also use the findings from this study to establish a transparent evidence-based process for future designation of trauma centers and ongoing re-designations [1,5].
CONSENT
All authors declare that ‘written informed consent was obtained from the patient (or other approved parties) for publication of this case report and accompanying images.
ETHICAL APPROVAL
This study was reviewed and approved by the Institutional Review Board of the Research Institute at Nationwide Children’s Hospital, The Ohio State University, USA.
All authors hereby declare that all experiments have been examined and approved by the appropriate ethics committee and have therefore been performed in accordance with the ethical standards laid down in the 1964 Declaration of Helsinki.
ACKNOWLEDGEMENT
This study was funded by the Ohio EMS Grant, Division of Emergency Medical Service, Ohio Department of Public Safety (PI: Dr. Huiyun Xiang), and a research grant (PI: Dr. Huiyun Xiang, Grant No.:1R03-HS022277) from the
Agency for Healthcare Research and Quality. The views expressed here are solely the responsibility of the authors and do not necessarily reflect the official views of the funding agencies.
COMPETING INTERESTS
Authors have declared that no competing interests exist.
REFERENCES
1. Celso B, Tepas J, Langland-Orban B, Pracht E, Papa L, Lottenberg L, et al. A systematic review and meta-analysis comparing outcome of severely injured patients treated in trauma centers following the establishment of trauma systems. J Trauma. 2006;60(2):371-8; discussion 8. 2. Demetriades D, Martin M, Salim A, Rhee
P, Brown C, Chan L. The effect of trauma center designation and trauma volume on outcome in specific severe injuries. Ann Surg. 2005;242(4):512-7.
3. Demetriades D, Martin M, Salim A, Rhee P, Brown C, Doucet J, et al. Relationship between American College of Surgeons trauma center designation and mortality in patients with severe trauma (injury severity score>15). J Am Coll Surg. 2006;202(2): 212-5.
4. Utter GH, Maier RV, Rivara FP, Mock CN, Jurkovich GJ, Nathens AB. Inclusive trauma systems: Do they improve triage or outcomes of the severely injured? J Trauma. 2006;60(3):529-35.
5. Xiang H, Wheeler KK, Groner JI, Shi J, Haley KJ. Undertriage of major trauma patients in the US emergency departments. Am J Emerg Med. 2014; 32(9):997-1004.
6. Vickers BP, Shi J, Lu B, Wheeler KK, Peng J, Groner JI, et al. Comparative study of ED mortality risk of US trauma patients treated at level I & level II vs. nontrauma centers. Am J Emerg Med. 2015.
7. ACS-COT. Trauma system consultation report; 2013.
Available:http://www.publicsafety.ohio.gov/l inks/ACS OH Trauma System
Report_final.pdf
9. Yang D-H, Goerge R, Mullner R. Comparing GIS-based methods of measuring spatial accessibility to health services. J Med Syst. 2006;30(1):23-32. 10. Wang F, Luo W. Assessing spatial and
nonspatial factors for healthcare access: towards an integrated approach to defining health professional shortage areas. Health Place. 2005;11(2):131-46.
11. Mao L, Nekorchuk D. Measuring spatial accessibility to healthcare for populations with multiple transportation modes. Health Place. 2013;24:115-22.
12. Schuurman N, Berube M, Crooks VA. Measuring potential spatial access to primary health care physicians using a modified gravity model. Can Geogr. 2010; 54(1):29-45.
13. Lowe JM, Sen A. Gravity model applications in health planning: Analysis of an urban hospital market. J Reg Sci. 1996; 36(3):437-61.
14. Lawson FL, Schuurman N, Oliver L, Nathens AB. Evaluating potential spatial access to trauma center care by severely injured patients. Health Place. 2013;19: 131-7.
15. Shi X, Alford-Teaster J, Onega T, Wang D. Spatial access and local demand for major cancer care facilities in the United States. Ann Assoc Am Geogr. 2012;102(5):1125-34.
16. Luo W, Wang F. Measures of spatial accessibility to health care in a GIS environment: Synthesis and a case study in the Chicago region. Environ Plann B. 2003;30:865-84.
17. Wong LY, Heng BH, Cheah JTS, Tan CB. Using spatial accessibility to identify polyclinic service gaps and volume of under‐served population in Singapore using Geographic Information System. Int J Health Plann Manage. 2012;27(3):e173-e85.
18. National Trauma Data Bank. National Trauma Data Standard: Data Dictionary; 2014.
Available:http://www.ntdsdictionary.org/ 19. Wu J, Zhou Y, Gao Y, Fu JS, Johnson BA,
Huang C, et al. Estimation and uncertainty analysis of impacts of future heat waves on mortality in the eastern United States. Environ Health Perspect. 2014;122(1):10. 20. Luo W, Whippo T. Variable catchment
sizes for the two-step floating catchment area (2SFCA) method. Health Place. 2012;18(4):789-95.
21. Cudnik MT, Newgard CD, Sayre MR, Steinberg SM. Level I versus Level II trauma centers: An outcomes-based assessment. J Trauma Acute Care Surg. 2009;66(5):1321-6.
22. ESRI. Arc GIS classification; 2015. Available:http://resources.arcgis.com/en/he lp/main/10.1/index.html
-//00s50000001r000000
23. Geertman SC, Ritsema Van Eck JR. GIS and models of accessibility potential: An application in planning. Int J Geogr Inf Syst. 1995;9(1):67-80.
24. Luo W, Qi Y. An enhanced two-step floating catchment area (E2SFCA) method for measuring spatial accessibility to primary care physicians. Health Place. 2009;15(4):1100-7.
© 2015 Chen et al.; This is an Open Access article distributed under the terms of the Creative Commons Attribution License (http://creativecommons.org/licenses/by/4.0), which permits unrestricted use, distribution, and reproduction in any medium, provided the original work is properly cited.
Peer-review history: