Some results from the Yakutsk array experiment and the status of the
modernization program
AnatolyIvanov1, fortheYakutskarraygroup
1ShaferInstituteforCosmophysicalResearch&Aeronomy,Yakutsk677980,Russia
Abstract. The Yakutsk array has been used to study cosmic rays since 1974. Charged particles such as electrons, positrons and muons are detected, as well as radio signals emitted by air showers. However, the characteristic shower component detected by the array is Cherenkov light. This article briefly reviews recent results from the Yakutsk array group.
1 Introduction
An extensive air shower (EAS) of cosmic rays (CRs) is a cascade of particles induced by an energetic as-troparticle hitting the atmosphere. Detection of an EAS is made possible by detectors placed at the Earth’s surface and underground, and detectors view-ing the atmosphere, operatview-ing together. Examples of the detectors used in the Yakutsk array experiment are shown in Fig. 1.
The array can be characterized by the target en-ergy range of the primary CRs detected (1015 − 1019eV) and the area over which detectors are located (8 km2at present, and 17 km2during the period 1974– 1990). The array consists of 58 stations equipped with scintillation counters; 48 Cherenkov light detectors; four underground muon detectors; three detectors-obscura; and six radio detectors (32 MHz).
Shower events are selected based on two-level trig-ger from the set of detector signals. The first level is the coincidence of two scintillator signals at a station within 2µs, while the second level is the coincidence
of signals from at least three nearby stations within 40µs.
The detection times for the shower front at the surface stations are used to calculate the angles of arrival for the EAS primary particles. A clock pulse transmitter at the center of the array provides pulse timing with an accuracy of 100 ns. The resultant errors in arrival angles depend on the primary energy, which decreases from ∼ 7◦ at E = 1 EeV to ∼ 3◦ aboveE= 10EeV [1–5].
The energy estimation method involves the to-tal flux measurement of the Cherenkov light and the number of electrons and muons at the observation level [6–9]. The error in the energy estimation is the sum of the random and systematic uncertainties in the
e-mail: [email protected]
errors in the absolute calibration of the Cherenkov light detectors and in the estimation of the atmo-spheric transparency. The total error in the energy estimation increases with the zenith angle and the primary energy, and reachesδE/E∼35%for showers with axes within the array area [5].
2 Recent results involving the interaction
of particles and the characteristics of
air showers
A multitude of particles is produced in a shower via inelastic interactions with nuclei in the atmosphere. The main characteristic of the proton-nuclei interac-tion is the mean total inelastic cross secinterac-tion, and this can be estimated based on a measurement of the at-tenuation length of the EAS, namely the exponential tail of the distribution ofxmax, which is related toσpair
according to model simulations of air showers (Fig. 2, left panel). The Yakutsk array results [10] for the proton-air cross section are shown in the right panel of Fig. 2, and are compared with the results of other experiments and model predictions. In general, the data consistently show a cross section that increases with energy. A detailed analysis of the statistical pre-cision of the experimental results and the systematic uncertainties in the predictions of the model can be found in [11].
The attenuation of showers in the atmosphere used to be studied applying the method of constant in-tensity cuts [12]. We derived the S600(x) profile and the coupled zenith angle distribution of the EAS event rate (illustrated in Fig. 3) using data from the Yakutsk array [13].
An additional constraint used in data selection is the unified particle density threshold, ρthr
approx-Figure 1. Upper panel: Central part of the Yakutsk array. Lower panel: Left: A box with scintillation counter and PMT. Center: Layout of the detectors in a station. Right: A muon detector.
Figure 2. Left: Distribution ofxmaxin the energy bin. Right: World data onσairp estimation in cosmic ray experiments.
imated by the log-normal distribution. As a result, the close connection between the shower absorption rate in the atmosphere and the zenith angle distribu-tion of the rate of EAS events at the observadistribu-tional level is demonstrated by comparing the observed and expected distributions.
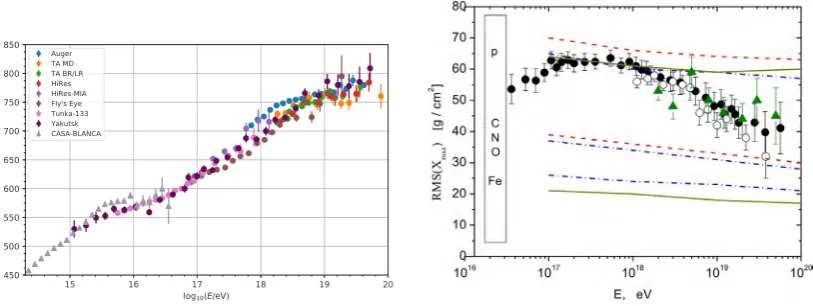
The position of the shower maximum1 in the
at-mosphere,xmax, is one of the main characteristics of
an EAS. Our results [14] are shown in the context of global data from EAS arrays in Fig. 4, which is bor-rowed from [15]. The dispersion in xmax (right panel
of Fig. 4) is illustrative of the mass composition eval-uation of CRs as a function of energy, and is compared
1in the number of particles
with the model simulations for primary nuclei shown by the curves.
Figure 1. Upper panel: Central part of the Yakutsk array. Lower panel: Left: A box with scintillation counter and PMT. Center: Layout of the detectors in a station. Right: A muon detector.
Figure 2. Left: Distribution ofxmaxin the energy bin. Right: World data onσairp estimation in cosmic ray experiments.
imated by the log-normal distribution. As a result, the close connection between the shower absorption rate in the atmosphere and the zenith angle distribu-tion of the rate of EAS events at the observadistribu-tional level is demonstrated by comparing the observed and expected distributions.
The position of the shower maximum1 in the
at-mosphere,xmax, is one of the main characteristics of
an EAS. Our results [14] are shown in the context of global data from EAS arrays in Fig. 4, which is bor-rowed from [15]. The dispersion in xmax (right panel
of Fig. 4) is illustrative of the mass composition eval-uation of CRs as a function of energy, and is compared
1in the number of particles
with the model simulations for primary nuclei shown by the curves.
The radio signal detectors of the Yakutsk array operate in the frequency band 30−35MHz in coin-cidence with surface detectors. Ten pairs of crossed dipole antennas (oriented east-west vs. north-south) deployed over an area of 0.35 km2 are used to re-ceive the signals from showers [16]. The data acquisi-tion system includes broadband amplifiers, 100 MHz 8-bit ADCs, and a data processing computer. The ra-dio signal from the shower is selected from the back-ground noise using the trigger signal from the array of charged particle and Cherenkov light detectors.
‐2 ‐1 0 1 2 3 4
1000 1200 1400 1600 1800 2000
ln
(
600
, m
‐2)
X, g/cm2
lg(E, eV)
19.11 18.81 18.48 18.19 17.89 17.63
0 0.05 0.1 0.15 0.2 0.25
0 10 20 30 40 50 60
f(
)
, deg
17.00<lgE<17.25 17.25<lgE<17.50 17.50<lgE<17.75 17.75<lgE sin(2)erfc((ythr‐y())/σ√2)
sin(2)
Figure 3. Left: Particle density profile,S600(x), derived using constant intensity cuts. Right: Zenith angle distribution
of EAS event rate observed with the Yakutsk array.
Figure 4. Left: Estimation ofxmaxin EAS experiments. Right: RMS deviation ofxmaxmeasured in experiments and model simulations.
Figure 5. Left: Field strength vs R. Center: Amplitude vs E. Right: xmaxreconstruction with radio signal.
The resultant radio signals from the EAS with
en-ergyE >1017eV are attributed to showers with
char-acteristics defined by the main array. Fig. 5 shows the lateral distribution of the radio signal as a func-tion of the shower core distance, the dependence of the amplitude on the primary energy, and xmax(E)
estimated using the radio signal.
The results demonstrate the emission of a radio signal by the EAS with energies between1017eV and more than1019eV. The radio signal is also detected in inclined showers, confirming the geomagnetic
mecha-nism of radio wave generation by relativistic particles in showers.
Our results prove that the radio signal from EAS detected at energies above 1017 eV can be used to study the physics of air showers, both as an indepen-dent method and in conjunction with other methods.
3 The astrophysics of UHECR
-0.2 -0.1 0 0.1 0.2
0.5 1.0 1.5 2.0
(W-WN
)/W
0
log(EWG, EeV)
Yakutsk PAO TA
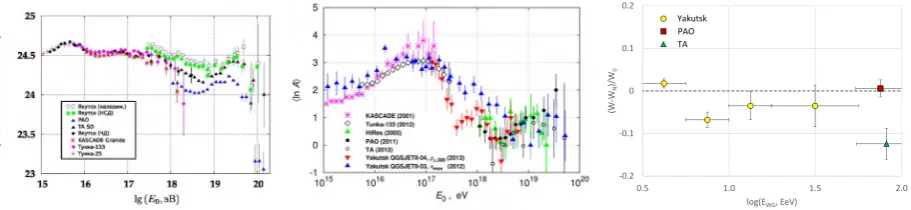
Figure 6. Left: Differential energy spectrum of CRs. Center: Mass composition of CRs estimated from EAS array data. Right: The minimum width of UHECR arrival directions distribution.
array group was reported recently [17]. The resul-tant energy spectrum combined with data from the Cherenkov detectors [18] is shown in the left panel of Fig. 6, in comparison with the results from other arrays. At the highest energies, there are still some discrepancies between the data; however, the main features of the spectrum, i.e. the knee, ankle and cutoff, appear to be compatible. Moreover, an indi-cation of a second knee at an energy of ∼ 2×10¹⁷ eV is obtained from the Cherenkov light detectors of the Yakutsk array, and this is presumably formed by a sharp steepening of the spectrum of galactic heavy nuclei [19].
The divergence in the energy spectra of UHECRs measured with different giant arrays is actually con-gruous with instrumental errors if the energy correc-tion factors are taken into account [20]. These factors, which are individual for each particular array, may be attributed to uncertainties in the nucleus-nucleus in-teraction models used to connect the observed shower parameters with the primary energy of the EAS.
The main methods for estimation of the mass com-position of CRs are based on measurements of the mean value of and fluctuations inxmax, and the muon
content of showers. The results from the Yakutsk array obtained using these two methods [21, 22] are shown in the central panel of Fig. 6, in comparison with available data from other experiments. A con-ventional conclusion from these various results would be that the mass composition changes from a heavy galactic to a light extragalactic CR component be-tween 1017 and 1018 eV. The results are more diver-gent at the highest energies, due to the reduced num-ber of EAS events detected, and possibly due to dif-ferences in model-dependent interpretations.
An event-by-event comparison of the muon density observed in an EAS by the Yakutsk array detectors with that expected from CORSIKA simulations for primary protons and iron, using SIBYLL and EPOS hadronic interaction models, suggests the presence of two distinct hadronic components, ‘light’ and ‘heavy’, which is in good agreement with the expected com-position in which the light component corresponds to protons and the heavy component to iron-like nuclei. Assuming a two-component (proton and iron)
com-position and the EPOS model, the fraction of protons with energies E >1019 eV is found to be0.52+0−0..1920 at 95% confidence level [23].
The arrival directions of UHECRs have tradition-ally been analyzed by a variety of methods in order to reveal subtle anisotropy. A simple and promis-ing method has been recently proposed by our group, namely, the minimum width of the circular distribu-tion [24]. The idea is that the isotropic distribudistribu-tion is characterized by the maximum width, while a source of CRs, if present, inevitably reduces this width, de-pending on the fraction of the total flux: the greater the fraction from a source, the smaller the observed distribution width. The asymptotic limiting value is the angular size of the source.
The minimum width calculated using the Yakutsk array data, and a comparison with the widths derived from the available data from the PAO and TA arrays, are shown in the right panel of Fig. 6. Indeed, the method unambiguously reveals the ‘HotSpot’ in the data from TA, which is hypothesized to be a source of CRs withE >5.7×10¹⁹ eV [25].
EAS events induced by photon primaries can usu-ally be identified by a deficit of muons in comparison with nuclei-initiated showers (Fig. 7, left panel). The estimated cosmological photon flux is within the re-gion of interest for highest-energy astrophysics, tests of extragalactic backgrounds and for searches for new physics.
Although the muon energy density is a better method than the depth of the shower maximum for distinguishing primary photons from hadrons induc-ing EAS, we also used a multi-component analysis of air showers detected by the Yakutsk array at energies above 1018eV [26] to strengthen the upper limit on the integral flux of primary photons in the CR beam in comparison with previous efforts.
As a result, an upper limit on the integral photon flux is derived in the energy interval (1018
-0.2 -0.1 0 0.1 0.2
0.5 1.0 1.5 2.0
(W-WN
)/W
0
log(EWG, EeV)
Yakutsk PAO TA
Figure 6. Left: Differential energy spectrum of CRs. Center: Mass composition of CRs estimated from EAS array data. Right: The minimum width of UHECR arrival directions distribution.
array group was reported recently [17]. The resul-tant energy spectrum combined with data from the Cherenkov detectors [18] is shown in the left panel of Fig. 6, in comparison with the results from other arrays. At the highest energies, there are still some discrepancies between the data; however, the main features of the spectrum, i.e. the knee, ankle and cutoff, appear to be compatible. Moreover, an indi-cation of a second knee at an energy of ∼ 2×10¹⁷ eV is obtained from the Cherenkov light detectors of the Yakutsk array, and this is presumably formed by a sharp steepening of the spectrum of galactic heavy nuclei [19].
The divergence in the energy spectra of UHECRs measured with different giant arrays is actually con-gruous with instrumental errors if the energy correc-tion factors are taken into account [20]. These factors, which are individual for each particular array, may be attributed to uncertainties in the nucleus-nucleus in-teraction models used to connect the observed shower parameters with the primary energy of the EAS.
The main methods for estimation of the mass com-position of CRs are based on measurements of the mean value of and fluctuations inxmax, and the muon
content of showers. The results from the Yakutsk array obtained using these two methods [21, 22] are shown in the central panel of Fig. 6, in comparison with available data from other experiments. A con-ventional conclusion from these various results would be that the mass composition changes from a heavy galactic to a light extragalactic CR component be-tween 1017 and 1018 eV. The results are more diver-gent at the highest energies, due to the reduced num-ber of EAS events detected, and possibly due to dif-ferences in model-dependent interpretations.
An event-by-event comparison of the muon density observed in an EAS by the Yakutsk array detectors with that expected from CORSIKA simulations for primary protons and iron, using SIBYLL and EPOS hadronic interaction models, suggests the presence of two distinct hadronic components, ‘light’ and ‘heavy’, which is in good agreement with the expected com-position in which the light component corresponds to protons and the heavy component to iron-like nuclei. Assuming a two-component (proton and iron)
com-position and the EPOS model, the fraction of protons with energies E >1019 eV is found to be0.52+0−0..1920 at 95% confidence level [23].
The arrival directions of UHECRs have tradition-ally been analyzed by a variety of methods in order to reveal subtle anisotropy. A simple and promis-ing method has been recently proposed by our group, namely, the minimum width of the circular distribu-tion [24]. The idea is that the isotropic distribudistribu-tion is characterized by the maximum width, while a source of CRs, if present, inevitably reduces this width, de-pending on the fraction of the total flux: the greater the fraction from a source, the smaller the observed distribution width. The asymptotic limiting value is the angular size of the source.
The minimum width calculated using the Yakutsk array data, and a comparison with the widths derived from the available data from the PAO and TA arrays, are shown in the right panel of Fig. 6. Indeed, the method unambiguously reveals the ‘HotSpot’ in the data from TA, which is hypothesized to be a source of CRs withE >5.7×10¹⁹ eV [25].
EAS events induced by photon primaries can usu-ally be identified by a deficit of muons in comparison with nuclei-initiated showers (Fig. 7, left panel). The estimated cosmological photon flux is within the re-gion of interest for highest-energy astrophysics, tests of extragalactic backgrounds and for searches for new physics.
Although the muon energy density is a better method than the depth of the shower maximum for distinguishing primary photons from hadrons induc-ing EAS, we also used a multi-component analysis of air showers detected by the Yakutsk array at energies above 1018eV [26] to strengthen the upper limit on the integral flux of primary photons in the CR beam in comparison with previous efforts.
As a result, an upper limit on the integral photon flux is derived in the energy interval (1018
−1019) eV, which is stronger than previous results based on an analysis of data from the Yakutsk array [27]. Both results are compared with data from other giant ar-rays and model predictions in the right panel of Fig. 7. Experimental data disfavor super-heavy dark matter and topological defect models in top-down scenarios.
Figure 7. Left: EAS distribution vs muon fraction in the QGSjetII-04 model. Right: Experimental limits on cosmological photon flux and astrophysical scenarios.
Figure 8. Left: Target (red) and current (blue) angular resolution of the array. Center: The prototype set of modernized stations. Right: A test bed for scintillation counters.
4 Modernization of the Yakutsk array
The Yakutsk array needs modernization, and the main goal of this is to improve the accuracy of an-gular measurements and primary energy estimation. The uncertainty in energy estimation is expected to be reduced with a new set of Cherenkov light and charged particle detectors, while a fast synchroniza-tion system will provide the measurement of the signal temporal parameters with improved accuracy.The new Gigabit Ethernet LAN of the array op-erates over the optical fiber network connecting all the array detectors. The aim is to provide a synchro-nization accuracy for the detectors of ∼ 10 ns with regard to the central time server, as far as to modern-ize the data acquisition and transfer systems. New scintillation counters are currently being tested on a prototype subset of 11 stations (Fig. 8).
The temporal characteristics of the Cherenkov sig-nal are studied with the wide FOV telescope, which detects showers in coincidence with the surface detec-tors of the array [28, 29]. It has been shown that the pulse duration is a function of the shower core dis-tance (Fig. 9). Precise measurements of the time dif-ferences between Cherenkov photons arriving at the detectors and the shower core can be used to
esti-mate not only the arrival directions of the primaries but also the shower age andxCher
max.
However, the current accuracy of the Yakutsk ar-ray detectors is not sufficient to measure the distance to the shower maximum with reliability. Significant improvements are needed in the timing resolution and synchronization of detectors. The key objective in this context is to improve the synchronization of the array detectors, in order to refine the core location accuracy and the measurement of time differences between the signals at the detectors. When complete, the modern-ization program of the Yakutsk array will make this type of measurement possible.
5 Conclusion
Spherical mirror D=26 cm; F=11.3 cm
2*16 operational amplifiers Position-sensitive PMT
with holders and voltage-divider
0 0.1 0.2 0.3 0.4 0.5 0.6
0 100 200 300 400 500 600 700 800
Signals
of
X
w
ires, V
t, ns EAS event 12.11.2012 13:20:11 UTC
0 0.1 0.2 0.3 0.4 0.5 0.6 0.7
0 100 200 300 400 500 600 700 800
Signals
of
Y
w
ires
, V
t, ns
<15 wires>:
t0.9=17.3± 5.2 ns
t0.5=50.1±10.4 ns
tr=14.7± 2.8 ns
tm=18.9± 2.3 ns
tf=81.0±25.7 ns
E0=37 PeV
θ=80
φ=2730 R=220 m
3 7 7 73
229 204
82
0 50 100 150
1 1.5 2 2.5 3
FWHM,
ns
lg(R, m) Haverah Park
WFOV Cherenkov Telescope Tunka
Yakutsk, 1975
Figure 9. Left: Wide field-of-view Cherenkov telescope. Center: Signals from X- and Y-wires of the multi-anode photomultiplier tube in the focus of the mirror. Right: Pulse duration of the Cherenkov signal vs the shower core distance.
The author would like to thank the organizers of the meeting for the invitation to give a talk and for providing a stimulating atmosphere in the sessions.
This work was partially supported by SB RAS (program II.2/II.1), and by RFBR (grant no. 16-29-13019).
References
[1] A.A. Ivanov, S.P. Knurenko, I.Ye. Sleptsov, JETP
104870 (2007)
[2] A.A. Ivanov, S.P. Knurenko, M.I. Pravdin, I.Ye. Sleptsov, Moscow Univ. Phys. Bull.65 292 (2010) [3] A.A. Ivanov, Nucl. Phys. B (Proc. Suppl.)190204 (2009); EPJ Web of Conf. 53, 04003 (2013); ApJ
763, 112 (2013)
[4] A.A. Ivanov et al., Astropart. Phys.621 (2015) [5] M.I. Pravdin et al., Bull. Russ. Acad. Sci. Phys.
71445 (2007)
[6] A.V. Glushkov et al., Bull. Russ. Acad. Sci. Phys.
55, 717 (1991); Bull. Russ. Acad. Sci. Phys.57, 91 (1993)
[7] S.P. Knurenko et al., JETP Lett.,83473 (2006); Nucl. Phys. B (Proc. Suppl.)15192 (2006); Nucl. Phys. B (Proc. Suppl.)175, 201 (2008); JETP Lett.
86, 621 (2008)
[8] A.A. Ivanov, Dokl. Phys.52, 423 (2007)
[9] A.A. Ivanov, S.P. Knurenko, I.Ye. Sleptsov, New J Phys.11, 065008 (2009)
[10] S.P. Knurenko, A.V. Sabourov, EPJ Web of Conf.53, 07006 (2013)
[11] R. Ulrich et al. (PAO Collaboration), PoS(ICRC2015)401
[12] J. Alvarez-Muniz et al., Phys. Rev. D66, 123004 (2002)
[13] A.A. Ivanov, PoS(ICRC2017) 550 [14] I. Petrov et al., PoS(ICRC2017) 331 [15] R.U. Abbasi et al., astro-ph/1801.09784
[16] S.P. Knurenko et al., Nucl. Inst. Meth. A866, 230 (2017)
[17] A.V. Sabourov et al., PoS(ICRC2017) 552 [18] S.P. Knurenko, A.V. Sabourov, Izv. RAN ser. fiz.
78, 324 (2014)
[19] S.P. Knurenko et al., EPJ Web of Conf.99, 04001 (2015)
[20] A.A. Ivanov, JETP Lett. 91, 209 (2010); ApJ
712, 746 (2010)
[21] A.V. Glushkov, A.V. Sabourov, JETP Lett. 98, 655 (2013)
[22] S. Knurenko, I. Petrov, EPJ Web of Conf. 99, 04003 (2015)
[23] A.V. Glushkov et al., JETP Lett.87, 190 (2008) [24] A.A. Ivanov, ApJ804, 122 (2015)
[25] R.U. Abbasi et al., ApJL 790, L21(2014) [26] S.P. Knurenko, I.S. Petrov, JETP Lett.107, 709
(2018)
[27] A.V. Glushkov et al., Phys. Rev. D 82 041101 (2010)
[28] A.A. Ivanov et al., Nucl. Inst. Meth. A772, 34 (2015)