The
τ
-model of Bose-Einstein Correlations: Some recent results
Wesley J. Metzger1,a
1IMAPP, Radboud University, 6525 AJ Nijmegen, The Netherlands
Abstract. Bose-Einstein correlations of pairs of identical charged pions produced in hadronic Z decays and in 7 TeV pp minimum bias interactions are investigated within
the framework of theτ-model.
1 Introduction
After a brief review of relevant previous results, newpreliminaryresults are presented on the
depen-dence of the Bose-Einstein correlation function on track and jet multiplicity, pair transverse momen-tum and pair rapidity, using a parametrization which has been found [1] to describe well Bose-Einstein
correlations in hadronic Z decay, namely that of theτ-model [2, 3].
1.1 Parametrization
The Bose-Einstein correlation function,R2, is often parametrized as
R2=γ
1+λexp−(rQ)2(1+Q), (1)
and is measured byR2(Q) = ρ(Q)/ρ0(Q), where ρ(Q) is the density of identical boson pairs with
invariant four-momentum differenceQ= −(p1−p2)2andρ0(Q) is the similar density in an
artifi-cially constructed reference sample, which should differ from the data only in that it does not contain
the effects of Bose symmetrization of identical bosons.
However, the “classic” parametrization of Eq. (1) is found to be inadequate, even when it is gen-eralized to allow for a Lévy distribution of the source:
R2=γ1+λexp (−(rQ)α)(1+Q), 0< α≤2 (2)
This was not realized for a long time because the correlation function was only plotted up toQ =
2 GeV or less. In Ref. [1]Qwas plotted to 4 GeV, and it became apparent that there is a region of
anti-correlation (R2 <1) extending from aboutQ=0.5 to 1.5 GeV. This anti-correlation, which one
might term Bose-Einstein Anti-Correlations (BEAC), as well as the Bose-Einstein correlations (BEC)
are well described by theτ-model.
In theτ-modelR2is found to depend not only onQ, but also on quantitiesa1anda2. For two-jet
eventsa=1/mt, wheremt= m2+p2t is the transverse mass of a particle). Parameters of the model
α
the index of stability of the Lévy distribution; a width parameterΔτ; and the proper timeτ0at which
particle production begins.
We shall use a simplified parametrization [1] whereτ0is assumed to be zero anda1 anda2 are
combined withΔτto form an effective radiusR:
R2(Q)=γ
1+λcos(RaQ)2α
exp−(RQ)2α(1+Q), (3a)
R2aα=tan
απ
2
R2α. (3b)
Note that the difference between the parametrizations of Eqs. (2) and (3) is the presence of the cosine
term, which provides the description of the anti-correlation. The parameterRdescribes the BEC peak,
andRadescribes the anti-correlation region. While one might have had the insight to add,ad hoc, a
cos term to Eq. (2), it is theτ-model which provides a physical reason for it and which predicts a
relationship, Eq. (3b), betweenRandRa.
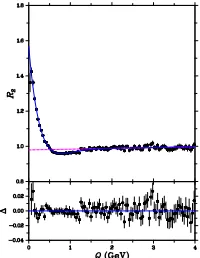
Figure 1.The Bose-Einstein
cor-relation function R2 for two-jet
events. The curve corresponds to the fit of Eq. (3). Also plotted is
Δ, the difference between the fit
and the data. The dashed line rep-resents the long-range part of the
fit,i.e.,γ(1+Q). The figure is
taken from Ref. [1].
A fit of Eq. (3) tol3two-jet events is shown in Fig. 1, from
which it is seen that theτ-model describes both the BEC peak
and the BEAC dip quite well. Also the three-jet data is well
described [1], which is perhaps surprizing since theτ-model is
inspired by a picture of fragmentation of a single string.
It must also be pointed out that theτ-model has its
short-comings: The τ-model predicts that R2 depends on the
two-particle momentum difference only through Q, not through
components ofQ. However, this is found not to be the case [1].
Nevertheless, regardless of the validity of theτ-model, Eq. (3)
provides a good description of the data. Accordingly, we shall use it in most of the following.
1.2 Data
The e+e− data were collected by the l3 detector at a
center-of-mass energy of √s91.2 GeV. Approximately 36 million
like-sign pairs of well-measured charged tracks from about 0.8 million hadronic Z decays are used. This data sample is identi-cal to that of Ref. [1]. The same event mixing technique is used
to constructρ0as in Ref. [1].
The minimum-bias pp data were collected by theatlasdetector at a center-of-mass energy of √s=
7 TeV. The sample contains approximately 1.8×10⁹like-sign charged track pairs from approximately
107 events. The acceptance in pseudorapidity is|η|<2.5. This data sample is identical to the 7 TeV
sample used in the recentatlaspaper on BEC [4]. However the new results reported here, which
are taken from a Ph.D. thesis [5], use, unless otherwise stated, a reference sample constructed by
the opposite-hemisphere (OHP) method where the three-momentum,pof one of the particles of the
pair is replaced by−p. The recentatlaspaper [4] used unlike-sign pairs to constructρ0, which is
unsuitable for studying the region of anti-correlation, since theρ0meson is a dominant feature there.
The Durham andjadealgorithms are used to classify e+e−events according to the number of jets.
The number of jets in a particular event depends on the jet resolution parameter of the algorithm,ycut.
We defineyD23 (yJ23) as the value ofycut at which the number of jets in the event changes from two
to three using the respective algorithms. Smally23corresponds to narrow two-jet events, largey23 to
(Q)2 R 1 1.1 1.2 1.3 1.4 1.5 1.6 1.7
= 7 TeV s Data 2010
2
≥ ch
20 MeV, n
≥
100 MeV, Q
≥ T
p (a)
data WF Gaussian fit WF Exponential fit
vy fit e WF L QO Gaussian fit QO Exponential fit Tau model fit
free a Tau model fit, R
Q [GeV] 0 0.2 0.4 0.6 0.8 1 1.2 1.4 1.6 1.8 2
∈ -30 -20 -10 0 10 Q [GeV]
0 0.05 0.1 0.15
1.1 1.2 1.3 1.4 1.5 1.6 1.7 (b) Q [GeV] 0 0.2 0.4 0.6 0.8 1 1.2 1.4 1.6 1.8 2 0.98 0.985 0.99 0.995 1 .005 1.01 (c)
Figure 2.R2for 7 TeV pp minimum bias interactions with the results of fits of several parametrizations [5].
2 New
Preliminary
Results
> ch < n 0 20 40 60 80 100
R [fm]
1 1.5 2 2.5
3 pT≥ 100 MeV, Q ≥ 20 MeV
2 ULS R 2 ROT R 2 OHP R 2 MIX R [MeV] T k 100 200 300 400 500 600 700 800 900
R [fm] 1 1.5 2 2.5 3 3.5
4 pT≥ 100 MeV, Q ≥ 20 MeV, nch≥ 2
2 ULS R 2 ROT R 2 OHP R 2 MIX R
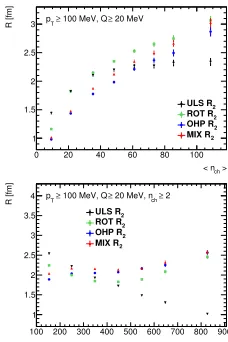
Figure 3. The dependence of
R (top) on N and (bottom) on
kt with respect to the beam axis
for different reference samples in
7 TeV pp minimum bias events. The exponential parametrization is used [5].
As in e+e− annihilation [1] , the pp minimum bias data
are found [5] to be best described by Eq. (3a). While
other parametrizations can describe the BEC peak, only this
parametrization (withRaa free parameter) comes close to
de-scribing not only the BEC peak but also the BEAC region, as
is seen in Fig. 2. Previously,cmshad also observed the BEAC
and fit it with theτ-model parametrization [6].
As has frequently been pointed out (see,e.g., Ref. [7]) the
values of the parameters of BEC depend strongly on the choice of reference sample. This is seen again in Fig. 3, where the
dependence ofRon the charged track multiplicity, N, and on
the average pair transverse momentum,kt = (pt1+pt2)/2, is
shown for the exponential parametrization ofR2,i.e., Eq. 2 with
α=1, which is the parametrization used in theatlaspaper [4].
The dependences with unlike-sign (ULS) reference sample are
markedly different from those with the other samples. Whereas
Rincreases somewhat less than linearly withN for the other
reference samples, it appears to saturate for the ULS sample.
And, whereasR decreases approximately linearly withkt for
the ULS sample, for the rotated reference sample it decreases
only up tokt ≈ 450 MeV and then increases, and for the other reference samples it is first roughly
constant withktand then increases.
[MeV]
T
k 0 200 400 600 800 1000
R [fm] -20 0 20 40 60 80
100 pT≥ 100 MeV, Q ≥ 20 MeV, nch≥ 2
Figure 4.The dependence ofRonktfor e+e−(top) and pp (bottom).
The e+e− results are shown for various selections onyJ
23. Theτ
-model parametrization is used withRaa free parameter.
An unfortunate property of
theτ-model parameterization is
that the estimates of α, R, and
Rafrom the fits tend to be highly
correlated. Therefore, when
studying the dependence ofRon
quantities such asNorkt, in
or-der to stabilize the fitsαis fixed
de-t a
given by Eq. (3b) for e+e−and a free parameter for pp).
The dependence ofRonkt with respect to the thrust axis for e+e−and with respect to the beam
axis for pp is shown in Fig. 4 for theτ-model parametrization withRaa free parameter is shown in
Fig. 4. The behavior of two-jet e+e−seems similar to pp, although the error bars are large.
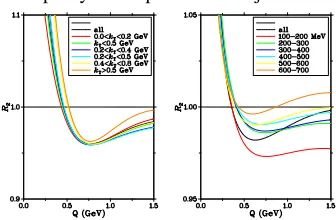
Figure 5. R obtained in fits of Eq. (3) for various rapidity and
yD
23intervals.
For both e+e− and pp, Ris found [5, 7] to increase with
multiplicity (not shown). Further, for e+e− R is found [7] to
increase with ‘jettiness’, as measured byy23.
In e+e−,Ris also found to depend on the rapidity of the pair,
as shown in Fig. 5. Here the rapidity,yE, is defined with respect
to the thrust axis with the positive thrust axis chosen to be in
the same hemisphere as the most energetic jet. ThenyE > 1
selects almost always tracks from the most energetic quark jet,
andyE<−1 selects mostly tracks from the other quark jet with
the contribution of tracks from the gluon jet increasing asy23
increases,i.e., as the events become more three-jetlike. The
intermediateyEregion contains tracks from the gluon jet and low-energy tracks from both quark jets.
One observes thatR is roughly independent ofy23 for yE > 1. This value ofR is also found for
yE <−1 in the case of two-jet events. These are the situations of ‘pure’ quark jets. Asy23 increases
RforyE < −1 also increases, reflecting the increasing contribution of tracks from the gluon. The
region−1 < yE <1 has a larger value ofRfor two-jet events, and this value increases withy23. For
three-jet events, where the gluon contributes to both−1 < yE <1 andyE <−1, the values ofRare
approximately equal.
As mentioned above, theτ-model is known to break down. In theτ-modelR2depends onQ, and
not on components ofQ. This was tested in Ref. [1]. In Eq. (3)R2Q2is replaced byR2
LQ2L+R2sideQ2side+
R2
outQ2outand fits for two-jet events performed in the LCMS. Different values were found forRL,Rout,
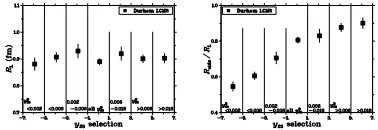
andRside. Here results are shown in Fig. 6 forRLandRsidefor various selections ofyD23. One sees that
RLis independent ofy23, whileRsideincreases with ‘jettiness’. Thus the increase inRoccurs mainly
in the transverse plane. This is consistent with the increase inRbeing due to the increasing hardness
of the gluon, which was seen in the rapidity dependence above.
Figure 6. RLandRside/RLobtained in fits of Eq. (3) for
various rapidity andyD
23intervals.
A large source of systematic uncer-tainty on the parameter values is the range
of Q over which the fit is performed. A
higher upper limit, QU, of the fit range
gives more data to determine the
base-line, which in turn affects the values of
the parameters describing BEC and BEAC.
Clearly,QUshould be chosen well beyond
the anti-correlation region. Fig. 7 and
Ta-ble 1 show this effect. The values of the parameters change drastically when the upper limit, QU,
is increased from 2 to 3 GeV. AsQUis further increased the change is less, but still large. Clearly
the parametrization does not fully describe the data. Nevertheless, it is much better than all the other
parametrizations that were tried. It is also worth noting that the value ofαis quite different from the
valueα=0.41±0.02+0.04
(Q)2
R
1 1.1 1.2 1.3 1.4 1.5 1.6 1.7
= 7 TeV s Data 2010
2
≥
ch
20 MeV, n
≥
100 MeV, Q
≥
T
p (a)
data 2 GeV
≤
fit for Q 3 GeV
≤
fit for Q 4 GeV
≤
fit for Q 5 GeV
≤
fit for Q
Q [GeV]
0 1 2 3 4 5
∈
-6 -4 -2 0 2 4 6 8
Q [GeV]
0 0.05 0.1 0.15 0.2
1.1 1.2 1.3 1.4 1.5 1.6 1.7
(b)
Q [GeV]
0 1 2 3 4 5
0.98 0.985 0.99 0.995 1 1.005 1.01
(c)
Figure 7.Fits of Eq. (3a), withRaa free parameter, to 7 TeV minimum bias data for various choices ofQU[5].
Table 1.Results of fits of Eq. (3a), withRaa free parameter, for various choices ofQU[5].
QU 2 GeV 3 GeV 4 GeV 5 GeV
α 0.108±0.001 0.186±0.005 0.235±0.003 0.261±0.003
R(fm) 17.8±0.7 6.7±0.5 4.1±0.2 3.3±0.1
Ra(fm) 43.4±1.2 3.0±0.2 1.80±0.04 1.52±0.02
λ 3.08±0.05 1.91±0.10 1.36±0.05 1.15±0.03
3 BEAC in more detail
Figure 8.The result of fits of Eq. (3a) to (left)
e+e−two-jet (yJ
23<0.023) and (right) pp
min-imum bias data for various intervals of
multi-plicity, observed in the case of e+e−and
cor-rected in the case of pp.
In the τ-model BEAC arises through the
corre-lation of coordinate space and momentum space. Recently, another explanation has been proposed, namely the non-zero size of the pion [8, 9]. A detailed investigation of the BEAC region seems therefore warranted, in the hope of distinguishing between these explanations.
Since fits of Eq. (3a), with Ra a free
parame-ter, provide a reasonable description of the anti-correlation region, they are used to show how
BEAC depend on ‘jettiness’ in e+e− and to
com-pare the dependence of BEAC on multiplicity and
ktin two-jet e+e−and pp minimum bias events.
Fig. 8 shows the dependence of the BEAC on track multiplicity. The anti-correlation dip is deeper
and at somewhat higherQfor two-jet e+e−than for pp. With increasingNthe minimum moves to
lowerQ; this effect is larger in pp than in e+e−. The dip also becomes less deep asNincreases, an
effect also noticed bycms[6].
Fig. 9 shows the dependence of the BEAC onyJ
23. It is seen that the anti-correlation dip becomes
deeper and its minimum moves slighlty lower inQas the ‘jettiness’ increases, i.e., as one moves from
two- to three-jet events.
Fig. 10 shows the dependence of the BEAC onkt. Little dependence is seen for two-jet e+e−data.
For pp minimum bias data, the depth of the dip decreases withkt, but the position of the minimum is
4 Conclusions
Figure 9. The result
of fits of Eq. (3) to e+e−
for various yJ
23
selec-tions.
Theτ-model, which is closely related to the string picture, provides a
reasonable explanation of both the BEC peak and the BEAC dip in both
e+e− and minimum bias pp interactions. Of all the parametrizations
tried, only that of theτ-model survives as a candidate to explain the data.
Another possible explanation is that the anti-correlation arises because of the non-zero size of the pion. To discover which of these explanations (or what combination of them) is the best explanation requires detailed investigation of both BEC and BEAC.
RandRa are found to depend on track multiplicity and transverse
momentum in both pp and e+e−and on jets and rapidity in e+e−. What
more does it depend on? If the BEAC are due to the correlation between
coordinate space and momentum space, as in theτ-model, it is
reason-able that the dependence on jet structure, as seen in e+e−, occurs. Then one would also expect similar
dependences in pp. This possibility makes the study of BEC (and BEAC) in jet events interesting. One might also expect a rapidity dependence in minimum bias events, as the number of strings involved or the presence of color reconnection may vary with rapidity. On the other hand, it is not clear (at least
to me) why the effect of the pion size should depend on either rapidity or the presence of a jet.
Figure 10.The result of fits of Eq. (3a) to (left)
e+e−two-jet (yJ
23<0.023) and (right) pp
mini-mum bias data for various intervals ofkt.
In studying these correlations, the reference
sample used plays a crucial role. The use of
an unlike-sign reference sample is not possible in studying BEAC. Further, the upper limit of the fit range must be well above the BEAC region. It is
very difficult, if not impossible, to compare
quan-titatively the results using different reference
sam-ples. It would therefore be useful if thelhc
ex-periments could agree on a standard method of constructing the reference sample, and give results using this standard method as well as any other method deemed superior. This is especially
im-portant to investigate,e.g., dependence on rapidity,
where the acceptances of the experiments are very different,e.g.,lhcbandatlas,cms,alice.
References
[1] L3 Collab., P. Achard,et al., Eur. Phys. J.C71, 1648 (2011)
[2] T. Csörg˝o, J. Zimányi, Nucl. Phys.A517, 588 (1990)
[3] T. Csörg˝o, W. Kittel, W. Metzger, T. Novák, Phys. Lett.B663, 214 (2008)
[4] ATLAS Collab., G. Aad,et al., Eur. Phys. J.C75, 466 (2015),1502.07947
[5] R. Astaloš, Ph.D. thesis, Radboud University (2015),http://hdl.handle.net/2066/143448
[6] CMS Collab., V. Khachatryan,et al., JHEP5, 29 (2011),1101.3518
[7] Wesley J. Metzger, EPJ Web of Conferences90, 01006 (2015),arXiv:1411.3898
[8] A. Białas, K. Zalewski, Phys. Lett.B727, 182 (2013),1309.6169
![Figure 7. Fits of Eq. (3a), with Ra a free parameter, to 7 TeV minimum bias data for various choices of QU [5].](https://thumb-us.123doks.com/thumbv2/123dok_us/8158492.1361010/5.482.43.445.80.189/figure-fits-free-parameter-tev-minimum-various-choices.webp)