Two-baryon systems from HAL QCD method
and the mirage in the temporal correlation of the direct method
TakumiIritani1for HAL QCD Collaboration
1Theoretical Research Division, Nishina Center, RIKEN, Wako 351-0198, Japan
Abstract.Both direct and HAL QCD methods are currently used to study the hadron interactions in lattice QCD. In the direct method, the eigen-energy of two-particle is measured from the temporal correlation. Due to the contamination of excited states, however, the direct method suffers from the fake eigen-energy problem, which we call the “mirage problem,” while the HAL QCD method can extract information from all elastic states by using the spatial correlation. In this work, we further investigate systematic uncertainties of the HAL QCD method such as the quark source operator dependence, the convergence of the derivative expansion of the non-local interaction kernel, and the single baryon saturation, which are found to be well controlled. We also confirm the consistency between the HAL QCD method and the Lüscher’s finite volume formula. Based on the HAL QCD potential, we quantitatively confirm that the mirage plateau in the direct method is indeed caused by the contamination of excited states.
1 Introduction
To study the hadron interactions in lattice QCD, both the direct method [1] and the HAL QCD method [2] are employed. In the previous studies at heavier quark masses, however, both dineutron and deuteron are bound in the direct method [3–11], while they are unbound in the HAL QCD method [12,13].
In the series of papers [14–17], we pointed out that the discrepancies come from the misidentifi-cation of the energy eigenstate (“mirage” of the true plateau) in the direct method due to the contam-ination of excited (scattering) states. The manifestation of this problem can be exposed by a “sanity (consistency) check” [16,17] using the Lüscher’s formula [18] and source/sink operator dependences
of the plateaux [14–16]. These symptoms in the previous studies by the direct method [3–11] cast serious doubt on their conclusions.
In this work, we investigate the reliability of the HAL QCD method, and show that systematic uncertainties are under control. We also reveal the origin of the fake plateau in the temporal correlator quantitatively, and demonstrate that correct plateaux emerge for both the ground and the 1st excited states if temporal correlation functions are projected to eigenstates of the HAL QCD potential.
Table 1.The gauge configurations and parameters.
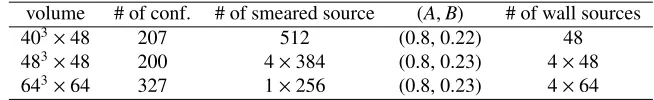
volume # of conf. # of smeared source (A,B) # of wall sources 403×48 207 512 (0.8, 0.22) 48
483×48 200 4×384 (0.8, 0.23) 4×48
643×64 327 1×256 (0.8, 0.23) 4×64
2 Time-dependent HAL QCD method
2.1 Formalism
In the time-dependent HAL QCD method [13], one measures the Nambu-Bethe-Salpeter correlation function given by
R(r,t)≡ 0|T
B(x+r,t)B(x,t)J(0)|0
{GB(t)}2
=
n
AnψWn(r)e−(Wn−2mB)t+O
e−(Wth−2mB)t (1)
with a source operatorJ,n-th energy eigenvalueWn, the inelastic thresholdWth, single baryon
corre-latorGB(t) and the baryon massmB. With elastic saturation,R(r,t) satisfies
1
4mB
∂2 ∂t2 −
∂ ∂t −H0
R(r,t)=
drU(r, r)R(r,t) (2)
whereU(r, r) is the non-local interaction kernel. Using the velocity expansion in the spin-singlet
S-wave channel,U(r, r)Veff(r)δ(r−r), the effective leading order (central) potential is defined by
Veff(r)=
1 4mB
(∂/∂t)2R(r,t)
R(r,t) −
(∂/∂t)R(r,t)
R(r,t) −
H0R(r,t)
R(r,t) . (3)
Considering the higher order term asU(r, r) {VLO(r)+VNLO(r)∇2}δ(r−r), it leads to
1 4mB
∂2R(r,t) ∂t2 −
∂R(r,t)
∂t −H0R(r,t)=VLO(r)R(r,t)+VNLO(r)∇2R(r,t), (4)
where the leading order (VLO(r)) and next leading order (VNLO(r)) potentials are obtained by solving
linear equations with severalR(r,t).
2.2 Source dependence of HAL QCD method and the next leading order potential
First, we discuss the quark source dependence of the HAL QCD method. We use 2+1 flavor QCD
configurations in Ref. [4], which are the Iwasaki gauge action andO(a)-improved Wilson quark action ata = 0.08995(40) fm, wheremπ = 0.51 GeV,mN = 1.32 GeV, andmΞ =1.46 GeV. We employ
both the wall sourceqwall(t)=
yq(y,t) and the smeared sourceqsmear(x,t)=y f(|x−y|)q(y,t) with
f(r)≡Ae−Br, 1, 0 for 0<r<(L−1)/2,r=0, (L−1)/2 ≤r, respectively, whose parametersA,B
are the same as those in Ref. [4]. The number of the configurations and simulation parameters are summarized in Table1.
In this work, we focus onΞΞ(1S0) channel, which has smaller statistical errors and belongs to
the same representation asNN(1S0) in the flavor SU(3) limit. The upper panels in Fig.1show the
Table 1.The gauge configurations and parameters.
volume # of conf. # of smeared source (A,B) # of wall sources
403×48 207 512 (0.8, 0.22) 48
483×48 200 4×384 (0.8, 0.23) 4×48
643×64 327 1×256 (0.8, 0.23) 4×64
2 Time-dependent HAL QCD method
2.1 Formalism
In the time-dependent HAL QCD method [13], one measures the Nambu-Bethe-Salpeter correlation function given by
R(r,t)≡ 0|T
B(x+r,t)B(x,t)J(0)|0
{GB(t)}2
=
n
AnψWn(r)e−(Wn−2mB)t+O
e−(Wth−2mB)t (1)
with a source operatorJ,n-th energy eigenvalueWn, the inelastic thresholdWth, single baryon corre-latorGB(t) and the baryon massmB. With elastic saturation,R(r,t) satisfies
1
4mB
∂2 ∂t2 −
∂ ∂t −H0
R(r,t)=
drU(r, r)R(r,t) (2)
whereU(r, r) is the non-local interaction kernel. Using the velocity expansion in the spin-singlet
S-wave channel,U(r, r)Veff(r)δ(r−r), the effective leading order (central) potential is defined by
Veff(r)=
1 4mB
(∂/∂t)2R(r,t) R(r,t) −
(∂/∂t)R(r,t) R(r,t) −
H0R(r,t)
R(r,t) . (3)
Considering the higher order term asU(r, r) {VLO(r)+VNLO(r)∇2}δ(r−r), it leads to
1 4mB
∂2R(r,t) ∂t2 −
∂R(r,t)
∂t −H0R(r,t)=VLO(r)R(r,t)+VNLO(r)∇2R(r,t), (4) where the leading order (VLO(r)) and next leading order (VNLO(r)) potentials are obtained by solving
linear equations with severalR(r,t).
2.2 Source dependence of HAL QCD method and the next leading order potential
First, we discuss the quark source dependence of the HAL QCD method. We use 2+1 flavor QCD configurations in Ref. [4], which are the Iwasaki gauge action andO(a)-improved Wilson quark action ata = 0.08995(40) fm, wheremπ = 0.51 GeV,mN = 1.32 GeV, andmΞ = 1.46 GeV. We employ
both the wall sourceqwall(t)=
yq(y,t) and the smeared sourceqsmear(x,t)=y f(|x−y|)q(y,t) with
f(r) ≡Ae−Br, 1, 0 for 0<r<(L−1)/2,r =0, (L−1)/2 ≤r, respectively, whose parametersA,B
are the same as those in Ref. [4]. The number of the configurations and simulation parameters are summarized in Table1.
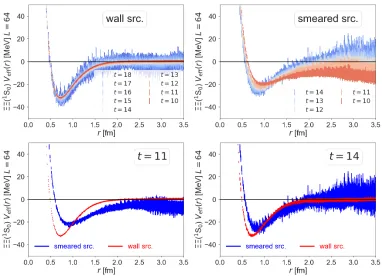
In this work, we focus onΞΞ(1S0) channel, which has smaller statistical errors and belongs to the same representation asNN(1S0) in the flavor SU(3) limit. The upper panels in Fig.1show the effective leading order potentialVeff(r) from the wall and smeared sources atL=64, respectively. For
Figure 1. The effective leading order potentialVeff(r) from the wall source and the smeared source at varioust.
the wall source, the potentials are almost unchanged fromt=10 tot=18, while the results from the smeared source show significanttdependence. The lower panels in Fig.1are comparisons between the two att=11 and 14. The results imply thatVesmearff (r) tends to approach toVewallff (r) astincreases, while there remain small discrepancies even att=14.
The small difference between Vewallff (r) andVesmearff (r) indicates the existence of the next leading order correction in the derivative expansion of the non-local kernelU(r, r). Fig.2shows the (next)
leading order potentialVLO(r) (VNLO(r)), which are obtained by usingRwall(r,t) andRsmear(r,t). The effective leading potential from the wall source is almost identical with the leading order potential as shown in Fig.2(Left), while in the smeared source, the next leading order correction to the potential, [VNLO(r)∇2R(r,t)]/R(r,t), cannot be neglected.
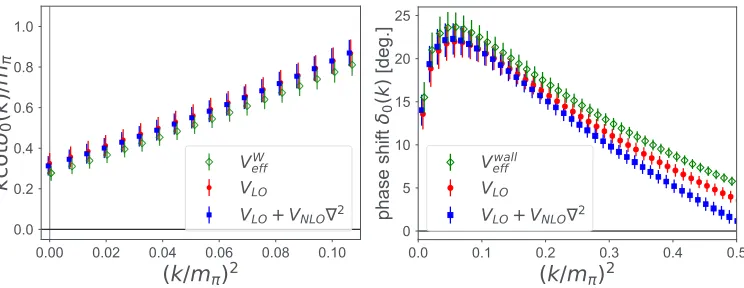
Fig.3shows the scattering phase shifts usingVwall
eff (r),VLO(r), andVLO(r)+VNLO(r)∇2. These
phase shifts suggest thatΞΞ(1S0) is an attractive but an unbound channel atmπ = 0.51 GeV. As
shown in Fig.3(Left), at lower energies, these potentials give the consistent results within statistical error. The NLO correction appears only at higher energies (see Fig.3(Right)). These results show that (i) the derivative expansion of the non-local kernel has good convergence and the corresponding systematic uncertainty can be controlled (ii) the effective leading order potential from the wall source is reliable at low energies in this system.
Figure 2. (Left) The effective leading order potential of the wall source, and the leading order potential. (Right)
The next leading order potential.
Figure 3. The scattering phase shifts usingVwall
eff ,VLOandVLO+VNLO∇2. (Left)kcotδ0(k) (Right)δ0(k).
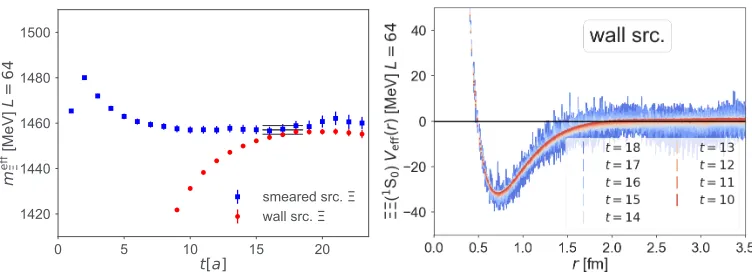
two-baryon systems [20,21]1. Fig.4(Left) shows the effective masses of the single baryon from the
smeared and the wall sources. Although the ground state saturation of the wall source is slower than that of the smeared source, the results from both sources converge aroundt 16. (Even at a much earlier time,t=10, the difference of the effective mass between the two is as small as 2%.) As shown in Fig.4(Right) (the same figure as in Fig.1), we confirm that the wall source potentials at differentt are consistent with each other including the time slices att16, and thus the systematic errors from the single baryon saturation are well under control. This also indicates that the contaminations from the single baryon excited states are almost canceled in the potential at early time slices.
Figure 2. (Left) The effective leading order potential of the wall source, and the leading order potential. (Right)
The next leading order potential.
Figure 3. The scattering phase shifts usingVwall
eff ,VLOandVLO+VNLO∇2. (Left)kcotδ0(k) (Right)δ0(k).
two-baryon systems [20,21]1. Fig.4(Left) shows the effective masses of the single baryon from the
smeared and the wall sources. Although the ground state saturation of the wall source is slower than that of the smeared source, the results from both sources converge aroundt 16. (Even at a much earlier time,t=10, the difference of the effective mass between the two is as small as 2%.) As shown in Fig.4(Right) (the same figure as in Fig.1), we confirm that the wall source potentials at differentt are consistent with each other including the time slices att16, and thus the systematic errors from the single baryon saturation are well under control. This also indicates that the contaminations from the single baryon excited states are almost canceled in the potential at early time slices.
1We note that the validity of the wall source is independent of the correctness of the measurement from the smeared source. In addition, even within the smeared source, a good ground state saturation in a single baryon correlator does not guarantee at all a good ground state saturation in a two-baryon correlator.
Figure 4. (Left) The effective mass of the single baryon (Ξ). (Right) The effective leading order potential of the
wall source fromt=10 tot=18.
2.3 Consistency between the Lüscher’s finite volume method and the HAL QCD method Next, we discuss the consistency between the HAL QCD potential and the Lüscher’s finite vol-ume formula [18], which extracts the scattering phase shift from the energy shift in the finite box. Fig.5(Left) shows the volume dependence of the lowest eigenvalue of the finite volume Hamiltonian H = H0+Vewallff (r). These spectra are proportional to 1/L3and converge to zero within error in the infinite volume limit. This volume dependence of the lowest energy strongly supports an absence of the bound state, which is consistent with the phase shift analysis by the HAL QCD method in Fig.3.
We next calculate the scattering phase shift using the Lüscher’s finite volume formula
kcotδ0(k)= 1 πL
n∈Z3
1
|n|2−(kL/2π)2, (5)
wherekis given by∆EL = 2
k2+m2
B−2mB. Fig.5(Right) showskcotδ0(k) as a function ofk2 using the ground state energy on three volumes and the 1st excited state energy onL = 64, which are compared withkcotδ0(k) in the infinite volume calculated from the HAL QCD potential (pink band). We here confirm not only a consistency between the two methods but also a smooth behavior of the finite volume energy:kcotδ0(k) fork2 >0 from the finite volume energy agrees with the pink band from the potential, andkcotδ0(k) fork2 <0 by the Lüscher’s formula smoothly converges to the positive intersect atk2=0, consistent with the pink band.
3 Diagnosis of the direct method form the HAL QCD potential
Finally, we reveal the origin of the fake plateau in the direct method. Using the low-lying eigenfunc-tionsΨn(r) and eigenvalues∆En, which are obtained by solvingH=H0+Vewallff (r) in the finite box,
theR-correlator in Eq. (1) can be decomposed as
r
Rwall/smear(r,t)
r
n
awall/smear
n Ψn(r) exp(−∆Ent)=
n
bwall/smear
n exp(−∆Ent) (6)
whereawall/smear
n is determined by the orthogonality ofΨn(r). Fig.6(Left) shows the magnitude of the
Figure 5. (Left) Volume dependence of the ground state eigen-energy. (Right) The scattering phase shift using the Lüscher’s formula, and the HAL QCD potential.
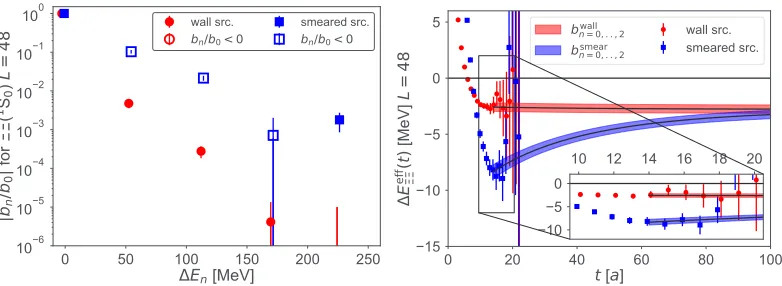
Figure 6. (Left) The contamination of the excited state|bn/b0|. Open symbols denote negative values (bn/b0 <
0). (Right) The reconstructed effective energy shifts using theree low-lying eigenstates.
represents a positive (negative) value. This quantity represents the magnitude of the contamination of the excited states inR-correlator. For example, the contamination of the 1st excited state is smaller than 1% in the wall source, while it is as large as 10% (with a negative sign) in the smeared source.
In Fig.6(Right), we show the reconstructed effective energy shift using three low-lying modes for both wall and smeared sources, which is given by
∆Ewalleff /smear(t)=log
2
n=0b
wall/smear
n exp(−∆Ent)
2
n=0bwalln /smearexp(−∆En(t+1))
. (7)
Figure 5. (Left) Volume dependence of the ground state eigen-energy. (Right) The scattering phase shift using the Lüscher’s formula, and the HAL QCD potential.
Figure 6. (Left) The contamination of the excited state|bn/b0|. Open symbols denote negative values (bn/b0<
0). (Right) The reconstructed effective energy shifts using theree low-lying eigenstates.
represents a positive (negative) value. This quantity represents the magnitude of the contamination of the excited states inR-correlator. For example, the contamination of the 1st excited state is smaller than 1% in the wall source, while it is as large as 10% (with a negative sign) in the smeared source.
In Fig.6(Right), we show the reconstructed effective energy shift using three low-lying modes for both wall and smeared sources, which is given by
∆Ewalleff /smear(t)=log
2
n=0b
wall/smear
n exp(−∆Ent)
2
n=0bwalln /smearexp(−∆En(t+1))
. (7)
It well reproduces the (fake) plateaux-like behavior in the direct method aroundt = 15. We can estimate that aboutt∼100a∼10 fm is required for the smeared source to reach the correct ground state.
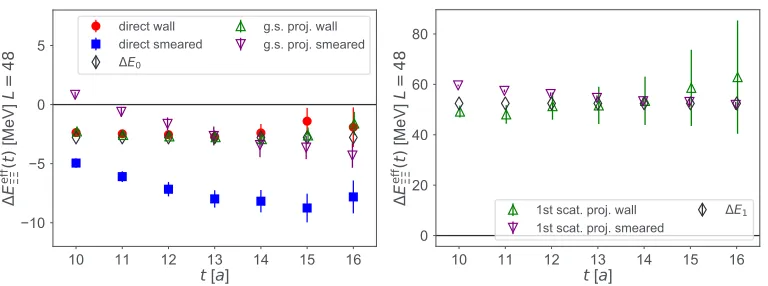
Figure 7. The effective energy shift using the ground state (left) and 1st excited state (right) projected correlators.
Finally, we demonstrate reliability of eigenstates of the HAL QCD potential, using the projected effective energy shift defined by
∆E(enff) =log R (n)(t)
R(n)(t+1), (8)
whereR(n)(t)≡
rΨn(r)R(r,t) with the eigenfunctionΨn(r). Fig.7shows projected effective energy shifts for the ground and 1st excited states, which give source independent plateaux consistent with eigenenergies∆E0,1 within statistical errors. This demonstration establishes the correctness of the HAL QCD potential in this case, since its (finite volume) eingenenergies are faithful to the finite volume energies. Moreover, once correct eigenstates are obtained from the potential, we can construct correlation functions projected to these eigenstates, whose plateaux agree with correct eigenenergies even at rather smallt.
4 Summary
In this paper, we have established reliability of the HAL QCD method by checking systematic un-certainties. Unlike the direct method, the time-dependent HAL QCD method is free from the elastic state contamination in two-baryon systems, and source dependence can be controlled in the derivative expansion. We have also shown the convergence of the derivative expansion in the non-local kernel, and the next leading order correction is negligible at low energies.
We have revealed that the fake plateau in the direct method is caused by the contaminations from low-lying elastic excited states, and established that finite volume eigenenergies from the HAL QCD potential agree with effective energies of projected correlation functions.
Acknowledgements
References
[1] T. Yamazaki, PoS LATTICE2014(2015) 009 [arXiv:1503.08671 [hep-lat]], and the references therein.
[2] N. Ishii, S. Aoki and T. Hatsuda, Phys. Rev. Lett.99(2007) 022001 [nucl-th/0611096].
[3] T. Yamazakiet al.[PACS-CS Collaboration], Phys. Rev. D84, 054506 (2011) [arXiv:1105.1418 [hep-lat]].
[4] T. Yamazaki, K. i. Ishikawa, Y. Kuramashi and A. Ukawa, Phys. Rev. D 86 (2012) 074514 [arXiv:1207.4277 [hep-lat]];
[5] T. Yamazaki, K. i. Ishikawa, Y. Kuramashi and A. Ukawa, Phys. Rev. D92(2015) 1, 014501 [arXiv:1502.04182 [hep-lat]].
[6] S. R. Beaneet al.[NPLQCD Collaboration], Phys. Rev. D85, 054511 (2012) [arXiv:1109.2889 [hep-lat]].
[7] S. R. Beaneet al.[NPLQCD Collaboration], Phys. Rev. D87, 034506 (2013) [arXiv:1206.5219 [hep-lat]].
[8] S. R. Beaneet al.[NPLQCD Collaboration], Phys. Rev. C88, 024003 (2013) [arXiv:1301.5790 [hep-lat]].
[9] K. Orginos, A. Parreno, M. J. Savage, S. R. Beane, E. Chang and W. Detmold, Phys. Rev. D92, 114512 (2015) [arXiv:1508.07583 [hep-lat]].
[10] E. Berkowitz, T. Kurth, A. Nicholson, B. Joo, E. Rinaldi, M. Strother, P. M. Vranas and A. Walker-Loud, Phys. Lett. B765, 285 (2017) [arXiv:1508.00886 [hep-lat]].
[11] M. L. Wagman, F. Winter, E. Chang, Z. Davoudi, W. Detmold, K. Orginos, M. J. Savage and P. E. Shanahan, arXiv:1706.06550 [hep-lat].
[12] S. Aokiet al.[HAL QCD Collaboration], PTEP2012(2012) 01A105 [arXiv:1206.5088 [hep-lat]].
[13] N. Ishiiet al.[HAL QCD Collaboration], Phys. Lett. B712(2012) 437 [arXiv:1203.3642 [hep-lat]].
[14] T. Iritani [HAL QCD Collaboration], PoS LATTICE2015(2016) 089 [arXiv:1511.05246 [hep-lat]].
[15] T. Iritaniet al., JHEP1610(2016) 101 [arXiv:1607.06371 [hep-lat]].
[16] T. Iritani et al., Phys. Rev. D 96, no. 3, 034521 (2017) doi:10.1103/PhysRevD.96.034521
[arXiv:1703.07210 [hep-lat]].
[17] S. Aoki, T. Doi and T. Iritani, arXiv:1707.08800 [hep-lat]. [18] M. Lüscher, Nucl. Phys. B354, 531 (1991).
[19] S. Aoki, PoS LATTICE2016(2016) 109 [arXiv:1610.09763].
[20] T. Yamazakiet al.[PACS Collaboration], PoS LATTICE2016, 108 (2017) [arXiv:1702.00541 [hep-lat]].