Sarah E. Harris, PhD
Rainer Malik, PhD
Riccardo Marioni, PhD
Archie Campbell, BSc
Sudha Seshadri, MD
Bradford B. Worrall, MD
Cathie L.M. Sudlow,
DPhil
Caroline Hayward, PhD
Mark E. Bastin, DPhil
John M. Starr, PhD
David J. Porteous, PhD
Joanna M. Wardlaw, MD
Ian J. Deary, PhD
On behalf of the
METASTROKE
Consortium
Correspondence to Dr. Harris:
Supplemental data at Neurology.org
Polygenic risk of ischemic stroke is
associated with cognitive ability
ABSTRACT
Objectives:
We investigated the correlation between polygenic risk of ischemic stroke (and its
sub-types) and cognitive ability in 3 relatively healthy Scottish cohorts: the Lothian Birth Cohort 1936
(LBC1936), the Lothian Birth Cohort 1921 (LBC1921), and Generation Scotland: Scottish
Fam-ily Health Study (GS).
Methods:
Polygenic risk scores for ischemic stroke were created in LBC1936 (n
5
1005),
LBC1921 (n
5
517), and GS (n
5
6,815) using genome-wide association study summary data
from the METASTROKE collaboration. We investigated whether the polygenic risk scores
corre-late with cognitive ability in the 3 cohorts.
Results:
In the largest cohort, GS, polygenic risk of all ischemic stroke, small vessel disease
stroke, and large vessel disease stroke, but not cardioembolic stroke, were correlated with both
fluid and crystallized cognitive abilities. The highest correlation was between a polygenic risk
score for all ischemic stroke and general cognitive ability (
r
5 2
0.070,
p
5
1.95
3
10
28). Few
correlations were identified in LBC1936 and LBC1921, but a meta-analysis of all 3 cohorts
supported the correlation between polygenic risk of ischemic stroke and cognitive ability.
Conclusions:
The findings from this study indicate that even in the absence of stroke, being at
high polygenic risk of ischemic stroke is associated with lower cognitive ability.
Neurology® 2016;86:611–618GLOSSARY
CE5cardioembolic;gf5general fluid;GS5Generation Scotland: Scottish Family Health Study;GWAS5genome-wide association study;LBC19215Lothian Birth Cohort 1921;LBC19365Lothian Birth Cohort 1936;LVD5large vessel disease;MHT5Moray House Test;NART5National Adult Reading Test;SNP5single-nucleotide polymorphism;SVD5 small vessel disease.
The common cause theory of aging predicts that a proportion of the variance in both age-related
cognitive and physical decline is attributable to common biological processes.
1Exploring the
genetic links between cognitive function and diseases, such as ischemic stroke, may provide
insight. Risk factors for cognitive decline and ischemic stroke overlap.
1,2Low cognitive ability in
youth portends a greater risk of stroke in later life.
3,4Cognitive ability in later life is determined
by cognitive ability in youth
5and rate of cognitive decline.
With the exception of an association between
APOE
and cognitive ability in later life and
age-related cognitive decline,
6,7few individual genes have reliably been associated with variance in
normal cognitive ability. However, Genome-wide Complex Trait Analyses indicates that 29%
From the Centre for Cognitive Ageing and Cognitive Epidemiology (S.E.H., R. Marioni, C.L.M.S., M.E.B., J.M.S., D.J.P., J.M.W., I.J.D.), Centre for Clinical Brain Sciences (C.L.M.S., M.E.B., J.M.W.), Medical Research Council Human Genetics Unit, Institute of Genetics and Molecular Medicine (C.H.), Alzheimer Scotland Dementia Research Centre (J.M.S.), and Department of Psychology (I.J.D.), University of Edinburgh; Medical Genetics Section (S.E.H., R. Marioni, A.C., C.L.M.S., D.J.P.), University of Edinburgh Centre for Genomic and Experimental Medicine and MRC Institute of Genetics and Molecular Medicine, Western General Hospital, Edinburgh, UK; Institute for Stroke and Dementia Research (R. Malik), Klinikum der Universität München, Ludwig-Maximilians-Universität, Munich, Germany; Queensland Brain Institute (R. Marioni), The University of Queensland, Brisbane, Australia; Department of Neurology (S.S.), Boston University School of Medicine, Framingham; The Framingham Heart Study (S.S.), Framingham, MA; and Departments of Neurology and Public Health Sciences (B.B.W.), University of Virginia, Charlottesville.
METASTROKE Consortium coinvestigators are listed on theNeurology®Web site at Neurology.org.
Go to Neurology.org for full disclosures. Funding information and disclosures deemed relevant by the authors, if any, are provided at the end of the article. The Article Processing Charge was paid by the University of Edinburgh Research Council UK Open Access Fund.
to 50% of the variance in cognition measured
at a single time
8,9and about 24% of the
variance in lifetime cognitive change
10can be
attributed to common genetic variants.
Heri-tability, calculated from genome-wide
single-nucleotide polymorphism (SNP) data, is
estimated at 38% for all ischemic stroke,
40% for large vessel disease (LVD), 33% for
cardioembolic (CE) stroke, and 16% for small
vessel disease (SVD) stroke.
11We used genome-wide association study
(GWAS) summary data from the
META-STROKE Collaboration
12to generate
poly-genic risk scores for ischemic stroke and its
subtypes, SVD, LVD, and CE, in 3 Scottish
cohorts
consisting
of
relatively
healthy
participants
—
Generation Scotland: the
Scot-tish Family Health Study (GS), Lothian Birth
Cohort 1921 (LBC1921), and Lothian Birth
Cohort 1936 (LBC1936). We investigated
whether the polygenic risk scores predicted
cognitive ability/cognitive decline in the 3
cohorts.
METHODS Cohorts.LBC1936.LBC1936 comprises 1,091 (548 men) relatively healthy older participants, most of whom took part in the Scottish Mental Survey of 1947, when they were about 11 years old.13At a mean age of 69.5 years (SD 0.8), they
were enrolled in a study designed to determine factors that influ-ence cognitive aging.14,15They took a number of cognitive and
physical tests including the Moray House IQ Test (MHT) No. 12 (a test of general cognitive function), which had been admin-istered at age 11.
Medical history, including history of stroke, was recorded. For this study, a general fluid (gf) cognitive ability score was derived from principal components analysis of 6 Wechsler Adult Intelligence Scale–III UK16nonverbal subtests (Matrix
Reason-ing, Letter Number SequencReason-ing, Block Design, Symbol Search, Digit Symbol, and Digit Span Backward), as described previ-ously.17We also used MHT scores from age 11 and age 70 years,
and the National Adult Reading Test (NART),18taken at age 70
years, as a measure of crystallized cognitive ability. A general cognitive ability score was created as for the gf score plus the addition of NART. Cognitive measures were adjusted for age in days and sex before analysis. To obtain a measure of cognitive aging from age 11 to age 70, gf was corrected for age-adjusted age 11 MHT scores, age, and sex.
LBC1921.LBC1921 comprises 550 (234 men) relatively healthy older participants, most of whom took part in the Scottish Mental Survey of 1932, when they were about 11 years old.19At a
mean age of 79.1 years (SD 0.6), they were enrolled in a study designed to determine factors that influence cognitive aging.5,15
They took a number of cognitive and physical tests including the MHT, which had been administered at age 11. For this study, a gf cognitive ability score was created from principal components analysis of MHT, Raven Matrices, Logical Memory, and Verbal Fluency, as described previously.8We also used MHT scores
from age 11 and age 79 years and the NART18from age 79 years.
A general cognitive ability score was created as for the gf score plus the addition of NART. Cognitive measures were adjusted for age in days and sex before analysis. To obtain a measure of cognitive aging from age 11 to age 79, gf was corrected for age-adjusted age 11 MHT scores, age, and sex.
Generation Scotland: The Scottish Family Health Study.
GS is a family-structured, population-based cohort study. Between 2006 and 2011, 24,084 participants were recruited in Glasgow, Tayside, Ayrshire, Arran, and North East Scotland. Participants range between 18 and 100 years old and there are up to 4 generations per family.20,21
The cognitive tests applied were Logical Memory, Digit Sym-bol, Verbal Fluency, and Mill Hill Vocabulary. The Logical Memory test is a test of immediate verbal declarative memory from the Wechsler22Memory Scale–III UK. It involves
immedi-ate and delayed recall of a story with 25 elements that is read aloud to the participant. The Digit Symbol test is from the Wechsler Adult Intelligence Scale–III UK and measures speed of information processing.16The Verbal Fluency test23measures
executive function. The participant has to name as many words as possible beginning with the letters C, F, and L, and is given 1 minute for each letter. The sum of these 3 scores is taken as the overall measure. A gf cognitive ability score was created from principal components analysis of Logical Memory, Digit Symbol, and Verbal Fluency. The Mill Hill Vocabulary test24(Junior and
Senior Synonyms combined) was used as a measure of crystallized cognitive ability. A general cognitive ability score was derived as for the gf score plus the addition of the Mill Hill Vocabulary test. Cognitive measures were adjusted for age in years and sex.
Medical history, including history of stroke, was recorded. There were 10,000 white European participants, born in the UK and with near complete phenotype data, selected for genotyp-ing. In the present study, 6,815 unrelated participants (2,813 men), with a mean age of 55.5 years (SD 11.4), were analyzed.
DNA extraction.DNA was extracted from blood or buccal cells using standard procedures at MRC Technology Edinburgh (LBC1921) and the Wellcome Trust Clinical Research Facility Genetics Core Edinburgh (LBC1936 and Generation Scotland).
Standard protocol approvals, registrations, and patient consents. Ethical approval was attained for LBC1921 and LBC1936 from the Lothian Research Ethics Committee and for LBC1936 from Scotland’s Multicentre Research Ethics Com-mittee and for Generation Scotland from the Tayside Research Ethics Committee.
Creating stroke polygenic risk scores.DNA samples were genotyped at the Wellcome Trust Clinical Research Facility using the Illumina 610-Quadv1 array (San Diego) (LBC1936 and LBC1921)8 or the Illumina HumanOmniExpressExome (San
Diego) (Generation Scotland). Individuals were excluded based on relatedness (n58 in LBC1936; n51 in LBC1921; n5 3,045 in GS), unresolved sex discrepancy (n512 in LBC1936; n51 in LBC1921; n514 in GS), low call rate (#0.95 n516 in LBC1936; n5 5 in LBC1921;#0.97 n 5117 in GS), evidence of non-European descent (n51 in LBC1936; n52 in LBC1921), and pedigree mismatch (n58 in GS). SNPs were used in the analyses if they had a call rate$0.98, a minor allele frequency$0.01, and a Hardy-Weinberg equilibrium test with p$0.001. The first 4 components from a multidimensional scaling analysis of the SNP data were used as covariates in the analyses to control for population stratification.
GWAS summary data for ischemic stroke and its subtypes were obtained from the METASTROKE Consortium.12
and size for imputed SNPs associated with all ischemic, SVD, LVD, or CE stroke subtypes. The information was obtained for 5 differentp value thresholds:,0.8, ,0.5,,0.1,,0.05, and
,0.01. The ischemic stroke GWAS included 12,389 cases of all subtypes, SVD 1,894 cases, LVD 2,167 cases, and CE 2,365 cases. The same 62,004 controls were used in each GWAS. Twenty polygenic stroke risk scores (4 stroke phenotypes at 5p value thresholds) were thus created for each participant of LBC1936, LBC1921, and GS as described in Ref. 25. A/T and G/C SNPs, SNPs with a minor allele frequency,0.02, and SNPs not present in METASTROKE were removed from LBC1936, LBC1921, and GS. Pruning was performed to remove those in linkage disequilibrium (r2.0.25 within a 200-SNP sliding
win-dow). Risk scores were then created in PLINK26by summing the
product of each of the betas obtained from METASTROKE and the number of effect alleles carried by the participant.
Statistical analyses. For all cohorts, partial correlations were calculated between the 20 stroke polygenic risk scores and the cognitive phenotypes described above. Covariates included the number of nonmissing SNPs used to form the risk score, and 4 multidimensional scaling components. Where possible (in LBC1936 and GS), individuals with a self-reported history of stroke before the cognitive testing were removed from the cognitive analyses. Random-effects meta-analyses of the gf, general cognitive ability scores, and measures of crystallized cognitive ability (NART in LBC1936 and LBC1921, and Mill Hill Vocabulary in GS) were performed in R (MAc and Metafor packages). An omnibus effect size and standard error were derived and sample heterogeneity was investigated using Cochran Q statistic, which calculated the sum of squared deviations of each cohort’s effect size from the overall meta-analytic estimate of significance.
RESULTS
Fifty LBC1936 members (5%) and 127
GS members (1.9%) reported having had a stroke
before cognitive testing and were excluded from the
analyses. The number of SNPs that made up the
pol-ygenic risk scores is shown in table e-1 on the
Neurology
®Web site at Neurology.org.
LBC1936.
In LBC1936, 7 of 120 correlations between
cognitive test scores and polygenic risk scores for
ische-mic stroke (and its subtypes) reached a significance
level of
p
,
0.05 (table 1). All correlations indicated
that higher polygenic risk of ischemic stroke (and its
subtypes) was associated with higher cognitive ability.
LBC1921.
In the relatively small LBC1921, there is a
general trend indicating that higher polygenic risk of
ischemic stroke (and its subtypes) is associated with
lower cognitive ability, with 4 of 120 reaching a
sig-nificance level of
p
,
0.05 (table 2).
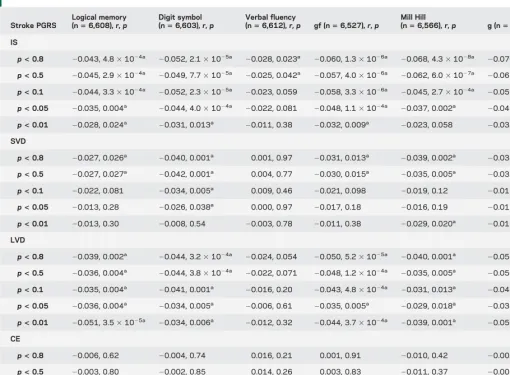
GS.
In GS, 71 of 120 correlations between cognitive
test scores and polygenic risk scores for ischemic
stroke (and its subtypes) reached a significance level
of
p
,
0.05 (table 3). All correlations between
poly-genic risk of all ischemic stroke, SVD stroke, and
LVD stroke and cognitive abilities indicated that
higher polygenic risk is associated with lower
cogni-tive abilities. Correlations between polygenic risk of
CE stroke and cognitive abilities indicated that higher
polygenic risk of CE stroke is associated with higher
cognitive abilities.
Meta-analysis: Cognition.
In the meta-analysis, 14 of
60 correlations between cognitive test scores and
polygenic risk scores for ischemic stroke (and its
subtypes) reached a significance level of
p
,
0.05
(table e-2). Sample heterogeneity was indicated for
many of the crystallized and general cognitive
ability analyses. All correlations between polygenic
risk of all ischemic stroke, SVD stroke, and LVD
stroke and cognitive abilities indicated that higher
polygenic risk is associated with lower cognitive
abilities. Correlations between polygenic risk of CE
stroke and cognitive abilities indicated that higher
polygenic risk of CE stroke is associated with higher
cognitive abilities.
DISCUSSION
In the largest (by 5- and 10-fold over
LBC1936 and LBC1921, respectively) of the cohorts
(GS), we found an association between higher
polygenic risk of all ischemic stroke and lower
cognitive ability. Correlations were generally higher
for general cognitive ability than the specific tests,
suggesting that the greatest influence is on general
cognitive ability. The lowest correlations were
identified for Verbal Fluency. We found similar
correlations between polygenic risk of SVD and
LVD stroke and cognitive ability, albeit with smaller
effects. For all ischemic and SVD stroke, the
polygenic risk scores containing more SNPs generally
correlated more strongly indicating that, as with
polygenic risk of schizophrenia,
27many SNPs with
very small effect sizes contribute to these risk scores.
High polygenic risk of CE stroke was not associated
with low cognition, perhaps because the mechanisms
leading to CE stroke may involve blood clotting rather
than neurovascular integrity, the former possibly
having less of an effect on cognition.
In GS, polygenic risk of all ischemic stroke was a
better predictor of cognitive ability than polygenic risk
of specific subtypes, and had greater power. We note
that the polygenic risk scores for all ischemic stroke
were created from a GWAS of
.
12,000 stroke cases,
whereas polygenic risk scores for each of the subtypes
were created using data from only approximately 2,000
cases. Also, although METASTROKE used the Trial
of Org 10172 in Acute Stroke Treatment (TOAST)
28to classify stroke subtypes, this is imprecise, depends
on detailed investigations for accurate phenotyping,
and therefore some cases may have been assigned
incorrectly.
Undetected
vascular
events
within
METASTROKE participants could also lead to
incor-rect classification of ischemic stroke subtype.
GS but the majority had
p
.
0.05. In LBC1936, the
majority of the correlations were in the opposite
direction to our hypothesis. It is possible that, as
the participants in LBC1936 are all aged about 70
years and still relatively healthy, they may, as a group,
have a low polygenic risk of stroke. Only 5% of the
cohort reported having experienced a stroke before
cognitive testing and these were removed before the
analyses. Including the 50 participants who had
expe-rienced a stroke made little difference to the results.
LBC1921 is also a relatively healthy older cohort.
However, incidence of stroke was not available and
it is possible that the trend toward a correlation
between cognitive ability at age 79 and stroke
poly-genic risk scores was driven by participants who had
experienced cognitive decline following a stroke.
Meta-analyses results also indicated that sample
het-erogeneity was present.
Both fluid and crystallized cognitive ability were
associated with polygenic risk of all ischemic, SVD,
and LVD stroke in GS. Although fluid cognitive
abil-ity tends to decline in later life, crystallized cognitive
ability, as measured in this study by tests of
vocabu-lary, remains relatively stable and is therefore a good
proxy measure of cognitive ability earlier in life.
29A
previous study with the LBC1936 cohort indicated
that higher cognitive ability measured at age 11 years
was associated with fewer white matter
hyperinten-sities at age 73 years.
30These data suggest that genetic
variants that predispose individuals to risk of ischemic
stroke or to risk of brain damage should they have an
ischemic trigger in later life, might act much earlier to
influence cognitive ability, possibly through
influenc-ing brain integrity or brain circulation. It is also
pos-sible that certain genes influence cognitive ability
through other pathways, for example, developmental
Table 1 Correlations and significance between ischemic stroke (and its subtypes) PGRS (calculated using different associationpvalues) andcognitive phenotypes in LBC1936
Stroke PGRS
MHT (age 11 yr)
(n5947),r,p MHT (age 70 yr)(n5945),r,p gf (n5940),r,p NART (n5953),r,p g (n5940),r,p Cognitive change(n5886),r,p
IS
p<0.8 0.008, 0.81 0.061, 0.062 0.001, 0.97 0.075, 0.020a 0.016, 0.63 20.013, 0.70 p<0.5 0.010, 0.76 0.061, 0.063 0.008, 0.81 0.076, 0.019a 0.021, 0.51 20.004, 0.90 p<0.1 0.010, 0.75 0.061, 0.061 0.018, 0.58 0.055, 0.093 0.028, 0.40 0.002, 0.96
p<0.05 0.022, 0.49 0.058, 0.076 0.035, 0.29 0.054, 0.098 0.043, 0.19 0.014, 0.68
p<0.01 0.014, 0.66 0.033, 0.31 0.020, 0.55 0.026, 0.42 0.024, 0.47 20.022, 0.52
SVD
p<0.8 20.016, 0.62 0.033, 0.31 0.002, 0.95 0.058, 0.076 0.013, 0.69 0.002, 0.96
p<0.5 0.000, 0.99 0.049, 0.14 0.016, 0.64 0.066, 0.041a 0.027, 0.42 0.004, 0.90
p<0.1 20.008, 0.82 0.031, 0.34 20.007, 0.83 0.038, 0.24 0.002, 0.96 20.024, 0.48
p<0.05 0.004, 0.91 0.041, 0.20 0.000, 0.10 0.052, 0.11 0.010, 0.76 20.012, 0.71
p<0.01 20.036, 0.27 20.019, 0.56 20.039, 0.24 20.024, 0.46 20.040, 0.22 20.029, 0.39
LVD
p<0.8 20.031, 0.35 0.002, 0.94 20.015, 0.65 0.044, 0.18 20.004, 0.90 20.004, 0.90
p<0.5 20.034, 0.30 0.002, 0.96 20.020, 0.54 0.24, 0.038 20.010, 0.76 20.012, 0.72
p<0.1 20.040, 0.22 0.012, 0.71 20.019, 0.56 0.037, 0.26 20.009, 0.78 20.01, 0.77
p<0.05 20.013, 0.69 0.032, 0.33 0.000, 0.10 0.027, 0.41 0.006, 0.87 20.016, 0.64
p<0.01 20.018, 0.58 0.045, 0.17 0.011, 0.75 0.043, 0.19 0.017, 0.61 0.008, 0.82
CE
p<0.8 0.020, 0.53 0.005, 0.94 20.020, 0.54 0.031, 0.35 20.011, 0.75 20.044, 0.20
p<0.5 20.034, 0.30 0.002, 0.96 20.020, 0.54 0.038, 0.24 20.010, 0.76 20.012, 0.72
p<0.1 0.060, 0.064 0.029, 0.37 0.029, 0.38 0.064, 0.048a 0.038, 0.25 20.004, 0.90 p<0.05 0.064, 0.048a 0.039, 0.24 0.033, 0.32 0.037, 0.26 0.035, 0.28 20.002, 0.96 p<0.01 0.067, 0.039a 0.067, 0.040a 0.042, 0.19 0.062, 0.055 0.049, 0.13 0.002, 0.95
Abbreviations: CE5cardioembolic; g5general cognitive ability; gf5general fluid cognitive ability; IS5all ischemic stroke; LBC19365Lothian Birth Cohort 1936; LVD5large vessel disease; MHT5Moray House Test; NART5National Adult Reading Test; PGRS5polygenic risk score; SVD5small vessel disease.
All analyses were corrected for 4 multidimensional scaling components and number of nonmissing genotypes used to calculate each risk score.
pathways, oxidative stress pathways, neurotransmitter
pathways,
31and, thereafter, individuals with lower
cognitive ability might be more likely to lead lifestyles
that predispose them to ischemic stroke. Finally, the
same genes may be influencing both risk of ischemic
stroke and cognitive ability through independent
pathways.
One strength of this study is the large
population-based cohort of GS. This allowed us to test the
hypothesis that high polygenic risk of ischemic stroke
is associated with lower cognitive ability even in the
absence of stroke. A limitation was that LBC1921
and LBC1936 are relatively small older cohorts.
Although the 3 cohorts consist of individuals born
in different time periods, we have twin- and
family-based and DNA-family-based evidence that the heritability
of cognitive ability is similar over these eras, and the
genetic variants influencing cognition will not have
changed during this time period.
8,9,32However,
cog-nitive ability in later life is an interaction between
genetics and environmental factors and each cohort
experienced very different situations, which may have
had an important influence on cognition, and hence,
may have influenced the results. All of the cohorts
were composed of largely healthy individuals, so the
effect sizes expected were small. A further limitation is
that we lacked information on incidental vascular
changes in the Scottish cohorts at the time of
cogni-tive testing. The results may have been driven by
individuals with undetected stroke. However, MRI
data are available for about 700 members of
LBC1936 at age 73 years (3 years after the cognitive
testing data used in this report were collected). At a
mean age of 73 years, as expected for an older
popu-lation, some white matter hyperintensities were
evi-dent in 97% of LBC1936. However, only 11% of the
Table 2 Correlations and significance between ischemic stroke (and its subtypes) PGRS (calculated using different associationpvalues) andcognitive phenotypes in LBC1921
Stroke PGRS
MHT (age 11 yr)
(n5464),r,p MHT (age 79 yr)(n5511),r,p gf (n5505),r,p NART (n5515),r,p g (n5505),r,p Cognitive change(n5453),r,p
IS
p<0.8 20.001, 0.99 20.093, 0.036a 20.068, 0.13 20.080, 0.071 20.082, 0.067 20.054, 0.26 p<0.5 0.007, 0.89 20.066, 0.14 20.044, 0.32 20.060, 0.17 20.058, 0.20 20.035, 0.46
p<0.1 20.005, 0.92 20.054, 0.23 20.033, 0.46 20.082, 0.063 20.054, 0.23 20.023, 0.63
p<0.05 0.004, 0.94 20.032, 0.48 20.028, 0.53 20.047, 0.29 20.039, 0.38 20.033, 0.48
p<0.01 0.028, 0.55 20.003, 0.95 20.021, 0.64 0.021, 0.65 20.010, 0.83 20.064, 0.18
SVD
p<0.8 20.013, 0.78 20.046, 0.30 20.051, 0.25 20.057, 0.20 20.060, 0.18 20.049, 0.31
p<0.5 20.024, 0.60 20.057, 0.20 20.057, 0.20 20.052, 0.24 20.063, 0.16 20.048, 0.31
p<0.1 20.004, 0.94 20.033, 0.46 20.022, 0.62 20.011, 0.80 20.021, 0.64 20.030, 0.53
p<0.05 0.024, 0.61 20.040, 0.37 20.037, 0.41 20.007, 0.87 20.031, 0.49 20.063, 0.18
p<0.01 20.013, 0.78 20.083, 0.061 20.047, 0.29 20.011, 0.81 20.040, 0.38 20.048, 0.31
LVD
p<0.8 0.001, 0.98 20.021, 0.63 0.007, 0.88 20.062, 0.16 20.014, 0.75 0.037, 0.43
p<0.5 20.003, 0.96 20.025, 0.57 20.002, 0.97 20.061, 0.17 20.019, 0.66 0.034, 0.48
p<0.1 0.000, 0.99 20.031, 0.48 20.011, 0.81 20.056, 0.21 20.026, 0.57 0.025, 0.60
p<0.05 0.025, 0.59 0.010, 0.82 0.024, 0.59 20.009, 0.84 0.015, 0.74 0.034, 0.47
p<0.01 20.002, 0.97 20.011, 0.80 20.010, 0.83 20.023, 0.60 20.015, 0.74 0.020, 0.67
CE
p<0.8 20.020, 0.67 20.070, 0.12 20.061, 0.17 20.030, 0.50 20.064, 0.15 20.067, 0.16
p<0.5 20.001, 0.98 20.058, 0.19 20.053, 0.23 20.016, 0.72 20.053, 0.24 20.067, 0.16
p<0.1 0.035, 0.45 20.031, 0.48 20.020, 0.65 0.013, 0.77 20.017, 0.70 20.049, 0.31
p<0.05 20.008, 0.86 20.058, 0.20 20.040, 0.38 20.027, 0.55 20.043, 0.34 20.035, 0.47
p<0.01 20.029, 0.53 20.11, 0.014a 20.13, 0.003a 20.074, 0.095 20.13, 0.004 20.13, 0.008a
Abbreviations: CE5cardioembolic; g5general cognitive ability; gf5general fluid cognitive ability; IS5all ischemic stroke; LBC19215Lothian Birth Cohort 1921; LVD5large vessel disease; MHT5Moray House Test; NART5National Adult Reading Test; PGRS5polygenic risk score; SVD5small vessel disease.
All analyses were corrected for 4 multidimensional scaling components and number of nonmissing genotypes used to calculate each risk score.
cohort did not self-report having had a stroke, but did
have imaging evidence of a stroke.
30Population-based
studies indicate that white matter hyperintensities
increase with age.
33Therefore, we expect that the
percentage of individuals with undetected stroke
and white matter hyperintensities will be lower in
LBC1936 at mean age 70 years and lower still in
GS, which has a mean age of 55 years, and slightly
higher in LBC1921 at mean age 79 years.
We have presented uncorrected
p
values as all
cog-nitive phenotypes are correlated (r
range: 0.19
–
0.70,
p
,
0.001; tables e-3
–
e-5), as are many of the
poly-genic risk scores (tables e-6
–
e-8). However, it is
pos-sible that some of the findings may be attributable to
type 1 error. Future studies on larger groups with
more cognitive decline
—
especially where that is
sus-pected to be of vascular origin
—
might show larger
effect sizes. In the future, it would be helpful to be
able to create subtype risk scores based on larger
numbers of accurately phenotyped ischemic stroke
patients.
The findings from this study indicate that even in
the absence of stroke, being at high polygenic risk of
ischemic stroke is associated with lower cognitive
abil-ity. This may be attributable to a genetic
predisposi-tion to defects in brain integrity or circulapredisposi-tion, which
increases the risk of stroke or reduces resilience to
withstand the effect of ischemic triggers on brain
damage. Alternatively, the genes may be acting
inde-pendently to influence cognitive ability and stroke
risk through different pathways.
AUTHOR CONTRIBUTIONS
Sarah E. Harris drafted and revised the manuscript, analyzed the data, contributed vital reagents, acquired data, and performed statistical analy-ses. Rainer Malik drafted and revised the manuscript, analyzed the data, and contributed vital reagents. Riccardo Marioni drafted and revised the manuscript, analyzed the data, and performed statistical analyses. Archie Campbell contributed vital reagents and acquired data. Sudha Seshadri
Table 3 Correlations and significance between ischemic stroke (and its subtypes) PGRS (calculated using different associationpvalues) and cognitive phenotypes in GS
Stroke PGRS
Logical memory
(n56,608),r,p Digit symbol(n56,603),r,p Verbal fluency(n56,612),r,p gf (n56,527),r,p Mill Hill(n56,566),r,p g (n56,492),r,p
IS
p<0.8 20.043, 4.831024a 20.052, 2.131025a 20.028, 0.023a 20.060, 1.331026a 20.068, 4.331028a 20.070, 2.031028a p<0.5 20.045, 2.931024a 20.049, 7.731025a 20.025, 0.042a 20.057, 4.031026a 20.062, 6.031027a 20.065, 1.4031027a p<0.1 20.044, 3.331024a 20.052, 2.331025a 20.023, 0.059 20.058, 3.331026a 20.045, 2.731024a 20.059, 2.231026a p<0.05 20.035, 0.004a 20.044, 4.031024a 20.022, 0.081 20.048, 1.131024a 20.037, 0.002a 20.049, 9.331025a p<0.01 20.028, 0.024a 20.031, 0.013a 20.011, 0.38 20.032, 0.009a 20.023, 0.058 20.032, 0.011a
SVD
p<0.8 20.027, 0.026a
20.040, 0.001a 0.001, 0.97
20.031, 0.013a
20.039, 0.002a
20.034, 0.005a p<0.5 20.027, 0.027a 20.042, 0.001a 0.004, 0.77 20.030, 0.015a 20.035, 0.005a 20.032, 0.011a
p<0.1 20.022, 0.081 20.034, 0.005a 0.009, 0.46
20.021, 0.098 20.019, 0.12 20.019, 0.13
p<0.05 20.013, 0.28 20.026, 0.038a 0.000, 0.97 20.017, 0.18 20.016, 0.19 20.017, 0.17
p<0.01 20.013, 0.30 20.008, 0.54 20.003, 0.78 20.011, 0.38 20.029, 0.020a
20.016, 0.19
LVD
p<0.8 20.039, 0.002a 20.044, 3.231024a 20.024, 0.054 20.050, 5.231025a 20.040, 0.001a 20.053, 1.631025a p<0.5 20.036, 0.004a
20.044, 3.831024a
20.022, 0.071 20.048, 1.231024a
20.035, 0.005a
20.050, 5.731025a p<0.1 20.035, 0.004a 20.041, 0.001a 20.016, 0.20 20.043, 4.831024a 20.031, 0.013a 20.045, 3.331024a p<0.05 20.036, 0.004a
20.034, 0.005a
20.006, 0.61 20.035, 0.005a
20.029, 0.018a
20.038, 0.002a p<0.01 20.051, 3.531025a 20.034, 0.006a 20.012, 0.32 20.044, 3.731024a 20.039, 0.001a 20.050, 6.431025a
CE
p<0.8 20.006, 0.62 20.004, 0.74 0.016, 0.21 0.001, 0.91 20.010, 0.42 20.002, 0.89
p<0.5 20.003, 0.80 20.002, 0.85 0.014, 0.26 0.003, 0.83 20.011, 0.37 20.001, 0.92
p<0.1 0.015, 0.23 0.005, 0.66 0.015, 0.23 0.016, 0.19 20.001, 0.92 0.010, 0.42
p<0.05 0.020, 0.10 0.019, 0.12 0.018, 0.15 0.026, 0.033a 0.004, 0.77 0.021, 0.098 p<0.01 0.038, 0.002a 0.035, 0.005a 0.025, 0.041a 0.047, 1.631024a 0.009, 0.47 0.037, 0.003a
Abbreviations: CE5cardioembolic; g5general cognitive ability; gf5general fluid cognitive ability; GS5Generation Scotland: Scottish Family Health Study; IS5all ischemic stroke; LVD5large vessel disease; PGRS5polygenic risk score; SVD5small vessel disease.
All analyses were corrected for 4 multidimensional scaling components and number of non-missing genotypes used to calculate each risk score.
drafted and revised the manuscript, analyzed the data, and contributed vital reagents. Bradford B. Worrall drafted and revised the manuscript, analyzed the data, and contributed vital reagents. Cathie L.M. Sudlow drafted and revised the manuscript, analyzed the data, and contributed vital reagents. Caroline Hayward drafted and revised the manuscript and contributed vital reagents. Mark E. Bastin drafted and revised the manuscript, acquired data, supervised the study, and obtained funding. John M. Starr drafted and revised the manuscript, analyzed the data, supervised the study, and obtained funding. David J. Porteous drafted and revised the manuscript, contributed vital reagents, supervised the study, and obtained funding. Joanna M. Wardlaw drafted and revised the manuscript, analyzed the data, supervised the study, and obtained funding. Ian J. Deary drafted and revised the manuscript, analyzed the data, contributed vital reagents, acquired data, supervised the study, and obtained funding.
ACKNOWLEDGMENT
METASTROKE: The authors thank all study participants, volunteers, and study personnel who made this consortium possible and the constitu-ent studies for access to their data. LBC1936 and LBC1921: The authors thank the cohort participants who contributed to these studies. GS: The authors are grateful to all the families who took part, the general practi-tioners, and the Scottish School of Primary Care for their help in recruiting them, and the whole GS team.
STUDY FUNDING
The METASTROKE Consortium is supported by NINDS (NS017950). See Ref. 12 for detailed funding disclosure for the METASTROKE Con-sortium. LBC1936 and LBC1921: Genotyping was supported by the BBSRC. Phenotype collection in LBC1921 was supported by the BBSRC, The Royal Society, and The Chief Scientist Office of the Scot-tish Government. Phenotype collection in LBC1936 was supported by Research Into Ageing (continues as part of Age UK’s The Disconnected Mind project). Generation Scotland has received core funding from the Chief Scientist Office of the Scottish Government Health Directorates CZD/16/6 and the Scottish Funding Council HR03006. The work was undertaken by The University of Edinburgh Centre for Cognitive Ageing and Cognitive Epidemiology, part of the cross-council Lifelong Health and Wellbeing Initiative (MR/K026992/1).
DISCLOSURE
S. Harris is supported by the Medical Research Council and the UK’s Biotechnology and Biological Sciences Research Council (BBSRC) (MR/ K026992/1). R. Malik is supported by the Vascular Dementia Research Foundation. S. Seshadri is supported by the National Heart, Lung and Blood Institute N01HC2519. R. Marioni and A. Campbell report no disclosures relevant to the manuscript. B. Worrall is supported by the National Institute of Neurological Disorders and Stroke (NINDS) U01-NS069208. C. Sudlow is supported by UK Biobank (MRC and Well-come Trust) and the Scottish Funding Council. C. Hayward and M. Bastin report no disclosures relevant to the manuscript. J. Starr is sup-ported by the Medical Research Council and the UK’s Biotechnology and Biological Sciences Research Council (BBSRC) (MR/K026992/1). D. Porteous and J. Wardlaw report no disclosures relevant to the manu-script. I. Deary is supported by the Medical Research Council and the UK’s Biotechnology and Biological Sciences Research Council (BBSRC) (MR/K026992/1). Go to Neurology.org for full disclosures.
Received March 12, 2015. Accepted in final form October 26, 2015.
REFERENCES
1. Deary IJ, Corley J, Gow AJ, et al. Age-associated cognitive decline. Br Med Bull 2009;92:135–152.
2. Gorelick PB. Risk factors for vascular dementia and Alz-heimer disease. Stroke 2004;35:2620–2622.
3. Lawlor DA, Batty GD, Clark H, McIntyre S, Leon DA. Association of childhood intelligence with risk of coronary heart disease and stroke: findings from the Aberdeen
Children of the 1950s Cohort Study. Eur J Epidemiol 2008;23:695–706.
4. Modig WK, Silventoinen K, Tynelius P, Bergman L, Rasmussen F. Association between intelligence and type-specific stroke: a population-based cohort study of early fatal and non-fatal stroke in one million Swedish men. J Epidemiol Community Health 2010;64:908–912. 5. Deary IJ, Whiteman MC, Starr JM, Whalley LJ, Fox HC.
The impact of childhood intelligence on later life: follow-ing up the Scottish mental surveys of 1932 and 1947. J Pers Soc Psychol 2004;86:130–147.
6. Wisdom NM, Callahan JL, Hawkins KA. The effects of apolipoprotein E on non-impaired cognitive functioning: a meta-analysis. Neurobiol Aging 2011;32:63–74. 7. Davies G, Harris SE, Reynolds CA, et al. A genome-wide
association study implicates the APOE locus in nonpatho-logical cognitive ageing. Mol Psychiatry 2014;19:76–87. 8. Davies G, Tenesa A, Payton A, et al. Genome-wide
association studies establish that human intelligence is highly heritable and polygenic. Mol Psychiatry 2011;16: 996–1005.
9. Marioni RE, Davies G, Hayward C, et al. Molecular genetic contributions to socioeconomic status and intelli-gence. Intelligence 2014;44:26–32.
10. Deary IJ, Yang J, Davies G, et al. Genetic contributions to stability and change in intelligence from childhood to old age. Nature 2012;482:212–215.
11. Bevan S, Traylor M, Adib-Samii P, et al. Genetic herita-bility of ischemic stroke and the contribution of previously reported candidate gene and genomewide associations. Stroke 2012;43:3161–3167.
12. Traylor M, Farrall M, Holliday EG, et al. Genetic risk factors for ischaemic stroke and its subtypes (the META-STROKE collaboration): a meta-analysis of genome-wide association studies. Lancet Neurol 2012;11:951–962. 13. Scottish Council for Research in Education. The Trend of
Scottish Intelligence: A Comparison of the 1947 and 1932 Surveys of the Intelligence of Eleven-Year-Old Pupils. London: University of London Press; 1949.
14. Deary IJ, Gow AJ, Taylor MD, et al. The Lothian Birth Cohort 1936: a study to examine influences on cognitive ageing from age 11 to age 70 and beyond. BMC Geriatr 2007;7:28.
15. Deary IJ, Gow AJ, Pattie A, Starr JM. Cohort profile: the Lothian Birth Cohorts of 1921 and 1936. Int J Epidemiol 2012;41:1576–1584.
16. Wechsler D. WAIS-III UK Administration and Scoring Manual. London, UK: Psychological Corporation; 1998. 17. Luciano M, Gow AJ, Harris SE, et al. Cognitive ability at
age 11 and 70 years, information processing speed, and APOE variation: the Lothian Birth Cohort 1936 Study. Psychol Aging 2009;24:129–138.
18. Nelson HE, Willison JR. National Adult Reading Test (NART): Test Manual (Part 2). Windsor, UK: NFER-Nelson; 1991.
19. Scottish Council for Research in Education. The Intelli-gence of Scottish Children: A National Survey of an Age-Group. London: University of London Press; 1933. 20. Smith BH, Campbell H, Blackwood D, et al. Generation
Scotland: the Scottish Family Health Study; a new resource for researching genes and heritability. BMC Med Genet 2006;7:74.
SFHS). The study, its participants and their potential for genetic research on health and illness. Int J Epidemiol 2013;42:689–700.
22. Wechsler D. WMS-III UK Administration and Scoring Manual. London, UK: Psychological Corporation; 1998. 23. Lezak M. Neuropsychological Testing. Oxford, England:
Oxford University Press; 1995.
24. Raven JC. The Mill Hill Vocabulary Scale. London: H.K. Lewis; 1965.
25. Harris SE, Davies G, Luciano M, et al. Polygenic risk for Alzheimer’s disease is not associated with cognitive ability or cognitive aging in non-demented older people. J Alzheimers Dis 2014;39:565–574.
26. Purcell S, Neale B, Todd-Brown K, et al. PLINK: a tool set for whole-genome association and population-based linkage analyses. Am J Hum Genet 2007;81:559–575. 27. McIntosh AM, Gow A, Luciano M, et al. Polygenic risk
for schizophrenia is associated with cognitive change between childhood and old age. Biol Psychiatry 2013; 73:938–943.
28. Adams HP Jr, Bendixen BH, Kappelle LJ, et al. Classifi-cation of subtype of acute ischemic stroke. Definitions for use in a multicenter clinical trial. TOAST. Trial of Org 10172 in Acute Stroke Treatment. Stroke 1993;24:35–41. 29. Salthouse TA. Localizing age-related individual differences
in a hierarchical structure. Intelligence 2004;32. 30. Valdes Hernandez MC, Booth T, Murray C, et al. Brain
white matter damage in aging and cognitive ability in youth and older age. Neurobiol Aging 2013;34:2740–2747. 31. Harris SE, Deary IJ. The genetics of cognitive ability and
cognitive ageing in healthy older people. Trends Cogn Sci 2011;15:388–394.
32. Benyamin B, Wilson V, Whalley LJ, Visscher PM,
Deary IJ. Large, consistent estimates of the heritability of cognitive ability in two entire populations of 11-year-old twins from Scottish mental surveys of 1932 and 1947. Behav Genet 2005;35:525–534.
33. Morris Z, Whiteley WN, Longstreth WT Jr, et al. Inci-dental findings on brain magnetic resonance imaging: sys-tematic review and meta-analysis. BMJ 2009;339:b3016.