Scholarship@Western
Scholarship@Western
Electronic Thesis and Dissertation Repository
12-17-2019 2:30 PM
Design and Implementation of Anomaly Detections for User
Design and Implementation of Anomaly Detections for User
Authentication Framework
Authentication Framework
Iman Abu Sulayman
The University of Western Ontario
Supervisor
Ouda, Abdelkader
The University of Western Ontario
Graduate Program in Electrical and Computer Engineering
A thesis submitted in partial fulfillment of the requirements for the degree in Master of Engineering Science
© Iman Abu Sulayman 2019
Follow this and additional works at: https://ir.lib.uwo.ca/etd
Part of the Computer Engineering Commons, and the Electrical and Computer Engineering Commons
Recommended Citation Recommended Citation
Abu Sulayman, Iman, "Design and Implementation of Anomaly Detections for User Authentication Framework" (2019). Electronic Thesis and Dissertation Repository. 6732.
https://ir.lib.uwo.ca/etd/6732
This Dissertation/Thesis is brought to you for free and open access by Scholarship@Western. It has been accepted for inclusion in Electronic Thesis and Dissertation Repository by an authorized administrator of
Abstract
Anomaly detection is quickly becoming a very significant tool for a variety of
applications such as intrusion detection, fraud detection, fault detection, system health
monitoring, and event detection in IoT devices. An application that lacks a strong
implementation for anomaly detection is user trait modeling for user authentication purposes.
User trait models expose up-to-date representation of the user so that changes in their interests,
their learning progress or interactions with the system are noticed and interpreted. The reason
behind the lack of adoption in user trait modeling arises from the need of a continuous flow of
high-volume data, that is not available in most cases, to achieve high-accuracy detection. This
research provides new insight into anomaly detection techniques through Big Data utilization.
Three classification approaches are presented for anomaly detection techniques that are aligned
with Big Data characteristics: volume, variety and velocity. The classification is supported by
applications of machine learning techniques, such as K-means, Hidden Markov Model,
Gaussian Distribution and Auto-encoder neural network, with an aim to recommend best
techniques to model user behaviour in an adaptive environment. An ingenious implementation
of machine learning techniques has been presented that automatically and accurately builds a
unique pattern of the users’ behaviour. With Big Data characteristics, anomaly detection
techniques have become more suitable tools for user trait modeling. A solution model is
designed and implemented based on anomaly detection outcomes utilizing user traits for an
existing user authentication framework. User traits will be modeled by creating a security user
profile for each individual user. This profile is structured and developed to be a seed for a
strong real-time user authentication method. The implementation comprises four main steps:
prediction of rare user actions, filter security potential actions, build/update user profile, and
generate a real-time (i.e., just in time) set of challenging questions. Real-world scenarios have
been given showing the benefits of these challenging questions in building secure
knowledge-based user authentication systems.
Keywords
User trait Modeling, Big Data, Anomaly Detection, K-means, Gaussian Distribution, Neural
Dedication
This thesis is dedicated to my Parents who have given me support throughout every
step of my educational career. Also, I dedicate this thesis to my brother and sisters who
encouraged me to finish my studies and helped me become the man I am today. Finally, I
dedicate this thesis to my wife and sons, who have lived with me during my schooling and
Acknowledgments
All thanks go to God (Allah) Who has given me the ability to achieve my goals and
Guides me to seek knowledge. Allah is the only one who protects me during my study journey,
and He is the only source of all of my achievements.
Secondly, I would like to thank my lovely parents for their daily supplications for me,
wishing me all the best in my entire life. Thirdly, a sincere thanks to my lovely family (my
wife and my two sons) for their patience, support and encouragement through my studies.
I would like to express my deep appreciation to my supervisor Dr. Abdelkader Ouda
for his insightful guidance, invaluable advice, and constructive criticism during my MESc.
program. His academic expertise helped me to improve my research skills. His support and
motivation gave me the confidence and the strength to accomplish my goals.
This work was partially supported by Tiaf University in Saudi Arabian through the
Table of Contents
Abstract ... i
Dedication ... ii
Acknowledgments... iii
Table of Contents ... iv
List of Tables ... vii
List of Figures ... xi
List of Appendices ... xiv
List of Abbreviations ... xvii
Chapter 1 ... 1
1 Introduction ... 1
1.1 Research Motivation ... 2
1.2 Research Objectives ... 3
1.3 Research Methodology ... 4
1.4 Research Contribution ... 6
1.5 Research Outline ... 7
Chapter 2 ... 8
2 Literature Review and Background ... 8
2.1 Literature Review... 8
2.2 Anomaly Detection Techniques ... 11
2.2.1 Extra-Tree Classifier ... 15
2.2.2 K-means Clustering ... 15
2.2.3 Hidden Markov Model ... 17
2.2.4 Neural Network - Auto-Encoder ... 18
2.3 User Authentication ... 21
Chapter 3 ... 24
3 Big Data Anomaly Detection Classification ... 24
3.1 Velocity - Time Complexity Classification ... 24
3.2 Variety - Data Nature Classification ... 25
3.3 Volume - Data Feature Classification ... 26
3.4 Comparison Study ... 27
3.5 Summary ... 30
Chapter 4 ... 31
4 Proposed Anomaly Detection System ... 31
4.1 General Architecture ... 32
4.2 Anomaly Detection - Machine Learning Models ... 34
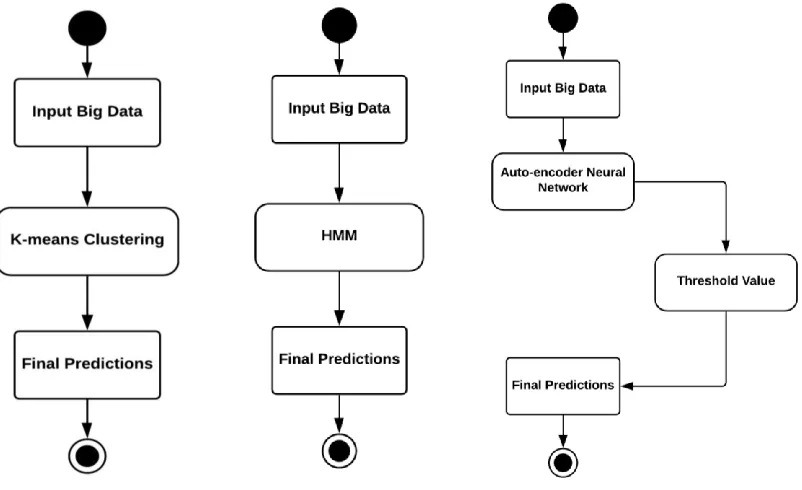
4.2.1 K-means Clustering, HMM, and Auto-encoder Models ... 34
4.2.2 Auto-Encoder-K-means and Auto-Encoder-HMM Models ... 35
4.2.3 Combination Model (Auto-encoder, K-means, and HMM) ... 36
4.2.4 Gaussian Distribution Model ... 37
4.3 Programming, Libraries and Evaluation Methods ... 38
4.3.1 Program Libraries ... 38
4.3.2 Common Evaluation Methods ... 40
4.3.3 Sequential Accuracy Algorithm (SAA) ... 42
4.3.4 Parameters Tuning ... 44
4.4 Anomaly Detection Results ... 47
4.4.1 Experiment 1 - Credit Card Dataset ... 48
4.4.2 Experiment 2 - Synthetic Dataset from a Financial Payment System ... 56
4.4.3 Experiment 3 - German Credit Risk Dataset ... 64
4.4.5 Experiment 5 - High Dimensional Server Computers Dataset ... 83
4.4.6 Experiment 6 - Transmission History Dataset ... 91
4.4.7 Experiment 7 - Porto Seguro’s Safe Driver Prediction Dataset ... 99
4.4.8 Experiment 8 – Santander Customer Transaction Dataset ... 107
4.4.9 Experiment 9 - Prudential Life Insurance Assessment Dataset ... 115
4.4.10 Results Summary and Experiments Conclusion ... 125
Chapter 5 ... 127
5 User Authentication ... 127
5.1 “Something you do”-Based Authentication ... 127
5.2 User Profile ... 129
5.3 Creating an Individual User Profiles... 134
5.4 Challenging Questions ... 141
Chapter 6 ... 144
6 Conclusion and Future Works ... 144
6.1 Conclusion ... 144
6.2 Future Works ... 146
References ... 147
Appendices ... 1
List of Tables
Table 3.1: Anomaly Detection Factors with Big Data Characteristics ... 24
Table 3.2: SVM and Neural Network Comparison Table ... 28
Table 3.3: K-means, HMM, Auto-encoder, and Gaussian Distribution Comparison Table .. 29
Table 4.1: Data Splitting in Anomaly Detection System ... 33
Table 4.2: Used Python Libraries and Description ... 38
Table 4.3: Confusion Matrix Table ... 40
Table 4.4: Tuning Parameters in Python... 45
Table 4.5: Dataset 1 Description ... 48
Table 4.6: Results for Dataset 1 based on Four Assumptions ... 51
Table 4.7: K-means Results for Dataset 1 ... 52
Table 4.8: Parameters Ranges ... 53
Table 4.9: HMM Results for Dataset 1 ... 53
Table 4.10: Auto-Encoder Model Results ... 54
Table 4.11: Results of Four Models ... 55
Table 4.12: Dataset 2 Description ... 57
Table 4.13: Results for Dataset 2 based on Four Assumptions ... 59
Table 4.14: K-means Results for Dataset 2 ... 60
Table 4.15: HMM Results for Dataset 2 ... 61
Table 4.17: Results of Four Models for Dataset 2 ... 63
Table 4.18: Dataset 3 Description ... 66
Table 4.19: Results for Dataset 3 based on Four Assumptions ... 69
Table 4.20: K-means Results for Dataset 3 ... 70
Table 4.21: HMM Results for Dataset 3 ... 71
Table 4.22: Auto-Encoder Model Results for Dataset 3 ... 73
Table 4.23: Results of Four Models for Dataset 3 ... 74
Table 4.24: Dataset 4 Description ... 75
Table 4.25: Results for Dataset 4 based on Four Assumptions ... 78
Table 4.26: K-means Results for Dataset 4 ... 79
Table 4.27: HMM Results for Dataset 4 ... 80
Table 4.28: Auto-Encoder Model Results for Dataset 4 ... 81
Table 4.29: Results of Four Models for Dataset 4 ... 82
Table 4.30: Dataset 5 Description ... 83
Table 4.31: Results for Dataset 5 based on Four Assumptions ... 86
Table 4.32: K-means Results for Dataset 5 ... 87
Table 4.33: HMM Results for Dataset 5 ... 88
Table 4.34: Auto-Encoder Model Results for Dataset 5 ... 89
Table 4.35: Results of Four Models for Dataset 5 ... 90
Table 4.37: Results for Dataset 6 based on Four Assumptions ... 94
Table 4.38: K-means Results for Dataset 6 ... 95
Table 4.39: HMM Results for Dataset 6 ... 96
Table 4.40: Auto-Encoder Model Results for Dataset 6 ... 97
Table 4.41: Results of Four Models for Dataset 6 ... 98
Table 4.42: Dataset 7 Description ... 99
Table 4.43: Results for Dataset 7 based on Four Assumptions ... 102
Table 4.44: K-means Results for Dataset 7 ... 103
Table 4.45: HMM Results for Dataset 7 ... 104
Table 4.46: Auto-Encoder Model Results for Dataset 7 ... 105
Table 4.47: Results of Four Models for Dataset 7 ... 106
Table 4.48: Dataset 9 Description ... 107
Table 4.49: Results for Dataset 8 based on Four Assumptions ... 110
Table 4.50: K-means Results for Dataset 8 ... 111
Table 4.51: HMM Results for Dataset 8 ... 112
Table 4.52: Auto-Encoder Model Results for Dataset 8 ... 113
Table 4.53: Results of Four Models for Dataset 8 ... 114
Table 4.54: Data Features Description for Dataset 9 ... 116
Table 4.55: Dataset 9 Description ... 117
Table 4.57: K-means Results for Dataset 9 ... 121
Table 4.58: HMM Results for Dataset 9 ... 122
Table 4.59: Auto-Encoder Model Results for Dataset 9 ... 123
Table 4.60: Results of Four Models for Dataset 9 ... 124
Table 4.61: Best Model per Experiment ... 126
Table 5.1: User Profile Specification Features ... 130
Table 5.2: User Profiles Sample from Experiment 1 ... 131
Table 5.3: User Profiles Sample from Experiment 2 ... 131
Table 5.4: User Profiles Sample from Experiment 3 ... 132
Table 5.5: User Profiles Sample from Experiment 6 ... 132
Table 5.6: User Profiles Sample from Experiment 7 ... 133
Table 5.7: User Profiles Sample from Experiment 9 ... 133
Table 5.8: User Profiles Comparison Table ... 135
List of Figures
Figure 1.1: The main components of Ouda’s user authentication framework [1] ... 2
Figure 1.2: Nine Experiments, Fields and Sizes ... 7
Figure 2.1: Anomaly Detection Categories ... 9
Figure 2.2: Anomaly Detection Techniques Types and Examples ... 10
Figure 2.3: Anomaly Detection Diagram... 12
Figure 2.4: K-means Clusters ... 16
Figure 2.5: HMM Diagram ... 17
Figure 2.6: Simple Artificial Neural Network ... 19
Figure 2.7: Auto-Encoder neural network Model ... 20
Figure 2.8: User Authentication Techniques ... 22
Figure 3.1: Velocity - Time Complexity Classification... 24
Figure 3.2: Big Data Sources and Types ... 25
Figure 3.3: Variety – Data Nature Classification... 26
Figure 3.4: Volume - Data Feature Classification ... 27
Figure 4.1: Used Machine Learning Techniques and their purposes... 31
Figure 4.2: Anomaly Detection Proposed Architecture ... 32
Figure 4.3: K-means Clustering, HMM, and Auto-encoder Models ... 35
Figure 4.4: Auto-Encoder-K-means and Auto-Encoder-HMM Models ... 36
Figure 4.6: Gaussian Distribution Model... 38
Figure 4.7: Features Histogram for Dataset 1 ... 49
Figure 4.8: Feature Importance for Dataset 1 ... 50
Figure 4.9: The Best Results in Experiment 1 ... 56
Figure 4.10: Features Histogram for Dataset 2 ... 57
Figure 4.11: Feature Importance for Dataset 2 ... 58
Figure 4.12: The Best Results in Experiment 2 ... 64
Figure 4.13: Features Histogram for Dataset 3 ... 67
Figure 4.14: Feature Importance for Dataset 3 ... 68
Figure 4.15: The Best Results in Experiment 3 ... 75
Figure 4.16: Features Histogram for Dataset 4 ... 76
Figure 4.17: Feature Importance for Dataset 4 ... 77
Figure 4.18: The Best Results in Experiment 4 ... 83
Figure 4.19: Features Histogram for Dataset 5 ... 84
Figure 4.20: Feature Importance for Dataset 5 ... 85
Figure 4.21: The Best Results in Experiment 5 ... 91
Figure 4.22: Features Histogram for Dataset 6 ... 92
Figure 4.23: Feature Importance for Dataset 6 ... 93
Figure 4.24: The Best Results in Experiment 6 ... 99
Figure 4.26: Feature Importance for Dataset 7 ... 101
Figure 4.27: The Best Results in Experiment 7 ... 107
Figure 4.28: Features Histogram for Dataset 8 ... 108
Figure 4.29: Feature Importance for Dataset 8 ... 109
Figure 4.30: The Best Results in Experiment 8 ... 115
Figure 4.31: Features Histogram for Dataset 9 ... 118
Figure 4.32: Feature Importance for Dataset 9 ... 119
Figure 4.33: The Best Results in Experiment 9 ... 125
Figure 4.34: TNR and TPR for the highest result in every Experiment. ... 126
Figure 5.1: Security Questions Types and Examples ... 129
Figure 5.2:User Behaviour Modeling Diagram. ... 136
Figure 5.3: Anomaly Detection Model. ... 137
List of Appendices
Appendix A: All the results for all data in assumption 1 (without normalization or
dimensional reduction)... 1
Appendix B: All the results for all data in assumption 2 (with normalization only) ... 3
Appendix C: All the results for all data in assumption 3 (with dimensional reduction only) .. 5
Appendix D: All the results for all data in assumption 4 (with both normalization dimensional reduction only) ... 7
Appendix E: PCA comparison based on features for experiment 1. ... 9
Appendix F: PCA comparison based on features for experiment 2... 10
Appendix G: PCA comparison based on features for experiment 3. ... 10
Appendix H: PCA comparison based on features for experiment 4. ... 11
Appendix I: PCA comparison based on features for experiment 6. ... 12
Appendix J: PCA comparison based on features for experiment 7. ... 12
Appendix K: PCA comparison based on features for experiment 8. ... 14
Appendix L: PCA comparison based on features for experiment 9. ... 15
Appendix M: All results in K-means Model for Experiment 1. ... 15
Appendix N: All results in HMM Model for Experiment 1. ... 18
Appendix O: All results in Auto-Encoder Model for Experiment 1. ... 19
Appendix P: All results in K-means Model for Experiment 2... 22
Appendix Q: All results in HMM Model for Experiment 2. ... 24
Appendix S: All results in K-means Model for Experiment 3... 27
Appendix T: All results in HMM Model for Experiment 3. ... 30
Appendix U: All results in Auto-Encoder Model for Experiment 3. ... 31
Appendix V: All results in K-means Model for Experiment 4. ... 34
Appendix W: All results in HMM Model for Experiment 4. ... 36
Appendix X: All results in Auto-Encoder Model for Experiment 4. ... 38
Appendix Y: All results in K-means Model for Experiment 5. ... 39
Appendix Z: All results in HMM Model for Experiment 5. ... 42
Appendix AA: All results in Auto-Encoder Model for Experiment 5. ... 43
Appendix BB: All results in K-means Model for Experiment 6. ... 46
Appendix CC: All results in HMM Model for Experiment 6. ... 49
Appendix DD: All results in Auto-Encoder Model for Experiment 6. ... 50
Appendix EE: All results in K-means Model for Experiment 7. ... 53
Appendix FF: All results in HMM Model for Experiment 7. ... 55
Appendix GG: All results in Auto-Encoder Model for Experiment 7. ... 57
Appendix HH: All results in K-means Model for Experiment 8. ... 59
Appendix II: All results in HMM Model for Experiment 8... 62
Appendix JJ: All results in Auto-Encoder Model for Experiment 8. ... 63
Appendix KK: All results in K-means Model for Experiment 9. ... 66
List of Abbreviations
AD Anomaly Detection
NN Neural Network
HMM Hidden Markova Model
GD Gaussian Distribution
DR Detection Rate
TPR True Positive Rate
TNR True Negative Rate
DSA Data Security-based Analytics
BDA Big Data-driven authentication tool
JitHDA Just-in-time human dynamics-based authentication engine
ML Machine Learning
SVM Support vector Machine
OCSVM One Class Support Vector Machine
IDS Intrusion Detection Systems
ANN Artificial Neural Network
Prec Precision
Rec Recall
MLP Multi-Layer Perceptron
CNN Convolutional Neural Network
AUC Area Under Curve
LSTM Long short-term memory
PCA Principal Component Analysis
Roc Receiver Operating Characteristic
Sqrt Square Root
RMSE Root Mean Square Error
Tol Tolerance
SAA Sequential Accuracy Algorithm
Chapter 1
1
Introduction
In preventing and detecting unauthorized use of computer systems, user
authentication is the first line-of-defense against cyber-attacks. RFC 2828 defines user
authentication as the process of verifying an identity claimed by or for a system entity [1].
An authentication process consists of two steps: (1) presenting an identifier to the security
system, and (2) presenting or generating authentication information that corroborates the
binding between the user and the identifier. There are many user authentication methods
that are implemented and used to provide secure user authentication. These methods can
be classified under three main authentication categories. (i) “Something-you-know”, examples include a password, a PIN number (ii) “Something-you-have”, examples include
cryptographic key generators and smart cards. (iii) “Something-you-are”, examples include
the recognition of users’ fingerprint, iris, and face, known to be static biometric measures.
Each of these methods has its own security advantages and pitfalls.
Ouda, [1] has developed a new framework to describe the rise of new generation
user authentication systems. The framework is recommending the leverages of Big Data
analytics and relying on a “something you do”-based verification process. Figure 1.1 shows
the main component of this framework. The framework provided three main components
that indicate the perspectives for the researchers to approach the development of strong
user authentication systems. These components are: (1) Data Security-based Analytics
(DSA) that describe ways to leverage Big Data analytics to have valuable insight of the
users’ data with the appropriate depth needed to deliver up-to-date representation of the
user behaviour, (2) Big Data-driven Authentication tools (BDA), to analyze the captured
user behaviour and focus on the sudden changes of the user’s actions, along with the
real-time uniquely identifiable information to build accurate patterns of the users’ actions in the
form of user security profile, and (3) Just-in-time human dynamics based authentication
engine (JitHDA) that utilizes these profiles to generate a real-time (i.e., just in time) set of
challenging questions. These questions should cover the unique actions that explicitly
This thesis proposes a novel implementation model for Ouda’s authentication
framework. This model utilizes the Machine Learning-based Anomaly Detection technique
to develop the security potential user profiles by which a structural database of challenging
questions is constructed.
The following sections discuss the motivation for this work and thesis objectives.
The methodology and the thesis contributions are addressed. Lastly, this chapter explains
the thesis outline.
1.1
Research Motivation
People spend a significant amount of time, in their daily routine, interacting with
social network applications such as Twitter and Facebook. Every time people use credit
cards, their purchase data is not only being tracked but also the products that are being sold
to which group of customers are stored. People and companies are using cloud-based email
services such as those services provided by Yahoo and Google. This is because they offer
compelling functionalities and assign huge amounts of user repositories. These email
providers are using algorithms to scan the email content for keywords aiming to offer some
advertisements toward user interests. For instance, a user may start getting links for hotel
reservations just after receiving a confirmation email about an airline booking.
Having said the above, we believe that many aspects of users’ traits would be
digitally captured in real-time or accumulated for future data analysis. This has turned our
attention to the fact that, with proper analysis of this data an accurate detection of people’s
behaviours can be made and hence their identification factors can be verified, especially
when the results of this analysis are fed into user authentication methods. However, the
continuous flow of high-volume data requires sophisticated data analysis techniques to be
able to examine huge amounts of behavioural evidence so that user traits can be modeled.
In addition, these techniques should have the ability to distinguish between normal and
abnormal actions of users, so that security potential data can be captured.
In this regard, we are in the favor of enhancing the anomaly detection techniques
to be utilized for users’ trait analysis in an attempt that the detected information will
fulfill the needs for the user’s identity verification.
1.2
Research Objectives
The main goal of this research is to build a users’ behaviour analyzer engine to
automatically and accurately detect a range of abnormal actions among high-volume, fast,
and mutable streams of users’ data. The result of these detections should be enough to
structure and develop security user profiles. These profiles provide an image of sensitive
information about the users by which a strong real-time user authentication model can be
designed. In other word, the main goal of this research is to design and implement accurate
and complete models for the DSA, BDA, and JitHDA components within Ouda’s
authentication framework described above. It worth mentioning that, this work has been
build based on the assumption that, all data source is free from any fraud transactions.
The following are the research objectives that support the above goal.
1. Investigate anomaly detection techniques and recent innovative research done in this
and then chose the most effective characteristics to build a novel study for anomaly
detection in Big Data applications.
2. Based on the previous objective (Study for anomaly detection techniques in Big Data),
develop an anomaly detection model that is suitable for Ouda’s user authentication
framework with choosing the best evaluation method.
3. Create a prototype for user authentication systems using anomaly detection outcomes
by generating a sample of user profiles.
1.3
Research Methodology
This section describes the methodologies that are applied in this research for each
objective to design and implement the anomaly detection for user the authentication
framework as follows:
Objective one is a novel study for anomaly detection techniques based on Big Data
which can be completed by the following tasks:
- Explore all anomaly detection techniques including the recent research that is
related to Big Data applications.
- Study the Big Data characteristics, sources, features, and applications and choose
the most common V’s related to anomaly detection problems.
- Extract three factors in anomaly detection techniques through the recent research
that match or are related to the chosen Big Data characteristics.
- Identify and classify the collected anomaly detection techniques based on the
factors – Big Data characteristics combination from the previous task.
- Create two comparative studies for the most common techniques in supervised and
unsupervised learning for the recent research papers with specific factors for all
Objective two is designing an anomaly detection model which can be completed by the
following tasks:
- Choose the most commonly used unsupervised techniques based on Big Data
anomaly detection classification and the comparison study provided.
- Apply most of the popular binary evaluation methods to choose the suitable one for
our research case and develop two sequential accuracy algorithms to make sure the
existing evaluation methods calculate the sequential accuracy.
- Apply the chosen unsupervised techniques from task one in this objective and tune
them with several parameters on nine different experiments.
- Assume different models that are combined from the chosen techniques to get more
analyzation and accuracy.
- Obtain the best model with the best accuracy for every experiment.
Objective Three is developing a user authentication prototype which can be completed
by the following tasks:
- Choose and analyze the experiment results that are suitable for user profile
generation using a specific criterion.
- Design and create user profiles for a sample of anomalous cases from the suitably
chosen anomaly detection results for profile features that are compatible with the
Ouda’s user authentication framework.
- Provide a scenario for creating challenging questions based on the user profiles for
user authentication recommending specific rules to match the high level of security.
- Validate the final challenging questions in the user authentication framework with
1.4
Research Contribution
This thesis focuses on designing and implementing an anomaly detection technique
suite for Ouda’s user authentication framework. Initially, it offers a study on Big Data for
anomaly detection techniques which has three classifications. These classifications are
completed based on three Big Data characteristics that are related to the three factors in
anomaly detection techniques; Volume with data features, Variety with the natural types
of data, and Velocity with computational complexity. Each one of the classifications
describe the common machine learning (ML) techniques that are used in recent research.
These classifications helped me to choose the best model fit with the best problem. Two
comparison studies (supervised and unsupervised techniques) over a number of recent
research papers are presented for the chosen ML models with specific comparison factors
and some research paper standards.
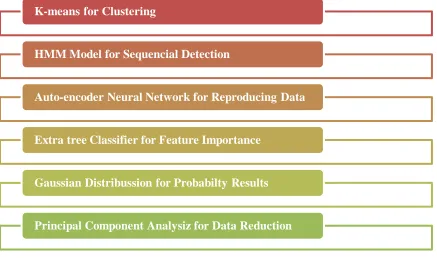
This thesis also proposes an anomaly detection (AD) model that contains a
combination of several techniques that are suitable for Big Data applications. The AD
models are combined with several machine learning techniques; K-means, Hidden Markov
Model (HMM), Auto-Encoder NN, and Gaussian Distribution. In total, the applied models
and techniques are seven; the four basic techniques and three combined as follows: 1)
K-means with Auto-encoder NN, 2) HMM with Auto-encoder NN, and 3) K-K-means, HMM
and Auto-encoder NN. These models are applied on nine different experiments and give
good detection results. The experiments are applied to a variety of fields such as financial
payment systems, insurance systems (health, auto, home), computer server monitoring
systems, and network transmission systems. Figure 1.2 shows the nine experiments related
to the fields and sizes. Most of the common evaluation methods are applied in this thesis.
Confusion matrix, true positive rate (TPR), and true negative rate (TNR) are chosen for
Figure 1.2: Nine Experiments, Fields and Sizes
Finally, this thesis proposes a scenario of generating security questions based on a
desired anomaly detection model and user profiles. This scenario provides strong examples
of challenging questions from a sample of user profiles that are created after anomaly
detection analyzation has been done on Big Data.
The research contributions of this thesis have been published in several conference
proceedings in the areas of information security and data analytics. Therefore, these
contributions have been peer-reviewed by experts in the field.
1.5
Research Outline
The thesis structure is ordered as follows. Chapter 2 provides a literature review of
anomaly detection techniques and background on the user authentication system as well as
theoretical information of the most commonly used anomaly detection techniques. In
Chapter 3 we present and discuss anomaly detection techniques in Big Data applications
by providing three classifications for the commonly used anomaly detection techniques.
An anomaly detection model is discussed in high detection accuracy as well as how this
final model is combined and chosen with result discussions in Chapter 4. Chapter 5
discusses a scenario on how a challenging question would be created using anomaly
detection results including how user profile generation is achieved. Chapter 6 concludes
Chapter 2
2
Literature Review and Background
This chapter presents a literature review of the current anomaly detection
techniques on Big Data and the known classifications. It also presents an in-depth concept
of anomaly detection and its mechanism in some applications as well as commonly used
anomaly detection techniques. Finally, it overviews user authentication techniques in
general and explains more details in the related knowledge-based applications.
2.1
Literature Review
The term “anomaly” is defined as something that deviates from what is standard,
normal, or expected. In data science, a data anomaly is not far from this definition.
However, the deviation from the standard or expected data might be due to errors in the
data or due to correct data that is triggered by uncommon, but accurate actions. In both
cases, the detection of these deviations is desirable whether to correct the errors (if any),
or to gain better insight on data. Many anomaly detection techniques exist in academic
literature, and share the same purpose, that is to differentiate between what is normal and
abnormal.
There are three broad categories of anomaly detection that are classified based on
the type of the datasets they are working on, i.e., whether the data is labeled or not.
Supervised anomaly detection techniques detect anomalous data based on the available
labeled data for both anomalous and normal labels. Unsupervised techniques detect
anomalous data based on unlabeled data. Semi-supervised anomaly detection techniques
assume that the labels exist only for normal data, while the anomalous data is detected [2].
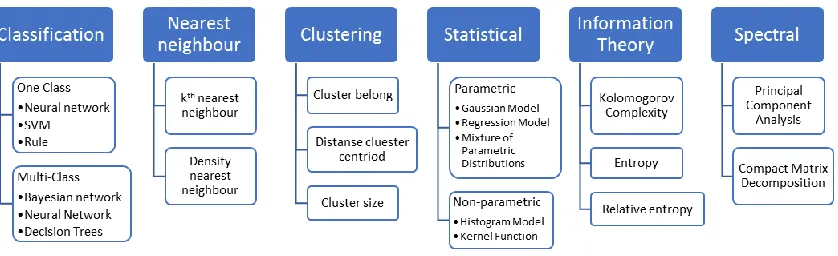
Under these three categories, anomaly detection techniques can be further divided
into six subcategories. Although there are many classifications in the literature, we will
address the most common approach among researchers. Figure 2.1 illustrates this
classification approach. Classification techniques build classifiers based on labeled training
sets to distinguish between normal and abnormal test data and are most likely used as a
similarity or distance between samples to detect the anomalous data. Clustering techniques
group the data to detect the individual or group anomalies among normal group data.
Spectral techniques embed the data into a smaller subspace to find the differences between
normal and abnormal data. These three groups are mainly used to further classify both the
semi-supervised techniques. Moreover, statistical and informational theories would be
used to classify the unsupervised techniques. Statistical techniques assume high probability
for normal data and low probability for anomalous data. Information theory techniques
detect anomalous data through the irregular information content in the dataset. The reason
behind this classification is highlighted by the following scenarios. Each scenario describes
the applicable types and examples that would be used.
Figure 2.1: Anomaly Detection Categories
There are many popular classifiers that have been used in anomaly detection such as
neural networks, support vector machine, Bayesian networks and rule [2] - [6]. In the
nearest neighbour category, there are two types of techniques, namely, kth nearest
neighbour and density nearest neighbour. The former computes the anomaly score using
the similarity between a data sample and its kth nearest neighbour. However, the later
computes anomaly score using the relative density of each data sample. Similarly,
clustering techniques have three types based on three assumptions:
1) Anomalies do not belong to any cluster but normal data belongs to a cluster.
2) The closest data to a cluster centroid is normal data whereas the far data are anomalies.
Statistical techniques can be divided into parametric and non-parametric types. The
normal data is produced using a parametric distribution in parametric type such as Gaussian
Model, Regression Model, and Mixture of Parametric Distributions. But a non-parametric
type does not consider any parametric distribution such as histogram model and kernel
function. Information theoretic techniques use several measures to analyze the information
content using Kolomogorov complexity, entropy, and relative entropy. The spectral
techniques use dimensional reduction techniques by employing Principal Component
Analysis (PCA) and Compact Matrix Decomposition. Figure 2.2 summarizes the above
scenarios including the examples and types of anomaly detection techniques.
Figure 2.2: Anomaly Detection Techniques Types and Examples
Our aim in this work is to shed light on Big Data-enabled anomaly detection
techniques. Researchers define Big Data as datasets that possess the characteristics of the
3Vs (Volume, Variety, and Velocity). Volume refers to the scale of the data. Variety refers
to the heterogonous data presentations such as unstructured, semi-structured, and
structured data. Velocity refers to the pace at which data is generated. When data becomes
Big Data, the above classifications of anomaly detection needs to be reinvestigated (in a
later chapter).
Chandola, et al. [2] discussed the anomaly detection techniques with several
aspects. However, the authors do not include the characteristics of Big Data in their survey.
Moreover, Rana, et al. [6] give guidelines for Big Data but it is specific to a data stream
type. Other recent surveys study the characteristics of anomaly detection against some
other types of datasets. Also, Patil and Biswas [8] have an anomaly detection survey with
only video datasets. While some surveys concentrate on some types of data, other research
papers have an emphasis on a specific anomaly detection application. For example, Anand,
et al. [9] Al-Musawi, et al. [10] have anomaly detection surveys on Border Gateway
Protocol and online social networks respectively. Kaur and Singh [11], Fanaee-T and Gama
[12], have anomaly detection surveys which include general information for most
techniques without a real implementation.
This literature review includes many anomaly detection techniques that need to be
explained. The next section will give the important background information for anomaly
detection mechanisms and the techniques that will be used in this research.
2.2
Anomaly Detection Techniques
Generally, anomaly detection works with both supervised (detection of anomalous
data based on the labeled data for both anomalous and normal labels) and unsupervised
(detection of anomalous data based on unlabeled data) machine learning techniques.
Furthermore, the reasons to prefer an unsupervised machine learning technique in anomaly
detection systems, even if there is a labelled 0 for normal and 1 for anomaly data are:
- A small number of positive (anomalous) data
- A large number of negative (normal) data.
- The existence of many different types of anomalies, which makes it hard for an algorithm to learn, especially if positive data is small.
- And, in this work, the user authentication application requires to deal with unlabeled data (the labels will be used only for the evaluation part).
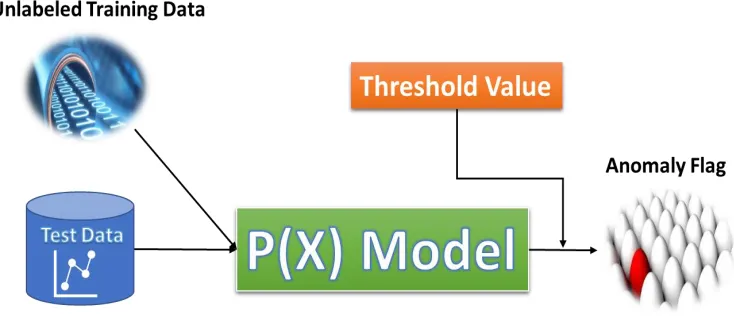
An anomaly detection approach is when an unlabeled training set is used to build a
model P(x); where p is the type of model (probability, clustering, or hierarchy), and x is
some data attributes (A.K.A. data features, or just features) of the unlabeled training set.
Therefore, an anomaly detection model of x has been built, then new instances (a test set)
should be analyzed. If p of x-test is less than some specific criteria such as the threshold
model mechanism will be more transparent by explaining some existing anomaly detection
applications.
Figure 2.3: Anomaly Detection Diagram
The next section will explain in detail some examples of anomaly detection
applications. Moreover, if a platform has many users, and each of these users takes different
activities, the platform such as a website can compute different data features of users’
activities.
Using these features, the model can be built to produce some results like, “what is
the probability of different users behaving different ways?” and “what is the probability of
features of a user’s behaviour?” At this point, the user’s activity features are known from
the model results that is already built. An example of that could be “how often a particular
user logs in or does transactions?”
Finally, the model can identify the strange user behaviour on the platform by
checking the results under a threshold value. It can also create users’ profiles for more
analysers or request further verification from those users to guard the platform against
strange or fraudulent behaviour. This system is used by many online platforms to detect
not only stolen or fraudulent behaviour but also the abnormal behaviours for any further
purposes.
Another anomaly detection application can be applied in the manufacturing process
to enhance future manufacturing. A third example of anomaly detection application is in
monitoring computer systems in a data center that utilizes online and offline machine
learning techniques to detect abnormal computer behaviours such as different amounts of
memory use, different numbers of disc accesses, and different CPU loads. The machine
learning techniques used in these applications are very widely different. However, there
are several popular unsupervised machine learning techniques what will be explained in
the next section and used in this research.
The purpose of this work is to build and create a unique knowledge-based
authentication system that relies only on the abnormal actions of users to be the base of the
challenging questions. This system utilizes the anomaly detection technique such that the
answers of the challenging questions are known only by the legitimate user and easy to
remember.
Anomaly detection techniques have been successfully used in Big Data
applications, user profile-based systems, and unsupervised-based techniques. Recent
research has increased in Big Data applications for anomaly detection system such as [13]
– [17]. In [13], Gupta, et al. developed an advanced system with a highly accessible feature
that is suitable for Hadoop clusters monitoring in real-time. In paper [14], Abu Sulayman
and Ouda stated a unique vision for Big Data applications in anomaly detection techniques.
This unique insight has a practical application using two machine learning techniques and
three new classifications. Mehnaz and Bertino in this paper [15] suggested the anomaly
detection approach which established strong user profiles by analyzing the timestamp data
of users’ files and the temporal characteristics using a multilevel temporal data structure.
Henriques et al, presented machine learning techniques which have self-learning user
profiles in IDS systems [16]. Research [17] proposed a technique that detected the trends
of abnormal behaviour then alerts the administrator and the user in real-time. Three kinds
of techniques; regression, unsupervised classification, and simple statistical techniques
were tested. Sometimes, it is vital to have an anomaly detection system that is suitable in a
Other recent research has explored user profile generation for anomaly detection in
specific databases [18] – [22]. A database proposal is designed for anomaly detection to
develop the accuracy of database anomaly detection and to generate the users' profiles
accurately in [18]. A technique is proposed to find the anomalous data in database using a
classification machine learning technique by Ramachandran et al. in [19]. Pannell and
Ashman proposed an IDS system for a host-based behaviour that utilized user profiles in
anomaly detection to characterize every behaviour by combining the results of multiple
features to develop detection performance [20]. A software prototype is improved by
Corney et al., which recognized anomalous data based on behaviour patterns, then alarms
administrators when such data are recognized [21]. The research paper [22] introduced a
novel user profiling mechanism which covered all accessible resources and relevant
characteristics upon on the cybersecurity perspective. The proposed technique contained
seven profiling principles to collect user information and more than 270 characteristics to
generate the user security profile. Many machine learning techniques are suitable for user
profile AD systems, although, clustering-based techniques, HMM’s, and Auto-encoder
neural networks are more commonly used in recent AD research.
K-means clustering based technique has been increased in recent research in AD
systems. Jeyauthmigha and Suganthe designed a network anomaly detection frame with
three clustering techniques in two stages: training and detection. The stages used three
algorithms computed one after another. One of the algorithms is K-means clustering [23].
Ahmed proposed a hybrid technique for the anomaly detection framework. The hybrid
technique has two algorithms: one is clustering the input network traffic dataset to create a
collective anomaly, and one is re-clustering [24].
Iyer, et al. [25] presented fraud detection using a Hidden Markov Model, which is
trained with the normal user behaviour and tested for both normal and fraud user behaviour.
Also, they compared HMM with other methods to prove that HMM is the more preferred
method. Zhu, et al. introduced a framework for anomaly detection using the Hidden
Markov Model and Support Vector Machine to detect the abnormal events. They deployed
the method on an IDS system to evaluate results [26]. Rahmani and Almasganj utilized
task [27]. Wang, et al. described the entire process of fraud detection using the Hidden
Markov model and K-means algorithm. The model is trained using the normal user
behaviour account to detect not accepted behaviour by considering the high probability as
fraudulent [28].
Our approach compares three machine learning techniques; K-means
clustering-based technique, HMM model, and Auto-encoder neural networks to detect anomalies in
high accuracy as part of a user authentication framework. These three techniques have the
different internal structure to discover the anomalous data. The understanding of internal
structure improves the implementation results. Though, the internal structure of these
techniques is explained briefly in the following subsections to simplify the resulting
discussion.
2.2.1 Extra-Tree Classifier
Extra Tree (extremely randomized trees) classifiers are an ensemble learning
method fundamentally based on decision trees. It randomizes certain decisions and subsets
of data to minimize over-learning from the data. It builds multiple trees and splits nodes
using random subsets of features. More variation in the ensemble will introduce how we
can build trees [29]. Each decision base will be built with the following standards: • All the data available in the training set is used to build each stump.
• Any node is performed using the best split which is determined by searching in a subset of randomly selected features. The split of each selected feature is chosen
at random.
• The maximum depth of the decision base is one.
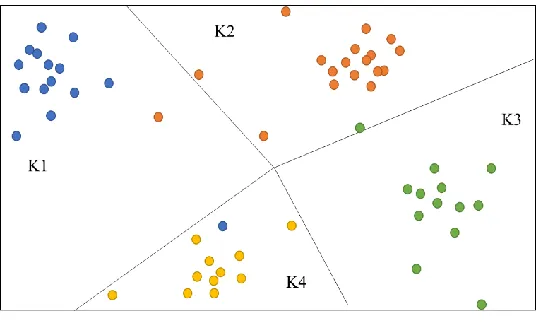
2.2.2 K-means Clustering
K-means clustering is one of the unsupervised anomaly detection techniques that
proves its’ high accuracy results in this domain. The main idea of the K-means clustering
technique is to initialize several centroids Ks (as shown in Figure 2.4) based on randomly
generated points within the data domain. Then, it will calculate the distance between every
centroid’s positions based on the distance calculation. At the end, every data sample n
should belong to the nearest cluster.
Figure 2.4: K-means Clusters
Clustering is a process of classifying data observations into different classes. Each
cluster has a centroid. The observations in one cluster have great similarity, but
observations between different clusters have less similarity. Suppose X = {x1, x2, x3, ⋯ , x𝑛} is a dataset in a given space. The data observation is classified by n numbers of clusters where C (1 < C < n) clusters based on their similarity. The cluster centroids are:
𝑪𝒓=
𝟏 𝒏𝒓
∑ 𝑿𝒊(𝒓)
𝒏𝒓 𝒊=𝟏
(2. 1)
The objective function of clusters is:
𝒎𝒊𝒏 ∑ ∑|𝑿𝒋(𝒊)− 𝑪𝒊| 𝟐
𝒏𝒊 𝒋=𝟏 𝑪
𝒓=𝟏
(2. 2)
Where i = 1,2,3, ⋯ , n ; 𝑛𝑟 is the number of data observations in cluster r;
represents that data observation (Xi) belongs to cluster r ; r = 1,2, ⋯ , C ; C (1 < C <
n) represents the number of cluster centroids; and n is the total number of data observations in the dataset [30], [31]. Finally, the algorithm can be summarized in five steps:
2) Assign data observations to clusters
3) Calculate the similarity between observations and centroid.
4) Update the cluster centroids positions
5) Repeat steps 2, 3, and 4 until no movement for centroids.
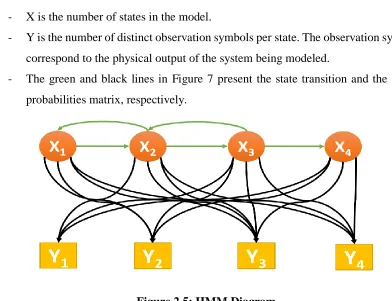
2.2.3 Hidden Markov Model
The Hidden Markov Model (HMM) has two hierarchy levels, which makes a
multiple embedded stochastic process. HMMs can be used to analyze much more
complicated stochastic processes as compared to a traditional Markov model. HMMs
contain a set of transition probability matrices related to a finite set of states. The state
outcome or instance is produced using an accompanying probability distribution. It is only
the outcome and not the state that is visible to an external observer. HMMs have many
typical applications in various areas such as speech recognition, bioinformatics, and
genomics. Three main components can characterize an HMM as the following list and
Figure 2.5 explain:
- X is the number of states in the model.
- Y is the number of distinct observation symbols per state. The observation symbols
correspond to the physical output of the system being modeled.
- The green and black lines in Figure 7 present the state transition and the output
probabilities matrix, respectively.
The HMM is a doubly stochastic model, expanded from the basic Markov model.
A Markov chain contains a set of states, S = {s1, s2, s3, … . , s𝑟}. The process starts in one of these states and moves successively from one state to another. The probability of moving
from one state to another does not depend on which states the chain was in before the
current state.
HMM is an underlying stochastic process that is not observable but can only be
observed through another set of stochastic processes that produce the sequence of observed
symbols. An HMM is notated as λ = (A, B, π ), where, A is the state transition probability matrix, B is the observation symbol probability matrix, and π is initial state probability
vector.
There are three key problems for HMM when given the observation sequence O = {O1, O2, O3, … . O𝑇} and the HMM λ = (A, B, π ):
• How to work out the probability Pr(O|λ ).
• How to choose a state sequence I = {i1, i2, i3, ⋯ , i𝑟}
• How to adjust the model λ = (A, B, π ) parameters to maximize Pr(O|λ ) .
HMM is a powerful model for anomaly detection. We can use HMM to build a
model of normal behaviour where the HMM’s states represent some unobservable
conditions of the system [32]. The HMM based anomaly detection method takes the
following steps:
1) Train HMM based on normal observations.
2) Calculate the system state of the normal behaviour.
3) Calculate the system state of the new data behaviour.
4) Detect anomalies.
2.2.4 Neural Network - Auto-Encoder
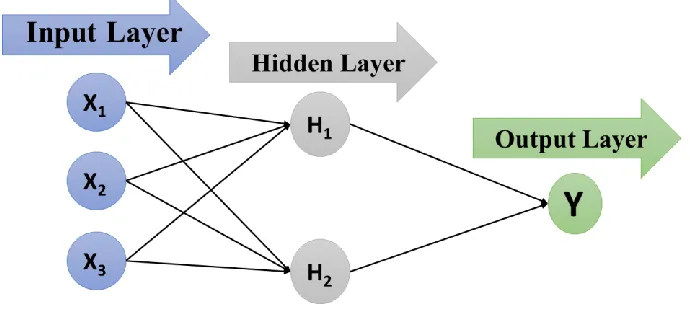
Artificial neural network (ANN) is one of the most common network architectures.
Basically, a simple artificial neural network only includes one or two hidden layers in
addition to the input layer and output layer, from which is also a processing component
the dataset. Then, the hidden layer can be one or more layers based on the problem
complexity and the neural network type. Finally, the output layer will generate the result
of this technique. The number of neurons for each layer depends on the data size and
network type. All the neurons - except the output one - are connected to the neurons in the
next layer with weights values. A neural network has several techniques that are frequently
used in anomaly detection classifications due to their capability to classify the classes of
datasets and their high accuracy in noisy data. These techniques are applicable to one class
and multiclass problems. Feed forward neural, Auto-encoder neural, Recurrent neural, and
Convolutional neural networks are the most popular neural networks that are used for
anomaly detection techniques.
Figure 2.6: Simple Artificial Neural Network
Auto-encoders are a form of neural networks that attempt to learn an approximation
of the identity function and reproduce the input to the output format. Accordingly,
auto-encoders do not require any label or output to be trained or learn how to reconstruct the
input. A simple auto-encoder can be formed from an input layer, one hidden layer and an
output layer. The hidden layer usually has a smaller dimension than the input layer in order
to learn the latent space representation of the input. The output layer usually has the same
dimensions of the input layer since it is trying to predict it. Figure 2.7 shows a basic
Figure 2.7: Auto-Encoder neural network Model
An auto-encoder includes two parts: encoder and decoder. The encoder aims to
compress input data into a low-dimensional representation, and the decoder reconstructs
input data based on the low-dimension representation generated by the encoder.
Furthermore, an auto-encoder can encode a representation of an input layer into a hidden
layer and then decode it into an output layer [33].
The auto-encoder based anomaly detection method takes the following steps:
1) Encoding the input data.
2) Reconstruct the data through the decoding.
3) Calculate the reconstruction error.
4) Use a threshold value for the reconstruction error to assign anomalies data.
2.2.5 Gaussian Distribution Model
To perform anomaly detection through Gaussian distribution, there is a need for
data distribution. Given a training set {x(i), ⋯ , x(m)} ; where 𝑥(𝑖)∈ 𝑅𝑛 the Gaussian distribution should be estimated for each of the features. For each feature i = 1, ⋯ , n , the parameters µ𝑖and 𝜎𝑖2 that fit the data in the i-th dimension should be found for each
example.
𝝆(𝒙; 𝝁, 𝝈𝟐) = 𝟏
√𝟐𝝅𝝈𝟐𝒆 −(𝒙−𝝁)𝟐
𝟐𝝈𝟐 (2.3)
Where µ is the mean and 𝜎2 controls the variance. Gaussian parameters which are
(µ𝑖 𝜎𝑖2) of the i-th feature will be estimated using equation 4 for the mean and equation 5
for the variance.
𝝁𝒊= 𝟏 𝒎∑ 𝒙𝒊
(𝒋) 𝒎
𝒋=𝟏
(2.4)
𝛔𝒊𝟐= 𝟏
𝒎∑(𝒙𝒊 (𝒋)
− µ𝒊)𝟐 𝒎
𝒋=𝟏
(2.5)
The first function is to take the input data and output an n-dimension vector mu that
holds the mean of all the n features and another n-dimension that holds the variances of all
the features. After calculating the parameters, we need to select a threshold.
One way to determine which examples are anomalies is to select a threshold based
on an F1 score on a cross validation set. The F1 score is computed using precision (prec)
and recall (rec) using equation 6, 7, and 8:
𝑭𝟏= (𝟐 ∙ 𝒑𝒓𝒆𝒄 ∙ 𝒓𝒆𝒄) (𝒑𝒓𝒆𝒄 + 𝒓𝒆𝒄)⁄ (2.6)
𝒑𝒓𝒆𝒄 = 𝐭𝐩 (𝐭𝐩 + 𝐟𝐩)⁄ (2.7)
𝒓𝒆𝒄 = 𝐭𝐩 (𝐭𝐩 + 𝐟𝐧)⁄ (2.8)
Where 𝑡𝑝 is the number of true positives, 𝑓𝑝 is the number of false positives, and
𝑓𝑛 is the number of false negatives.
2.3
User Authentication
Recently, user authentication has become the most popular topic in information
security research environments. The definition of user authentication is stated as the
challenge is a method used to distinguish between true or false authentication requests.
User authentication has a variety of techniques that can identify the valid users in protected
resources as it is shown in Figure 2.8. User authentication can be broadly classified into
four groups based on something the user “is”, “knows”, “has”, and “does”. Usually, body parts are used in “something the user is” which are called biometric technology such as a
fingerprint. Mostly, “Something the user has” uses a physical (non–body parts) thing to
authenticate the user, for example, cards, keys, and so on. “Something the user knows”
uses the user’s knowledge such as an ID number, or Password. “Something the user does”
is a new user authentication process that has been researched in recent years. This uses the
user’s activities such as Knowledge-based authentication (KBA) [34].
Figure 2.8: User Authentication Techniques
KBA is an authentication system in which the user should answer a set of
challenging questions (or at least one) to be authorized. Generally, the challenging
questions have two major categories; static and dynamic [35]. The static questions are the
most commonly used, but it is considered weak authentication. One common application
for a static security questions is “Fallback Authentication” that is a backup for
authentication techniques in the lost cases. Moreover, fallback authentication is usually
used when people lose their authentication access due to changes or forgetting the
authentication requirements such as forgetting a password or username. Fallback
authentication identifies the user through personal information and allows the authenticated
user to re-access their resources [36]. However, this static question is a vulnerable way to
User Authentication Techniques
Something you are
Part of the user
Biometric
Something you know
Knowledge
ID Password PIN
Something you have
Owning
Cards Keys
Something you do
Activities
ask in Fallback Authentication because the answers can be found easily in many sources,
especially in social media [37].
The second type of challenging questions have more invulnerability than the first
type due to the dynamic way of asking the questions. These dynamic questions are
generated using credit or a public user’s information, which makes it sometimes easy to
find, especially in social media apps [35]. The stronger way to produce a secure dynamic
question achieves a more secure system against any fraudulent or abnormal activities [39].
As a result, unique dynamic security questions should be investigated with several
features; a set of challenging questions based on abnormal user activities using short term
history and is not repeated. This new way of asking the dynamic security questions can be
generated based on studying the abnormal activities of the user behaviour utilizing anomaly
Chapter 3
3
Big Data Anomaly Detection Classification
The literature review in chapter 2 shows that the most common classifications in
anomaly detection techniques have a lack of Big Data insights. Our main contribution in
this chapter is to shed light on Big Data anomaly detection techniques.In this chapter, three
classifications of anomaly detection techniques in Big Data will be provided based on the
Big Data definition in chapter 2. Three specific factors in anomaly detection techniques
will be considered for the classifications with the related three big data characteristics. The
factors combine with the characteristics as shown in Table 3.1.
Table 3.1: Anomaly Detection Factors with Big Data Characteristics
Anomaly Detection Factors
Time Complexity
The Nature of the Data
The Data Features
Big Data Characteristics Velocity Variety Volume
3.1
Velocity - Time Complexity Classification
Anomaly detection can act as two major categories based on computational
complexity, because the velocity of big data will affect the algorithm’s time, including all
the previous categories as shown in Figure 3.1. Linear computational complexity is a lower
time complexity for the techniques. On the other hand, quadratic computational complexity
is a higher time complexity. In addition, new types of applications for anomaly detection
have been recently raised.
Each category in time complexity uses both techniques; supervised and
unsupervised. In the linear time, the linear SVM and decision tree under the classification
techniques are examples of linear supervised techniques. The unsupervised techniques for
linear time include clustering, statistical, information theory, and spectral. On the contrary,
quadratic supervised techniques have SVM and neural network classifiers. Similar to linear
unsupervised techniques, quadratic unsupervised techniques have four types; nearest
neighbour, clustering, statistical, and spectral.
3.2
Variety - Data Nature Classification
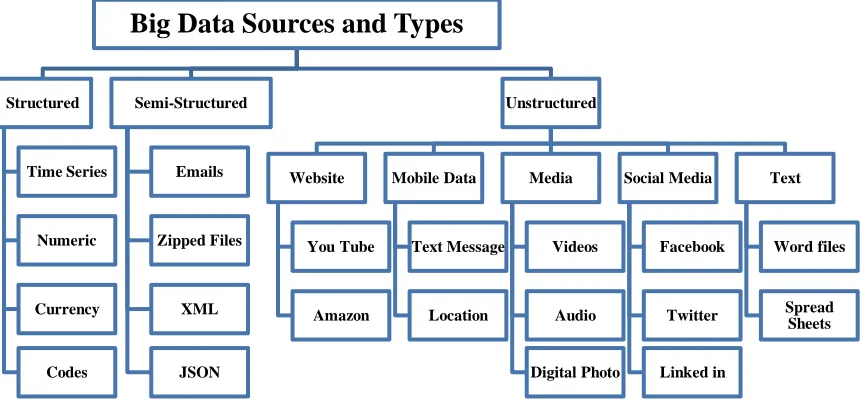
There are several types of data that can affect the classification of anomaly detection
techniques as shown in Figure 3.2. In general, the data has three types based on the data
structure. 1) Structured data is organized information that can be easily stored, entered, and
analyzed, 2) Semi-structured data is semi-organized information that has some sort of
properties, and 3) Unstructured data is not organized information such as free documents
or files. Under these three data types, the Big Data sources are listed with many examples.
Figure 3.2: Big Data Sources and Types
Anomaly detection can be grouped into four categories based on the nature of the
data because the variety of Big Data will affect the algorithm type, which is shown in the
previous figure. These four categories are the most popular data sources which are time
Big Data Sources and Types
Structured
Time Series
Numeric
Currency
Codes
Semi-Structured
Emails
Zipped Files
XML
JSON
Unstructured
Website
You Tube
Amazon
Mobile Data
Text Message
Location
Media
Videos
Audio
Digital Photo
Social Media
Linked in
Text
Word files
series, text, social media, and media. Every data source has some commonly used anomaly
detection technique as shown in Figure 3.3.
Figure 3.3: Variety – Data Nature Classification
Time series, under the structured data as explained before in figure 4, includes five
popular anomaly detection techniques; statistical, clustering, nearest neighbour,
classification, and deviation. For every type, there are several examples. Unstructured data
has many important sources; however, the major source is chosen. Text source is one of
the major unstructured data sources that has many relations for other sources such as
mobile data and websites. The text data have statistical, classification, and clustering
anomaly detection techniques. Also, social media is an unstructured data source that has
several anomaly detection techniques based on behavioural and structural approaches.
Likewise, media sources are an important unstructured data source which will be divided
into image and video data. Image data varies with four anomaly detection techniques;
classification, clustering, statistical, and nearest neighbour. Video data includes nearest
neighbour, clustering, and some classification techniques such as SVM and neural network.
3.3
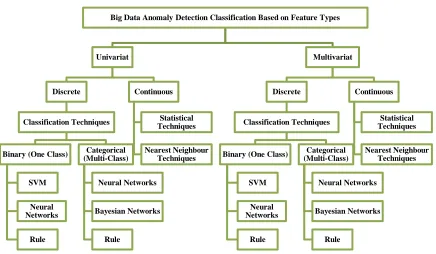
Volume - Data Feature Classification
The anomaly detection techniques can be broken into two major categories based
on feature types, because the volume of Big Data will affect the anomaly detection
techniques; univariant and multivariant techniques as shown in Figure 3.4. Under each
Figure 3.4: Volume - Data Feature Classification
The classification techniques under the discrete type will be divided into one class
and multi-class for both feature types. On the other hand, the continuous data will have
statistical and nearest neighbour techniques for both feature types.
3.4
Comparison Study
A comparative study of support vector machines and neural network techniques
will be presented. We will compare between the techniques based on selected factors which
will allow researchers to drive critical thinking ideas such as choosing a suitable model for
certain problems and conditions. The criteria of choosing the research papers depend on
two shared factors: the approach type (SVM or NN) and anomaly detection problem. The
result of this study is expressed in Table 3.2 for SVM and neural network respectively.
Only Neural Network will be implemented in this thesis because it will be suitable for our
application. However, SVM has been researched in term of helping researchers choosing
the best model regarding their problems. Where AUC represents Area Under Curve.
Big Data Anomaly Detection Classification Based on Feature Types
Univariat
Discrete
Classification Techniques
Binary (One Class)
SVM
Neural Networks
Rule
Categorical (Multi-Class)
Neural Networks
Bayesian Networks
Rule
Continuous
Statistical Techniques
Nearest Neighbour Techniques
Multivariat
Discrete
Classification Techniques
Binary (One Class)
SVM
Neural Networks
Rule
Categorical (Multi-Class)
Neural Networks
Bayesian Networks
Rule
Continuous
Statistical Techniques
![Figure 1.1: The main components of Ouda’s user authentication framework [1]](https://thumb-us.123doks.com/thumbv2/123dok_us/1888608.1246767/21.612.122.526.269.481/figure-main-components-ouda-s-user-authentication-framework.webp)