Jurnal Teknologi, 38(D) Jun. 2003: 47–66 © Universiti Teknologi Malaysia
A GENETIC ALGORITHM FOR SOLVING SINGLE LEVEL LOT-SIZING PROBLEMS
NASARUDDIN ZENON1, AB RAHMAN AHMAD2 & ROSMAH ALI3
Abstract. The single level lot-sizing problem arises whenever a manufacturing company wishes to translate an aggregate plan for production of an end item into a detailed planning of its production. Although the cost driven problem is widely studied in the literature, only laborious dynamic program-ming approaches are known to guarantee global minimum. Thus, stochastically-based heuristics that have the mechanism to escape from local minimum are needed. In this paper a genetic algorithm for solving single level lot-sizing problems is proposed and the results of applying the algorithm to example problems are discussed. In our implementation, a lot-sizing population-generating heuristic is used to feed chromosomes to a genetic algorithm with operators specially designed for lot-sizing problems. The combination of the population-generating heuristic with genetic algorithm results in a faster convergence in finding the optimal lot-sizing scheme due to the guaranteed feasibility of the initial population.
Key words: Genetic Algorithm, Lot-sizing
Abstrak. Masalah pensaizan lot satu aras timbul apabila suatu syarikat pengeluar ingin menjanakan perancangan pengeluaran terperinci bagi produk berpandukan suatu perancangan agregat. Walaupun masalah ini telah dikaji dengan meluas, hanya pendekatan pengaturcaraan dinamik dapat menjamin penyelesaian yang minimum secara global. Maka heuristik-heuristik stokastik yang mampu melepasi minimum tempatan adalah diperlukan. Kajian ini mencadangkan kaedah algoritma genetik untuk menyelesaikan masalah-masalah pensaizan lot satu aras, serta membincangkan beberapa contoh aplikasi kaedah tersebut. Dalam pelaksanaan kaedah ini, heuristik penjanaan populasi pensaizan lot yang dapat menjanakan populasi awal digunakan untuk menyediakan kromosom. Kromosom ini digunakan sebagai input untuk algoritma genetik dengan operator-operator yang khusus bagi masalah pensaizan lot. Gabungan heuristik penjanaan populasi dengan algoritma genetik menghasilkan penumpuan yang lebih pantas dalam proses mendapatkan skim pensaizan lot yang optimum disebabkan oleh ketersauran populasi awal yang digunakan.
Kata kunci: Algorithm Genetik, Pensaizan lot 1.0 INTRODUCTION
In manufacturing environment, a lot size refers to the amount of a particular item that is ordered from the plant or issued as a standard quantity to the production process. Lot-sizing or lot size scheduling refers to the determination of appropriate lot sizes of items to be produced in each period of the production planning horizon such that the
1,2&3
setup and the inventory holding costs associated with the schedule for the whole of the planning horizon are minimized.
The single level lot-sizing problem without backlogging is to find a feasible produc-tion schedule of end items over a time horizon consisting of T period such that the total inventory holding cost plus the setup cost is minimized. Assumptions made in this problem are that the initial inventory is zero and the first period demand is non-zero. Let dt, pt, and It be the demand rate, production quantity and inventory level at
the end of period t respectively for t = 1, 2, …, T. Furthermore let C be the total variable cost which is the sum of the setup cost (S) plus the unit holding cost (h). The math-ematical formulation of the problem can be stated as follows:
Minimize:
∑
= + = T t t t hI p S C 1 ] ) ([ δ (1.0)
Subject to:
It–1 + pt – It = dt (t = 1,2,…,T)
I0 = 0
pt, It≥0 (t = 1,2,…,T) Where:
0 0
( )
1 0
δ = >=
t t t if p p if p
The lot sizes are simply the accumulated demands for each order interval and thus
equal to
∑
e
t t=c
p where 1 ≤ c ≤ e ≤ T. Item deliveries are planned only for periods with
positive demands. If the demand in an order receipt period is zero, the order receipt is moved ahead to the first subsequent period with a positive requirement [19].
The Wagner-Whitin algorithm (WWA) [20] and its variants, which are dynamic programming approaches in solving the single level lot-sizing problem as described previously, are the only known algorithms that will guarantee convergence to the opti-mum solution of the lot-sizing problem. However, the algorithms are often criticized as being difficult to explain and compute. For this reason, WWA often serves as a benchmark against which to measure the performance of non-optimal but less com-plex lot-sizing approaches [19].
in later periods for inclusion in the current production lots provided the shift will result in a feasible schedule that yields cost savings. However, the heuristics use different criteria in deciding whether or not a shift is favorable.
Given dt, the demand in period t, the setup cost S and the holding cost per unit per time h, it is favorable to include dk in the production xt if,
1. Silver-Meal criterion (SM) [16]:
1
1 1
( 1) ( 1) ( 1)
− − ≤ − −
∑
∑
k k t t t= t=S + h t d / k S + h t d / k
2. Groff criterion (GR) [6]:
( 1) 2 / , >− t≤ k k d S h k t
3. Least-unit cost criterion (LUC):
1
1 1 1 1
( 1) ( 1)
−
− ≤ −
∑
∑
∑
∑
k k k k
t t t t
t= t= t= t=
S + h t d / d S + h t d / d
4. Part period balancing criterion (PPB) [12]:
1
1 1
( 1) ( 1)
−
−
∑
k − t ≤ −∑
k − tt= t=
S h t d S h t d
5. Freeland-Colley criterion (FC) [7]:
h(k – 1)dt≤ S, k > t
6. Incremental part period algorithm criterion (IPPA) [4]:
1
( −1) ≤
∑
k t t=h t d S
A problem usually encountered when search heuristics based on the above criteria are used in scheduling lot-sizes is that the heuristics got trapped on a local optimum. The schedules might appear to become optimal, or rather locally optimal, with re-spect to total cost, only because the search heuristic is not able to proceed any further. For example, the Silver-Meal heuristic is an efficient technique with reasonable cost performance (with respect to equation 1.0) for lot-sizing problems having determinis-tic time-varying demand requirements. However, as the variation in demand increases, as reflected in higher values of coefficient of variation in demand, the performance of the algorithm deteriorates (please refer to [21] and [14] for detailed results). Silver [17] noted that this method guarantees only a local minimum in the total relevant costs per unit time for the current replenishment. Furthermore there are two situations in which the algorithm can lead to significant cost penalties in Equation 1.0. These are: 1. When the demand pattern drops rapidly with time over several periods. 2. When there are a large number of periods having no demand.
Real world demand data for production is unfortunately characterized by uncer-tainties such as random fluctuation and non-uniformity. Heuristics based on deter-ministic criteria such as discussed above have been proven to fail in handling stochas-tic phenomena. This gives the motivation to examine GA for solving the lot-sizing problems. Thus, in this paper we examine the usefulness of developing a genetic algorithm specifically tailored for solving single level lot-sizing problems.
2.0 AN OVERVIEW ON GENETIC ALGORITHMS
Holland [9] defines genetic algorithms (GAs) as adaptive algorithms, which simulate the analyzed evolutionary strategies in biological systems. GAs are biological para-digms in the field of computer science. In this sense, GAs are considered as approxi-mate methods.
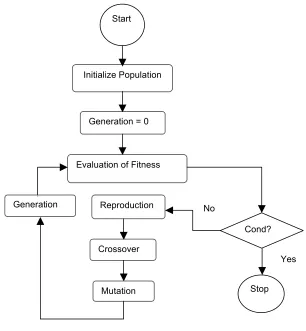
A genetic algorithm consists of a set of individuals that make up a population. Every individual is represented by a specific chromosome and each chromosome represents a solution. Each chromosome is a string of genes. The population will pass through a generation cycle which simulates evolutionary strategies like genetic opera-tion, selection and mutation. The termination of a genetic algorithm is defined by two events [8]:
• Reaching the maximal generation rate or
• Reaching a solution or strategy in the actual population which represents a local optimum.
muta-tion. A GA begins its search with a random set of solutions, instead of one solution as it is normally done in classical search and optimization methods. The random set of solutions constitutes a generation of population.
The process of identifying good (user defined or simply above average) solutions in a population and eliminating bad solutions by replacing them with multiple copies of good solutions while maintaining a constant population size is basically the func-tion of the reproducfunc-tion operator.
No Start
Initialize Population
Generation = 0
Evaluation of Fitness
Reproduction
Crossover
Mutation
Cond?
Stop Generation
Yes
Obviously as noted by Deb [3], by making more copies of good solutions at the expense of not-so-good solutions, the reproduction operator cannot create any new solution in the population. Therefore more operators are needed to create new solu-tions, and they are namely the crossover and the mutation operators.
Crossover is defined by Holland [9] as an operation by which an offspring solution is obtained from two candidate solutions of a population, generally referred to as parent solutions. Let Sa and Sb be two candidate solutions of the population, then
Crossover: Sa × Sb → Sρ where Sρ, the offspring, is desirably another valid solution of
the population. The crossover operator is mainly responsible for the search aspect of GA, even though the mutation operator is also used for this purpose [3].
The expected fitness values of the offspring are usually better than the parent be-cause prior to the crossover process the reproduction operator had already reproduced parents with some good bit combinations in their string representations (please refer to [5] for a detailed and a more convincing explanations).
In binary GA (all the chromosomes are made up 1’s or 0’s), the mutation operator is a bit-wise mani pulator that changes a 1 to a 0 and vice versa, with a mutation probability of pm. The significance of the mutation operator is that it can reduce the
chance of the search from being entrapped in a neighborhood of a local optimal point. Although the allowable probability of mutation to occur is quite small, nevertheless the operator is very important in GA. The role of mutation which is equivalent to a random search is to provide a guarantee that GA is not trapped on a local optimum. Negnevitsky [13] explains that the sequence of selection and crossover operations may stagnate at any homogeneous set of solutions. Such stagnation can lead to all chromo-somes being identical, and thus the average fitness of the population cannot be im-proved. Therefore, a mechanism is required to prevent the search from being en-trapped in a neighborhood of a local optimal point.
There is a very strong reason as to why mutation is usually used with a small prob-ability in GA. The mutation operator has a constructive as well as destructive effect. Although, along with selection and crossover operators, it can help find different opti-mal solutions, it can help little in preserving useful solutions over a large number of generations [3]. As mutation can create a better solution through perturbation, it can also destroy a good solution through the same perturbation. Therefore, as of today’s state of technology allows, diversity-preservation through mutation must be kept at a minimal.
GAs, when applied to scheduling, view schedules as individuals of a population. The fitness of an individual is measured by the corresponding values of the objective function. The fitness function value of a solution is a metric that measures a relative merit of the solution based on an objective function (for a single-objective optimiza-tion problem with constraints) such as given in Equaoptimiza-tion 6.1 and constraint funcoptimiza-tions. For each generation, the genetic operators will be applied to the generation if a termi-nation criterion is not met.
A basic problem usually encountered as far as lot-sizing is concerned is the genera-tion of valid populagenera-tion members to be operated on by GA operators for a particular MPS schedule. Thus a method is required to generate an initial valid population of lot size schedules with respect to the MPS schedule. Another problem encountered du-ring crossover is the generation of children as a result of the crossover process that does not preserve the accumulation of demands at a non-zero demand point and thus producing invalid lot-size schedules.
popula-tion-generating heuristic described in the next section. The following sections also described effective crossover and mutation schemes employed to preserve schedules validity throughout the GA process.
3.0 POPULATION-GENERATING HEURISTIC
This section presents an approach for representing initial sequence of lot-sizing sched-ules for known, discrete demand rates in a fixed horizon environment, which can be fed to GA prior to performing reproductions and crossovers.
The basic idea is to start with feasible schedules and to compute a set of new schedules having fitness function values as defined by the objective function while preserving the order quantity patterns in order to maintain the validity of the new schedules. A single-point crossover scheme is used to preserve characteristics prop-erly between the old schedules and the new schedules. This encoding/crossover step satisfies the completeness and the characteristics-preserving criteria outlined in [10]. The characteristics-preserving criterion is considered in [11] as one of the most impor-tant criteria to be satisfied in solving any difficult ordering problems.
In order to accomplish the characteristics-preserving criterion in the design of en-coding/crossover for the lot-sizing problem, we have to examine the order quantity patterns suggested by other lot-sizing algorithms. One of the most important observa-tions is that most replenishment algorithms work backward in time from the end of the planning horizon. Shortages will never occur for the demands in the later periods when sufficient production quantities are pushed backward in time.
The other observation is that the production schedules have the same patterns for demand requirements with non-zero periods and the ones with zero order periods. Thus, in order to preserve the validity of any proposed production scheme, the encod-ing/crossover design in GA must inherit the two observed characteristics.
As said in the introduction our assumption is that each demand vector dt has dis-crete values that came from fixed horizon environments. The basic idea of the lot-sizing population-generating heuristic is to start shifting productions backward in time from the end of the horizon systematically while retaining enough inventories to satisfy demands in the later period. This backward shifting of productions will create alter-nate or subsequent periods with zero production levels thus minimizing the overall setup cost.
Algorithm 1: Population-Generating Heuristic (BA) For j=1 to T
a(j) = d(j) /* The initial demand vector from MPS */
While () do /* The number of times backshift is performed is T-3 times */ Step 1: /* Backward shifting of production quantities aj */
While (i > posAllele) do If a(i-posAllele) > 0
For t = (i-(posAllele-1) to i If a(t) ≠ 0
a(i-posAllele) = a(i-posAllele) + a(t) a(t) = 0
End If End For End If End While
Step 2: /* Assignment of aj to chromosome vector pop1(j). If period 1 and period 2 have non-zero lot-sizes, generate 1 more chromosome pop2(j) */
For j=1 to T pop1(j) = a(j)
If (k=1) OR (i ≤ posAllele) AND pop1(2) ≠ 0 pop2(1) = a(1) + pop1(2)
pop2(2) = 0 for j=3 to T
pop2(j) = pop1(j) Else
inheritParent = inheritParent + 1 End If
Step 3: /* Create an exception for the case when T is divisible by the number of shifting steps. */
If (T % (posAllele +1) = 0 For j=1 to T
pop2(j) = 0 Else
If (inheritParent = 2) For j=1 to T
pop2(j) = d(j) inheritParent = 0
End If
Step 4: /* dual shift processes */
/* For every chromosome popk(j) in Step 1, dual shift processes are generated by shifting productions aj only to the left of the period h = T/2 + 1.The dual shift process is similar to the above 3 steps except for the following replacements: */
i ← h = T/2 + 1 pop1(j) ← pop3(j) pop2(j) ← pop4(j)
/*For an exception case when T is divisible by the number of shifting steps, a replacement T ← T/2 + 1 is required for testing the divisibility condition. */
End While
The index variable posAllele is the position of the allele or feature value in the chromosome. Step 2 and Step 3 can be combined in a single step. However, for the sake readability, the steps are separated in the algorithm given. Step 4 is necessary in order to simulate lot size schedules with accumulations of production at least at two periods, one in the beginning and one in the middle of horizon. The main advantage of performing this step is the availability of more useful chromosomes with non-zero crossover points.
4.0 OPERATORS AND THE ALGORITHM 4.1 The Encoding
4.2 The Crossover Scheme
We used a single-point crossover scheme at a locus (string position) having a non-zero allele (feature value) in both parents. This way, the children generated will preserve the accumulation of demands at a non-zero demand point as required by the charac-teristic-preserving criterion discussed in [10] and [11]. As an additional note, we used the probability of crossover pc = 1.0 and the probability of mutation, pm = 0.001 for
MPS requirements having T ≤ 30 tested in this research. Let us assume each chromosome is created according to: For i = 1 to N
For j = 1 to T Sij = popij
Then, select a pair of chromosomes for mating from the current population. An elitist ranking selection with stochastic remainder without replacement known as Goldberg’s selection scheme [5] is used. In this scheme, parent chromosomes are selected with a probability related to their fitness. Highly fit chromosomes are se-lected with a higher probability.
For the selected pair of parent chromosomes Ssjand Stj placed in the mating pool,
where 1 ≤ s,t ≤ N and for 1 ≤j ≤ T, the crossover points between these chromosomes are determined following the formula below [15]:
Crossover point cp =
(
(
( ) ( )
( )
)
)
tj sjsj S F S F T
S F T T
+ −
−
* 2
*
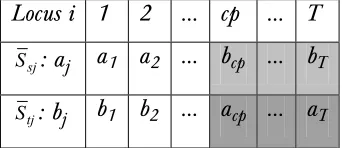
If the allele in Ssj at locus point cp acp≠ 0, and the one inat the same locus point bcp ≠ 0, then perform the swapping in Table 1 to produce Table 2:
Locus i 1 2 … cp … T
sj
S : aj a1 a2 … bcp … bT
tj
S : bj b1 b2 … acp … aT
Table 2 New chromosomes obtained after swapping
Locus i 1 2 … cp … T
Ssj: aj a1 a2 … acp … aT
Stj: bj b1 b2 … bcp … bT
Ssj and Stj will replace the two currently lowest ranking chromosomes in the population.
However a situation arises when either acp or bcp or both equals zero. If either acp or
bcp equals zero then the Goldberg selection scheme is used to replace either Ssj or Stj.
On the other hand if both acp and bcp equal to zero, then the same scheme is used to
replace both parents in the mating pool with different chromosomes. This cycle is repeated until both acp and bcp are not equal to zero.
4.3 The Mutation Operator
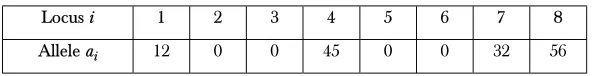
For lot-sizing problems, designing the mutation operator can be a sticky problem. The characteristic-preserving criterion will not be preserved by simply swapping a non-zero allele with a 0. To illustrate the problem let us consider a real-parameter GA having a chromosome listed in Table 3. Let the chromosome represent a lot-sizing for a planning horizon of eight-week periods.
Locus position 4 for example, may represent the accumulation of productions of items for periods 4, 5 and 6 i.e. periods having 0 production after period 4. If we were to simply mutate 45 to 0 then the new chromosome obtained will no longer be valid. Therefore a bit-wise mutation operator as defined in Section 6.2 will not work for our problem.
In this research a modified mutation operator for lot-sizing problems is implemented as follows:
Choose a mutation point i with a probability pm = 0.001 If ai = 0 then
Let ai ← ak and ak ← 0 where k = min {t : at≠ 0}Tj+1 If ai≠ 0 then
ai–1← ak–1 + ai ai ← 0
Using the above operator, if for example i = 4 is chosen as the mutation point then the new lot-size sequence will be 12-0-45-0-0-0-32-56, which is still a valid schedule. On the other hand if i = 5 is chosen by the operator, the new lot-size sequence will be 12-0-0-45-32-0-0-56, and this sequence is also valid.
The location of the next mutated locus point is determined by an exponential distri-bution. The mean of the distribution is assumed to be µ = 1/pm. A “mutation clock” as suggested by Goldberg [5] is used in determining the next mutation point. The proce-dure is as follows:
Locus i 1 2 3 4 5 6 7 8
Allele ai 12 0 0 45 0 0 32 56
Create a random number r ∈ [0,1] Let
The next mutation point
4.4 The Genetic Algorithm for Lot-sizing The flow of the implemented algorithm is as follows:
Algorithm 2: A GA for lot-sizing
1. Generate an initial population of size N using BA: Let Sij = popij for 1 ≤ s,t ≤ N, 1 ≤ j ≤ T
2. Calculate the fitness of each individual chromosome according to Equation 6.1: T
j=
=
∑
≤ ≤1
( ij) ( j j) for 1
F S cs + hi i N
3. Select a pair of chromosomes for mating from the current population using Goldberg’s selection scheme. Determine crossover point cp using Rommaniuk’s [15] formula.
4. While (acp∈ Ssj = 0 OR bcp∈ Stj = 0) do
If acp∈ Ssj = 0,
Select a chromosome using Goldberg’s selection scheme and replace the first parent Ssj.
If bcp∈ Stj = 0,
Select a chromosome using Goldberg’s selection scheme and replace the second parent Stj.
Determine crossover point cp using Rommaniuk’s [15] formula. End While
5. Create a pair of chromosomes with probability pc by applying the single-point
crossover scheme. Calculate the chromosomes fitness (as in step 2).
6. Delete two chromosomes with the worst fitness from the population and include the two offspring from step 5 in the population.
7. Create a chromosome with probability pm by using the modified mutation opera-tor described previously after determining the next mutation locus point using Goldberg’s mutation clock. Calculate the chromosomes fitness (as in step 2). 8. Delete a chromosome with the worst fitness from the population and include the
9. Go to step 3, and repeat the process until the termination criterion is satisfied.
Applying conventional termination criteria can be problematic in GA. Because GAs use a stochastic search method, the fitness of a population may remain stable for a number of generations before a superior chromosome appears [13]. It is a common practice to terminate a GA after a specified number of generations. In our case, we allow cycle involving step 3 through step 8 to be repeated until an optimal solution (obtained previously using WWA) has been found.
In order to test the performance of BA-GA we compared the schedules produced by BA-GA to those obtained from WWA. In the first two examples that we used for benchmark, WWA has always managed to produce schedules with the optimum total costs. However, Axsater [1] noted that when a limited “forecast window” has to be used in connection with a rolling horizon implementation scheme, it is anyway not possible to obtain the optimal solution. Since heuristics are usually less sensitive, with respect to the length of the horizon, they may under such circumstances even outper-form the WWA (please refer to [1] and [2] for details).
Two other heuristics used for comparison were the Silver-Meal heuristic [16] and the least unit cost (LUC) heuristic which were favored mostly for their simplicity and reasonable cost performance.
5.0 NUMERICAL EXAMPLES
All the results obtained in this section are based on applying several previously pub-lished benchmark examples to BA-GA and a simulated annealing (SA) approach [22] developed using Java 2 on a Pentium III processor with a clock speed of 450 MHz, with 128MB of memory, and running Windows 98. All the other benchmark algo-rithms namely WWA, SM and LUC were also programmed using the same language in a similar environment.
Three datasets with various cost structures were used to test BA-GA. Each dataset contains a demand vector Dj for 1 ≤ j ≤ T where T ≤ 30 in all cases. The three datasets
which are benchmark problems taken from [19], [18] and [17] are given in Table 4, Table 5 and Table 8 respectively.
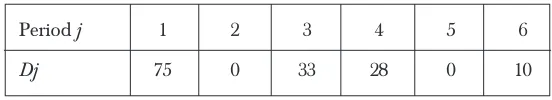
Table 4 Dataset 1: Production request for 6 periods
Period j 1 2 3 4 5 6
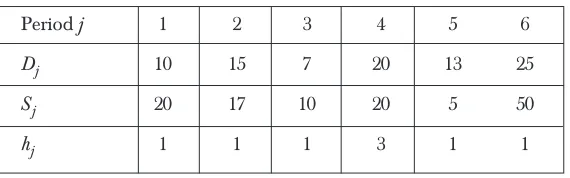
Dataset 1 contains 2 periods with zero demand whereas each period in Dataset 2 has non-zero demand. For Dataset 1 we used a constant setup cost of 100 for each period and a holding cost of 1. On the other hand, Dataset 2 imposes production penalties in certain periods by way of large setup (Sj) and holding (hj) costs.
We compared the feasible lot-sizing schedules produced by BA-GA with optimal and near optimal schedules produced by other algorithms. Table 6 and Table 7 sum-marized the results when BA-GA is compared with WWA, SM, LUC and SA.
The feasible production schedules for Dataset 1 that were generated using BA prior to crossover are given in Appendix A. Appendix B lists the production schedules for Dataset 2 prior to crossover. As shown in Table 6, pop(4,j) for 1 ≤ j ≤ 6, is the required schedule to minimize the total variable cost. The results show that BA is capable of producing near optimal production schedules even prior to being manipulated by the crossover operator in GA.
The results from applying BA-GA to Dataset 2 showed the superiority of BA-GA compared to SM, LUC and SA in producing schedules involving variable setup and holding costs. Chromosome pop(1,j) has a fitness value representing cost penalty that is less than 1% from the optimal WWA.
Performance of BA-GA in terms of convergence rate is measured using demand data listed in Table 8. Two important cost structures are used. The setup and the holding costs for the first cost structure is S = RM2.6 and h = RM2.39 respectively. The second cost structure has S = RM300 and h = RM0.2. While the first cost structure has an S/h ratio circa 1, thus allowing a lot of periods to have positive production
quanti-Table 5 Dataset 2: Production request for 6 periods
Period j 1 2 3 4 5 6
Dj 10 15 7 20 13 25
Sj 20 17 10 20 5 50
hj 1 1 1 3 1 1
Table 6 Comparative results for Dataset 1
Period j 1 2 3 4 5 6 TotalVariable
Dj 75 0 33 28 0 10 Cost, C
WWA 75 0 71 0 0 0 258
Production SM 75 0 71 0 0 0 258
Quantity LUC 75 0 61 0 0 10 328
SA 75 0 71 0 0 0 258
ties, the second cost structure on the other hand will force the algorithms to produce schedules with sparse production periods due to the very high setup cost relative to the holding cost.
Table 7 Comparative results for Dataset 2
Period j 1 2 3 4 5 6 TotalVariable
Dj 10 15 7 20 13 25 Cost, C
WWA 10 22 71 20 38 0 94
Production SM 32 0 71 20 13 25 124
Quantity LUC 32 0 61 33 0 25 158
SA 32 0 71 20 38 0 99
BA-pop(1,j) 25 0 27 0 38 0 95
Table 8 Dataset 3: Production request for 30 periods
Period Demand Period Demand Period Demand
j Dj j Dj j Dj
1 81 11 50 21 77
2 67 12 47 22 96
3 53 13 7 23 64
4 96 14 88 24 87
5 35 15 20 25 51
6 65 16 25 26 7
7 27 17 88 27 85
8 81 18 74 28 82
9 84 19 62 29 53
10 32 20 52 30 96
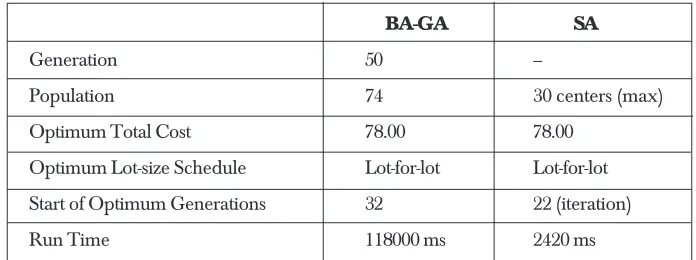
The result of applying GA to a BA generated population is compared to the result obtained by SA. The optimum schedule for the first cost structure is known to be a lot-for-lot assignment because of the small difference in the setup and holding costs. A population list of 74 lot size schedules that was generated by BA from the demand data of Table 8 is available upon request from the first author. The convergence pat-tern of BA-GA to the optimum total cost is compared to the result produced by SA and is depicted in Figure 2 and Figure 3 for the first and the second cost structures respectively.
Figure 3 Convergence of BA-GA and SA for the second cost structure 2300
2350 2400 2450 2500 2550 2600
1 2 3 4 5 6 7 8 9 10 11 12 13 14 15 16 17 18 19 20 21 22 23 24
SA BA-GA
Generation
Total Cost
Figure 2 Convergence of BA-GA and SA for the first cost structure
50 100 150 200 250 300 350
1 3 5 7 9 11 13 15 17 19 21 23 25 27 29 31 33 35 37 39 41 43 45 47 49
BA-GA SA
Total Cost
6.0 CONCLUSIONS
In this paper an implementation of generic algorithm for capacitated single-level lot-sizing problems have been described. Three modifications made to the standard GA are the way the initial population is generated using BA heuristic, the proposed cross-over and mutation schemes necessary in maintaining valid schedules throughout the process. Although the standard definition of mutation operator requires only a modi-fication of a single gene in a chromosome, for lot-sizing problems, we could not de-sign one that fit the definition. Nevertheless, for the intended purpose, the operator is sufficiently useful.
Table 9 Results of BA-GA and SA with the first cost structure
BA-GA SA
Generation 50 –
Population 74 30 centers (max)
Optimum Total Cost 78.00 78.00
Optimum Lot-size Schedule Lot-for-lot Lot-for-lot
Start of Optimum Generations 32 22 (iteration)
Run Time 118000 ms 2420 ms
Table 10 Results of BA-GA and SA with the second cost structure
BA-GA SA
Generation 25 –
Population 74 5 centers
Optimum Total Cost 2312.20 2312.20
Optimum Lot-size Schedule Table 11 Table 11
Start of Optimum Generations 20 6 (iteration)
Run Time 12530 ms 250 ms
Table 11 The optimum lot-size schedule produced by BA-GA and SA
Period 1 8 14 21 27
Production 424 301 409 382 316
A restrictive condition imposed by our implementation of the crossover operator is the requirement of finding a crossover point having non-zero allele values at both parents. This will entail an extra step for finding a perfect match every time a crossover is to be performed. Our conjecture is for lot-sizing problems this condition is a neces-sary and sufficient one.
Clearly, for the non-capacitated lot-sizing example above, SA outperforms BA-GA in terms of run time and convergence rate. This is due to the fact that our implementa-tion of SA is designed to examine the neighborhoods of at most 30 center points corresponding to the 30-periods planning horizon. BA-GA on the other hand requires a large initial population size so that the randomized crossover and mutation opera-tions can produce good reproduction candidates.
However, the performance of BA-GA for problems with production penalties in some periods is encouraging. BA-GA outperforms SM, LUC and SA in terms of achieving a lower total production cost. BA is able to produce near optimum sched-ules as candidates for reproduction at a very early stage thus enabling GA to selec-tively work on ‘good’ chromosomes.
REFERENCES
[1] Axsater, S. 1984. Design and Evaluation of a Lot Sizing Heuristic. Proceedings of the 3rd International Symposium on Inventories. 431-442.
[2] Blackburn, J. D., R. A. Millen. 1980. Heuristic Lot-sizing Performance in a Rolling-Schedule Environment.
Decision Sciences. 11(4): 691-701.
[3] Deb, K. 2001. Multi-Objective Optimization using Evolutionary Algorithms. Chichester: Wiley.
[4] De Matties, J. J., A. G. Mendoza. 1968. An Economic Lot Sizing Technique. IBM Systems Journal. 7(1): 30-48.
[5] Goldberg, D. E. 1989. Genetic Algorithms for Search, Optimization, and Machine Learning. Reading, MA: Addison-Wesley.
[6] Groff, G. K. 1979. A Lot-Sizing Rule for Time-Phased Components Demand. Production and Inventory Management. 20(1/4): 47-53.
[7] Freeland, J. R. and J. L. Colley. 1982. A Simple Heuristic Method for Lot Sizing in a Time-Phased Reorder System. Production and Inventory Management. 23(1/4): 15-21.
[8] Hofestadt, R. 1995. Computer Science, Supercomputing and Biology-Bioinformatics. Simulation Practice and Theory. 2(4-5): 7-15.
[9] Holland, J. H. 1975. Adaptation in Natural and Artificial Systems. Ann Arbor, MI: MIT Press.
[10] Kobayashi, S., I. Ono and M. Yamamura. 1995. An efficient genetic algorithm for job shop scheduling problems. Proceedings of the 6th International Conference on Genetic Algorithms. pp. 506-511.
[11] Kobayashi, S., I. Ono and M. Yamamura. 1996. A genetic algorithm for Job shop scheduling problems using job-based order crossover. Proc. IEEE on Genetic Algorithms. pp. 547-552.
[12] Mendoza, A. G. 1968. An Economic Lot Sizing Technique II: The Part-Period Algorithm. IBM System Journal. 7: 39-46.
[13] Negnevitsky, M. 2002. Artificial Intelligence: A Guide to Intelligent Systems. Harlow, England: Addison Wesley.
[14] Ritchie, E. and A. K. Tsado. 1986. A Review of Lot-sizing Techniques for Deterministic Time-Varying Demand. Production and Inventory Management. pp. 65-79.
[16] Silver, E. A., H. C. Meal. 1973. A Heuristic for Selecting Lot Size Requirements for the Case of a Determin-istic Time-Varying Demand Rate and Discrete Opportunities for Replenishment. Production and Inventory Management. 14(2): pp. 64-74.
[17] Silver, E. A., R. Peterson. 1985. Decision Systems for Inventory Management and Production Planning, Second Edition. John Wiley & Sons.
[18] Taha, H. A. 1992. Operations Research: An Introduction. Fifth Edition. Singapore: Mac Millan.
[19] Tersine, R. J. 1994. Princi ples of Inventory and Materials Management. 4th ed. New Jersey: Prentice-Hall, Inc. [20] Wagner, H. M., T. M. Whitin. 1958. Dynamic Version of the Economic Lot Size Model. Management
Science. 5: pp. 89-96.
[21] Zenon, N., A. R. Ahmad. 2001. A Neural Network Classifier for Single Level Lot-sizing Techniques.
Journal of Parallel, Neural and Scientific Computing, accepted for publication.
Appendix A
Chromosomes generated by BA for Dataset 1
pop[0][j]: 75.0, 0.0, 33.0, 28.0, 0.0, 10.0 pop[1][j]: 75.0 0.0 61.0 0.0 0.0 10.0 pop[2][j]: 75.0 0.0 61.0 0.0 0.0 10.0 pop[3][j]: 108.0 0.0 0.0 38.0 0.0 0.0 pop[4][j]: 75.0 0.0 71.0 0.0 0.0 0.0 pop[5][j]: 75.0 0.0 33.0 28.0 0.0 10.0 pop[6][j]: 136.0 0.0 0.0 0.0 0.0 10.0
Appendix B
Chromosomes generated by BA for Dataset 2
pop[0][j]: 10.0, 15.0, 7.0, 20.0, 13.0, 25.0 pop[1][j]: 25.0 0.0 27.0 0.0 38.0 0.0 pop[2][j]: 25.0 0.0 27.0 0.0 13.0 25.0 pop[3][j]: 32.0 0.0 0.0 58.0 0.0 0.0 pop[4][j]: 10.0 42.0 0.0 0.0 13.0 25.0 pop[5][j]: 10.0 15.0 7.0 20.0 13.0 25.0 pop[6][j]: 10.0 15.0 65.0 0.0 0.0 0.0 pop[7][j]: 25.0 0.0 65.0 0.0 0.0 0.0 pop[8][j]: 52.0 0.0 0.0 0.0 13.0 25.0