ABSTRACT
SPRUFERA, JOHN, FITZGERALD. Cognitive Aid Use During Complex Off-Nominal Tasks: Considerations of Modality and Additional Functionality on Performance. (Under the direction of Dr. Anne C. McLaughlin).
Cognitive Aid Use During Complex Off-Nominal Tasks: Considerations of Modality and Additional Functionality on Performance
by
John Fitzgerald Sprufera
A dissertation proposal submitted to the Graduate Faculty of North Carolina State University
in partial fulfillment of the requirements for the degree of
Doctor of Philosophy
Psychology
Raleigh, North Carolina
2018
APPROVED BY:
_______________________________ _______________________________ Dr. Anne C. McLaughlin Dr. Chris Mayhorn
Committee Chair
_______________________________ _______________________________
BIOGRAPHY
TABLE OF CONTENTS
LIST OF TABLES ... iv
LIST OF FIGURES ... v
CHAPTER 1: Cognitive Aid Use During Complex Off-Nominal Tasks: Considerations of Modality and Additional Functionality on Performance ... 1
Introduction ... 2
Introduction to Cognitive Aids ... 3
Dual-Task Paradigm ... 8
Multiple Resource Theory ... 9
Interruptions... 14
Conclusion ... 15
Overview of the Studies ... 15
Experiment 1 - Quantitative Analysis of Performance ... 17
Method ... 17
Participants ... 17
Materials ... 19
Experimental Tasks ... 21
Design and Procedure ... 25
Analysis ... 27
Experiment 2 - Input Design & Aid Interaction ... 35
Method ... 36
Participants ... 36
Materials ... 37
Design and Procedure ... 38
Analysis ... 40
Discussion ... 49
Overview ... 49
Intellectual Merit and Broader Impacts ... 53
Limitations ... 56
Acknowledgements ... 58
References ... 59
LIST OF TABLES
Table 1 Demographics and Experience Data for Experiment 1 ... 19
Table 2 Experiment design and counterbalance groups ... 26
Table 3 Descriptive statistics for the Auditory Task ... 28
Table 4 Descriptive statistics for the Visual Task ... 28
Table 5 Participant self-report on feelings towards tools ... 35
Table 6 Demographics and Experience Data for Experiment ... 37
Table 7 Combinations for input-task/aid interactions ... 39
Table 8 Descriptive statistics for the Auditory Task ... 41
Table 9 Descriptive statistics for the Visual Task ... 41
LIST OF FIGURES
Figure 1 Abbreviated Illustration of the LOAT ... 6
Figure 2 Illustration of the separate resource channels ... 10
Figure 3 Illustrations of cognitive aid and ventilator simulator ... 22
Figure 4 Illustration of the visual aid as seen on the tablet ... 24
Figure 5 Total Time (in seconds) ... 29
Figure 6 Number of Final Errors ... 29
Figure 7 Number of Initial Errors ... 30
Figure 8 Error rates before interruption vs. immediately after interruption ... 33
Figure 9 Time Taken (Aid Modality * Input Modality) ... 43
Figure 10 Initial Errors (Aid Modality * Input Modality) ... 44
Figure 11 Final Errors (Aid Modality * Input Modality) ... 44
Figure 12 Number of Changes (Aid Modality * Input Modality) ... 45
Figure 13 Subjective Workload ... 46
Figure 14 Average Tool Usage by Modality ... 47
CHAPTER 1
Cognitive aids provide an alternative solution when the task itself cannot be changed or modified to become more usable (Harrison et al, 2006). For example, in an ideal world, a DVD player with a poor user interface would be redesigned with a better user interface. Unfortunately, the purchased DVD player cannot be modified, necessitating a cognitive aid to support user performance. However, despite best intentions, cognitive aids can be rife with usability issues of their own (Goldhaber-Fiebert & Howard, 2013). For example, consulting a complicated checklist while trying to program the DVD player could result in worse performance than if the checklist never existed. Using this example, worsened performance might come from an overload of the visual resource. Looking back and forth while remembering information may overwhelm or slow the user. Although a cognitive aid is intended to alleviate resource demands, it may end up reassigning those demands in ways that harm performance. For example, an aid designed to reduce memory demands may increase attentional or sensory demands as the user struggles to switch between the aid and the task, leading the user to absorb less information from the aid, or alternatively to perform actions incorrectly on the task.
scrolling/flipping through pages, an interactive cognitive aid requires more hands-on interfacing, which may detract from the time the user in engaged in the task proper, or render the interactivity useless in situations where the user is expected to use their hands.
Predicted by multiple resource theory (Wickens, 1984), the input modality should be considered. A user performing a highly physical task could operate an aid by voice commands, allowing more versatility in aid usage, and continued use even during highly physically
demanding portions of the task. The following experiments examined how using non-conflicting versus conflicting modalities for output and input during aid interaction impacted user
performance, adherence, and workload.
Specific Aims
Experiment 1:
• To investigate how cognitive aid design may benefit from non-conflicting sensory
modalities, we manipulated the sensory modality (visual/auditory) by which the cognitive aid communicated information during tasks that were either visual or auditory, and measured task accuracy, speed, and recovery from interruption.
Experiment 2:
• To investigate the application of different input methods regarding modal conflict, we manipulated input modality (manual/voice) by which the cognitive aid received input, and measured task accuracy, speed, and subjective workload.
INTRODUCTION
Dr. Swanson is an astronaut setting up an experiment designed to test how ambient radioactivity
designed by a team of biologists, with each step carefully planned out and run through several
committees. The protocol for the procedure is presented as a PDF on a tablet. Dr. Swanson
needs to keep picking up the tablet to read the small print while pipetting and trying to hold the
soil packets together in zero gravity. This is the second run-through of this experiment, and Dr.
Swanson remembers their colleague mentioning overcoming a difficulty with several of the steps,
but can’t remember exactly how the procedure had to be changed. Dr. Swanson runs into the
same difficulties as the last scientist on the project: despite everyone’s best efforts, the supplies
and their locations do not match up exactly on the space station as the steps in the procedure.
A PDF procedure ultimately assisted Doctor Swanson throughout the setup, but it clearly was not optimized to the complexity of the situation and possible environmental idiosyncrasies. With such high visual-spatial with visual-verbal components, the written aid vied for Doctor Swanson’s limited visual and verbal resources. If, instead, it transmitted information aurally, it would no longer compete with the primary task. Similarly, with motor tasks such as setting up medical equipment, requiring physical touch to navigate the aid could also create an issue. If, instead, the device and the user could interact through voice commands, this would allow the user to continue to manipulate the device without sacrificing mobility. However, the potential benefit of additional features is not known, nor how to match various task and aid modalities. Variables Potentially Affecting the Efficacy of Cognitive Aids
flights (U.S. Department of Transportation, 1995). Checklists are also used frequently in the medical field due to the traits shared with aviation and aeronautics: complex environments and emphasis on safety (Cheney & Ramsdell, 1987, Hales, Terblance, Folwer, & Sibbald, 2008).
Cognitive aids do not innately enhance performance and poorly designed ones can harm performance, similar to findings that “clumsy” automation could adversely increase workload on the user (Parasuraman et al., 2000). A cognitive aid must be designed to promote adherence and increase performance without hindering the user. The National Transportation and Safety Board (NTSB) explored how to create a good cognitive aid, following the events of the August 1987 crash of Northwest 255 (Turner et al., 1991). They found that the most common issues with checklists included users not utilizing checklists, interruptions during the checklist procedure which could lead to errors and poor performance (Loukoupolis et al., 2009), and items on the checklist not being performed correctly. In sum, despite checklists’ purpose of enhancing the user’s capabilities, some checklists failed to account for how the user would interact with the checklist, such as not using the aid or misinterpreting steps, and accounting for user’s
environment, such as resuming use after interruptions.
Flights can carry up to 77 pounds of pen-and-paper reference material, including
functions such as search features and increased interactivity (Palmer & Degani, 1991). However, human factors related issues arise with a change from paper to PDF. While it may decrease workload in some ways, the EFB and other digital checklists could increase workload in other ways due to reasons such as inefficient design or simply the change in medium. Using a digital aid may require knowledge of the computer system on which it runs, such as knowledge of how to use a tablet device, whereas paper aids require no such learning curve. Furthermore, digital issues such as input latency and scroll and touch sensitivity could increase user frustration. Finally, the immutability of paper creates less mental demand on the user for remembering the location of certain steps or understanding how much of the procedure they have completed; digital aids may scroll, which constantly transforms the page, creating more mental demand on the user to recall the location of a step, or intuit where in the procedure they are.
Developing good cognitive aids is no simple task, and many factors need to be
Levels of Aid Support. Aids can have different level of interaction with the task and user,
especially in regards to information acquisition. These different levels can be described using different levels of automation. Sheridan and Verplanck (1978) created a 10-point scale for levels of automation to indicate how little or how much a computer can aid the user. At lower levels, the computer may nothing or simply highlight relevant information, whereas higher level automation may perform entire tasks without any user input. From this scale, the LOAT (Levels of Automation Taxonomy) was created to further break down the levels of automation based on the four functions of automation (information acquisition, information analysis, decision and action selection, and action implementation), and describes each of these four functions on independent scales (see Figure 1) (Save & Feuerberg, 2014).
Figure 1. Abbreviated Illustration of the LOAT (Levels of Automation Taxonomy) (Save & Feuerberg, 2014)
information analysis scale are the most relevant of the four functions. For information acquisition, pen and paper checklists sit at level 0 or 1, while at level 5 the user receives integrated, filtered data that the system chose based on parameters invisible to the user.
Similarly, level 0 or 1 fits the capacity of pen and paper and PDF aids. Many of the innate tools of using pen-and-paper, such as checking off boxes or making notes in the margins, may situate the checklist at level 2 information acquisition according to the LOAT, whereas the same checklist in PDF format is instead at level 1, which would provide less automation to the user than the paper counterpart.
Choosing what level of information acquisition automation to design into an aid depends on the limitations and requirements of the technology and situation. Palmer and Degani (1991) used two different levels of automation in their aviation cockpit cognitive aids. One issue found with their highly automated (machine monitored) aid was that it largely replaced human
monitoring, rather than acting as a redundant monitor. Palmer and Degani note that this is not necessarily a drawback, but the designers of the cognitive need be aware of the limitations of automation and how the user’s likely loss of situational awareness in a highly automated system
may impact task performance.
way that encourages higher level automation but without intrusion on the user’s working memory capacity.
Summary. How does a designer know what to put into an aid to make it work? Most of
the information available to a designer would come from domain-specific reports, such as the reports from the NTSB and FAA. These reports do not examine how aids can be designed or adapted to the situation or certain contexts, such as designing an aid around a highly visual-spatial task, or the impacts of having voice input over motor input. New research should be conducted on how to build an effective aid.
Dual-Task Paradigm. Wiener and Curry (1980) note that reliance on an aid is similar to a “primary/secondary task inversion,” or a dual-task scenario, where the user may begin to rely heavily on the ‘backup’ to alleviate the cognitive resource demand the simultaneous tasks put on the user. Predicting performance of a single task requires knowledge of what demands the task puts on the user. However, when attention must be split between two or more tasks (e.g., dual-tasks), demands on the user may increase substantially beyond the demands the tasks required individually (Pashler, 1994). Essentially, one plus one does not equal two when it comes to dual-tasks; there is an additional attentional resource cost for completing the two tasks
simultaneously. Performance may degrade to the point of the user failing to complete either task, when they could easily complete those tasks individually before.
Dual-task costs are well studied, typically by having people perform two tasks concurrently and comparing that performance to task performance when only one task is
while sitting. When climbing, participants on average could only recall half the words they saw than when they were stationary. In addition, their climbing speed changed when words were displayed on the HMD, a cost of trying to remember the words.
Another study assessed a dual-task scenario in which participants performed a driving simulation task while conversing on a cellular phone (Strayer & Johnston, 2001). The results indicated that participants would fail to detect traffic signals twice as often, and had slower reaction times. A shadowing task of holding a cellular phone was used to control for any effect of holding the phone on performance. They found that this shadow task was not enough to cause performance declines, which suggested that a dual task required both tasks to have a minimal demand on the users before performance decreases was seen. In sum, dual-tasks are commonly associated with having performance costs, even when the tasks individually are easily performed. These costs are exacerbated when the sensory/code modalities overlap.
Using a cognitive aid alongside a primary task can be examined as a dual task. In both situations there are two information channels that require interpretation and differing resources. Both the cognitive aid and the task occur concurrently; the individual may be reading the cognitive aid or examining a diagram, all while assembling or going through menu options. Because the purpose of a cognitive aid is to increase performance, increase adherence to
standards, and is often used in high stress and temporally demanding situations, it is important to understand how the dual-task costs may influence cognitive aid use. Multiple Resource theory can explain why or how the dual-task paradigm degrades performance, and offer principles for cognitive aid design.
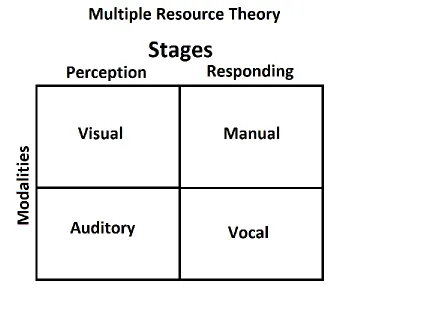
through different channels of information or modalities (see Figure 2). Human sensory
modalities include, but are not limited to, sight and hearing. Code modalities cover verbal and spatial information. MRT predicts that, when two tasks are performed simultaneously, human performance increases if the two tasks require different resources relative to if it instead required the same resources. An example of this most people have encountered can be seen in using GPS devices while driving. Driving is both highly visual and spatial, which would make it hard to perform other visual/spatial tasks simultaneously, such as examining a map. We could say these tasks are in conflict for resources. Instead, GPS devices deliver information through an
auditory/verbal format. The two tasks no longer compete for the same resources, and thus the cognitive workload demand on the user decreases and performance is expected to increase. In this case, the two tasks are non-conflicting (Wickens, 2002).
When a task is not demanding, either because it demands so few resources, or because the user can take as much time as possible in completing the task, MRT no longer predicts performance. When resources are not limited or heavily taxed, other heuristics should guide design processes. For MRT to be applicable to drive design philosophy, two competing channels of information should be complex, temporally demanding, and demanding on user resources.
Although not a traditional dual task, utilizing a cognitive aid while performing a primary task shares many traits of a dual task. There are two separate channels of information happening simultaneously, and both information channels are complex and demands the user’s attention. MRT can guide design principles when creating cognitive aids for different tasks. Designing aids to put the least demand on the user would lead to a r increase in performance and decrease on user workload. To design the best possible cognitive aid, a designer should consider the two input modalities (sensory and code), in addition to how the user interacts with the aid (motor response or by vocal commands).
Sensory Modality. Sensory modality can cover any physical sense of the user. This can
Visual cognitive aids dominate the literature, as many commonly used aids are visual checklists and protocols, or digital adaptations of said aids (Burian, 2006, U.S. Department of Transportation, 1995, Babbitt, 2010). Cognitive aids are, if not physical pen and paper, put on PDFs or a display screen. However, MRT predicts conflict with the highly visual tasks most cognitive aid users tend to perform, such as medical or maintenance procedures. Envision a pilot’s eyes darting between the cockpit knobs and displays and back to the aid in their hands, not dissimilar to the idea of texting and driving. In low-stress scenarios, this may have no impact on performance, but time pressure or high complexity threaten to overwhelm the user, this overlap could slow performance or lead to errors, the exact things an aid is designed to prevent.
Codal Modality. Codal modality covers the verbal (written and symbolic) and spatial
stimuli. Verbal information can include written and spoken word, warning and traffic symbols, and anything that is generally read. Spatial stimuli cover anything interpreted through spatial reasoning or related to space. Examples in technology include speedometers, analog clocks, the order symbols or buttons are presented in, and so forth. Auditory examples can include the directionality of a sound such as a car coming from behind or in front of a driver, or whether and how quickly a tone is rising or falling.
Cognitive aids began as checklists, and are traditionally verbal (Goldhaber-Fiebert & Howard, 2013). Diagrams or pictures may introduce spatial components into aids, however the relationship between a cognitive aid’s verbal or spatial information and impact on task
performance has not been explored in-depth. More attention needs to be given on the relationship between cognitive aid-task codal relationships to understand how these resources compete.
Levels of Conflict. A task is not limited to a single modality. Most often, tasks are a
a visual-verbal task. When two tasks compete, they compete at both the sensory and code levels. Reading a book while reading a text would cause complete conflict as both tasks are visual-verbal. Listening to the sound of a friend’s phone ringing while reading a book would create no conflict, as the second task is auditory-spatial. The avid reader can locate where the phone’s ringing is coming from with minimal distraction from the story. Finally, there remains a partial conflict. Listening to a friend talk on the phone while reading would partially compete for verbal resources, but not for sensory resources as one task is visual, and the other is auditory.
Cognitive aids may not be capable of always avoiding resource competition. Noisy environments may restrict auditory channels, or spatial diagrams might prove impossible depending on the type of aid used. In situations like these, partial conflict may become the best-case scenario as possibilities dwindle. MRT would predict performance would degrade during a partial conflict, but see less performance degradation than a full conflict. Examining performance during different levels of task-aid conflict would give insight into future aid design.
Input Modality. Modality can also vary by how the user interacts with the aid. Similar to
receiving information, inputting commands can also have modal conflicts between two devices. Common are stories of someone biting into their pencil if they were eating chips while writing notes concurrently. This is an example of a dual task where two motor tasks compete for resources. Similarly, it is difficult to carry out a verbal conversation with two people
Given that many cognitive aids assist with motor-dominant tasks, understanding how a user might benefit from the possibility of using vocal commands could further lower the amount of cognitive resources demanded from the user. Similar to making an aid auditory-verbal if the task is visual-spatial, to create the least overlap possible, a motor task might benefit most from an auditory-input aid, so that the user does not have to switch between said motor task and the motor-based cognitive aid. While studies have examined dual-tasks with varied inputs, this has not yet been touched upon in the realm of cognitive aids, especially since many aids are pen-and-paper.
Interruptions. Performing a task rarely occurs in an environment free from distractions. Research on interruptions shows that, on a creative writing task, interruptions caused writers to write fewer words and produce an overall inferior product (Foroughi, Werner, Nelson, & Boehn-Davis, 2014). A study on interruptions during a checklist found that length of interruption and not type of interruption would lead to a greater performance decline (Linde & Goguen, 1987). Another study found that interruptions, regardless of their context, causes more stress to the user and can cause them to rush through the task to compensate for the interrupted time (Mark,
Gudith, & Clocke, 2008). Zijlstra, Roe, Leonora, and Krediet (1999) also found that interruptions cause users to work faster but with detriment to emotion, creating more frustration, and may not necessarily cause a decline in performance. However in both Zijlstra and colleagues (1999) and Mark and colleagues (2008) experiments, the tasks users performed were not off-nominal or were tasks that the participants frequently performed.
PDF is minimal. Inadvertently, switching to digital aids may have removed some functionality that physical pen and paper provided (Burian, 2006). However, aids can be designed specifically to mitigate the effects of interruption by providing working memory support to the user. For example, an aid can show the user the last completed step.
A user’s resilience from interruptions may be impacted by task-aid modal interaction by decreasing their overall workload and frustration. Users at lower workload may resume a task more easily, as there is more cognitive capacity left for recall. Conversely, users at high workload may be at cognitive overload and find it difficult to also recall the last steps they performed.
Conclusion
Cognitive aids can provide working memory support and decrease the workload on the user for complex tasks. This can shorten the duration of a task while increasing performance accuracy. This can positively impact safety, too, if the untimely and inaccurate completion of the procedure would otherwise have health or safety concerns. However, designers have little to look towards when designing digital aids, which can lead to improper aid design and result in poor performance or even user error when put into practice, which is the opposite of an aid’s intent. More research is required to guide developers in creating more efficient digital aids in a wide variety of situations.
Overview of the Studies
aids and benefit more from cognitive aid use than frequently performed tasks which experts have automatized. It was also chosen due to the variety of interfaces a medical ventilator included, such as physical and digital components, and visual and auditory components.
The proposed studies examined factors that impact the effectiveness of a hybrid cognitive aid. It looked at the impact of task-aid display modality on user performance and workload, the effects of interruption on the user during certain steps, and the effects of different input types on user performance. The hybrid aid included a number of functions and tools meant to replicate and expand upon innate affordances of a paper checklist, such as writing notes in the margin or checking off steps. In the studies, the hybrid aid included a number of tools that assisted users during the procedure with the expectation of raising user performance and decreasing workload, comparative to those who have a non-hybrid aid. A second experiment was run to analyze how input differences can impact performance.
Sample size needed for adequate power came from using G*Power. Effect size from previous studies generally showed a small to medium effect size (Wu et al., 2014), and medium effect size was assumed in this experiment and used in the power analysis (effect size = 0.25). The analysis indicated 60 participants was required to reach a power of 0.80.
Hypotheses were:
• Experiment 1
o Non-conflict between aid and task would lead to better performance than a conflicting task-aid interaction.
workload, while modal non-conflict would lead to higher performance and lower workload.
• Experiment 2
o Vocal input would perform superior to manual input, especially when the user is given an auditory aid.
o During sections with high manual labor, the vocal input would also positively impact user performance.
o Natural language input would increase performance more in high conflict (hypothesized to lead to low performance) conditions than in low conflict (hypothesized to lead to high performance) conditions, due to the decrease in conflict that natural language input provides.
Experiment 1 - Quantitative Analysis of Performance
METHOD
Participants
Sixty participants ages 18-35 were recruited from a pool of veterinary students and CHASS (College of Humanities and Social Science) graduate students. These groups are substantially educated and motivated but have no or limited experience with the task of setting up a medical ventilator. Participants were recruited through email. Participants were
compensated $30 for participating in the experiment.
Table 1. Demographics and Experience Data for Experiment 1
M SD
Males/Females 16 Males/44 Females
Age 25.97 3.888
Years in Veterinary Care 2.93 2.780
Knowledge of Ventilator Procedures 1 3.67 1.145
Procedural Checklist Usage 1 3.07 1.006
Non-procedural Checklist Usage 1 2.58 1.013
Paper Folding Score 2 13.72 3.88
Shipley’s Score 3 33.08 3.37
ANT (Alerting) 4 38.53 26.954
Note. 1 were on a 5 point Likert scale (1 = Never, 5 = Frequently). 2 Score was out of 20. 3 Score was out of 60. 4
Score was between -100 and 100.
Materials
Demographics & Medical Knowledge Survey. Participants took a demographic survey asking for basic information, such as gender, age, and education level. They were asked about possible exposure to cognitive aid systems or ventilator devices. They were asked about their exposure to medical equipment and procedures. The forms took approximately five minutes to complete. See appendix A.
accomplish the goals of the task), Performance (how successful the user felt at accomplishing the goals), and Frustration (how insecure, discouraged, or stressed the user felt during the task). Participants reported their workload on each construct with a scale from 1 to 21, then weight them from 1 to 6 depending how important they felt that construct was for the task (NASA, 1986). The NASA-TLX can be used repeatedly throughout a task. Workload was comparable both within and between participants. During a validity study (Hart & Staveland, 1988), within-participant weightings did not change significantly throughout the same task, indicating no need for reacquiring the weightings. See appendix A.
Exit Interview. Participants took an exit interview after the experiment. Questions included participant opinions on the aid and subjective functionality of the aid. The exit interview also included open-ended questions where participants may comment about their overall interaction with the aid and task. See appendix A.
Cognitive Measures.
ANT (reaction time, orienting, alerting, and executive attention). The Attentional
Network Test is a measure of three separate forms of attention: Orienting, Alerting, and Executive (Fan et al., 2002). The test takes approximately twenty minutes to complete.
Participants were seated at a computer in the lab where they read through the instructions. They used the keyboard to respond to targets that were displayed on the screen in three different sections that tested each of the three forms of attention. They were chances to take breaks between sections. Participants were scored on their speed and accuracy in responding to targets that were displayed on the screen. See appendix A.
Paper folding (spatial visualization). The Paper Folding Test is a measure of visual
folded and then having a hole punched into it. Participants were required to mentally restructure the figure and then choose which image represented the unfolded paper when holes had been punched through it. This required the participant to perform serial spatial operations. Participants had 3 minutes to complete 10 items. Blank items counted as incorrect and answers left blank due to running out of time also counted as incorrect. Score was calculated by number correct over total number possible. See appendix A.
Shipley’s (crystallized intelligence). The Shipley’s Institute of Living Scale is a measure
of crystallized intelligence. Participants were given three minutes to find the correct synonym for 40 different items. Score was based on number of questions answered correctly. Blank answers were counted as incorrect. Score was calculated by number correct over total number possible (Mason et al., 1991, Watson & Plemel, 1992, Matthews et al., 2001). See appendix A.
Experimental Tasks.
Medical Ventilator Simulator Task. A ventilator is a device used to administer oxygen to
a patient that cannot breathe on their own. A simulated ventilator allowed participants to perform the task of setting up the ventilator. It was based off the Maquet Ventilator System SERVO-i V3.0 (Servo-i v3.0 User’s Manual).
program was designed and data collected using the wireframing program Axure. See Figure 3 for more information.
A task analysis was performed to break down parts of the ventilator procedure and examine which resources the task demanded and at what time the task demanded those resources. For example, some sections of the procedure were mostly visual and spatial, while others were mostly visual and verbal. From the task analysis, certain aspects of the task were re-designed to create or avoid conflict, such as converting a section to audio. See appendix B for more details.
Figure 3. Left panel shows the full setup of the simulator, with supply cabinet, patient circuit stand, simulated ventilator, wall ports, and oxygen tank. Right panel shows close-up of simulator
interface.
failed checks. In the auditory version, a computerized voice relayed the same information to the user, repeating phrases such as “running” where visually the words would be displayed for a duration of time.
Some parts of the ventilator setup would fail depending on how the user operates the simulated ventilator. For instance, using a Wizard-of-Oz technique, the experimenter pressed a hidden button on the screen to correctly display the fail or passed indicator. In another section, the ventilator menu would no longer progress to prevent the participant from moving too far forward in the experiment accidentally. The experimenter clicked another secret button to allow the menu to continue functioning normally.
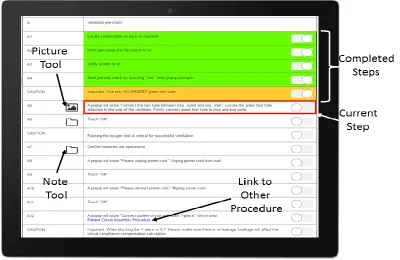
Cognitive Aid. The cognitive aid was created using Axure prototyping software. The
visual aid had a list of steps that the user can interact with through a touch-screen device. The aid display resembled a PDF with additional features (see Figure 4). These features included timers and clocks, highlighting, notes, and the ability to take and upload photos. These features were designed to assist the user during tasks that are particularly complex or where they needed assistance.
On the left-hand side of the screen were several tools which assisted the user in completing the task. There were three tools used within the experiment: Notes, Pictures, and Timers. Notes displayed information added by other users, simulating writing notes in the
margins of actual checklists. These notes were always verbal information. Information contained within the notes were decided by observing where pilot testers were most often unable to
complete the step, and veterinary experts who indicated where certain steps would not be performed as written in the manual. In auditory modes, notes were read aloud when activated. Pictures displayed images of parts or connected components, acting as a diagram, and were always presented visually. Timers brought up a stopwatch user interface. Participants could start, pause, and reset the timer. The timer counted by single seconds. All visual tools displayed on the bottom-right hand screen and followed user scrolling.
Design and Procedure
Design. The experiment broke down into the section and step level. The task included three sections: Pre-Use Check, Patient Circuit Assembly, and Patient Setup. The experiment was also broken down on a step-by-step level, where there were multiple steps per section.
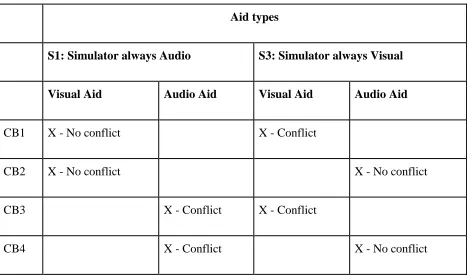
Section Level. The three sections were displayed in the same modality for all
participants. In the simulator, the S1: Pre-Use Check was always displayed aurally and S3: Patient Setup was always displayed visually. Only the modality of the aid paired with each section changed. S2: Simulator Patient Circuit Assembly was not manipulated in the design and was always displayed visually with a visual version of the cognitive aid.
Table 2. Experiment design and counterbalance groups
Aid types
S1: Simulator always Audio S3: Simulator always Visual
Visual Aid Audio Aid Visual Aid Audio Aid
CB1 X - No conflict X - Conflict
CB2 X - No conflict X - No conflict
CB3 X - Conflict X - Conflict
CB4 X - Conflict X - No conflict
Step Level. Each section of the simulator procedure and aid was broken down into
multiple steps. The independent variable of Interruption (present, absent) were included at the step level. At three points during the task, participants were interrupted to perform other surveys or tests. Dependent variables included completion time per step, number of errors, and
resumption after interruption.
consistency. They were then situated with the mock ventilator system and given preliminary instruction. The researcher(s) then watched the participant and initiated any Wizard-of-Oz methods required in that given condition. Participants, during the experiment, were interrupted at three different time points (consistent between participants) and told to pretend a nurse needed them to fill out paperwork. They were escorted to a computer and completed one of the ability tests before returning to the experiment. The first interruption was the Medical Knowledge Survey. The second interruption was the Shipley’s. The third interruption was the Paper Folding Test. The NASA-TLX was administered at the end of each interruption and at the completion of the experiment. Participants then completed an exit interview and the ANT and were debriefed. Analysis
Participants’ errors were calculated by combining all errors (skips or performing
incorrect actions) within each of the three sections. Participant’s initial and final response to each part were recorded, so an initial response may differ from a final response so that a participant may initially perform a step correct but go back and perform it incorrectly or vice versa. User’s total initial and final errors per section became two separate variables. Finally, the total time in seconds was recorded for each section. Analysis will focus on the 1st and 3rd sections of the experiment only, as the 2nd section was not manipulated for task-aid modal interaction. See tables 2 and 3 for additional information.
Table 3. Descriptive statistics for the Auditory Task
Visual Aid Auditory Aid
M SD M SD
Total Time 19.10 (Minutes) 6.85 23.00 (Minutes) 7.23
Initial Errors 5.07 2.78 4.70 3.00
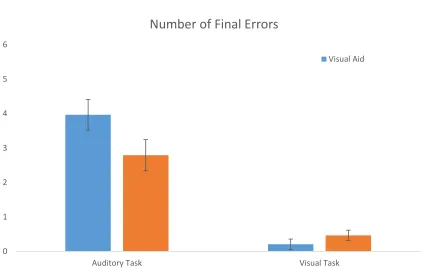
Final Errors 3.97 2.40 3.03 2.76
Table 4. Descriptive statistics for the Visual Task
Visual Aid Auditory Aid
M SD M SD
Total Time 5.93 (Minutes) 2.98 7.17 (Minutes) 2.36
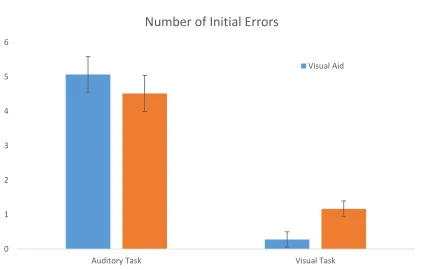
Initial Errors 0.43 1.19 1.17 1.56
Final Errors 0.37 1.16 0.47 0.86
MANOVA. A between-subjects MANOVA was run on the Pre-Use (auditory task) section data. IVs were modality (2:Visual, Auditory). DVs were Time, Initial Errors, and Final Errors. We found a significant difference between performance scores based on modal conflict (Wilk’s Lambda = .840, F (3,53) = 3.367, p < .05). Therefore, further analysis was conducted.
There was a significant effect of modality on time (F (1,55) = 6.679, p < .05).
Figure 5. Total time (in seconds) to complete the task by aid type and section. Bars represent standard error.
Figure 6. Total number of initial errors by aid type and section. Bars represent standard error.
0 200 400 600 800 1000 1200 1400 1600
Auditory Task Visual Task
Total Time per Section (in seconds)
Visual Aid
0 1 2 3 4 5 6
Auditory Task Visual Task
Number of Initial Errors
Figure 7. Total number of final errors by aid type and section. Bars represent standard error.
A between-subjects MANOVA was run on the Setup (visual task) section data. IVs were modality (2:Visual, Auditory). DVs were Time, Initial Errors, and Final Errors. We found a significant difference between performance scores based on modality (Wilk’s Lambda = .796, F (3,54) = 4.620, p < .01). Therefore, further analysis was conducted.
There was a significant effect of modality on time (F (1,56) = 5.402, p < .05).
Participants in the conflict setup condition performed faster than participants in the non-conflict setup condition. There was also a significant effect of modality on initial errors (F (1,56) = 9.574, p < .01). Participants made fewer final errors in the setup conflict condition than the setup nonconflict condition. However, participants did not differ in amount of initial errors based on condition (F (1,56) = 2.323, p = .133).
0 1 2 3 4 5 6
Auditory Task Visual Task
Number of Final Errors
ANCOVA. A series of Pearson’s correlations were run to understand the relationship between ability test scores and performance variables. The Pre-Use Time correlated negatively with the Shipley’s (r(57) = -.365, p <.01), indicating higher crystallized intelligence was
associated with faster performance in the Pre-Use section. The Setup Time correlated negatively with Paper Folding (r(58) = -.272, p<.05), Shipley’s (r(57) = -.339, p < .01), and the ANT Alerting Effect (r(57) = -.467, p < .01). This indicated that higher spatial ability, crystallized intelligence, and attentional control was associated with faster completion time in the Setup section. All other performance variables were not found to be correlated with other ability scores.
A between-subjects ANCOVA was run on the Pre-Use section (1st section, auditory task). IV’s were aid modality (2:Visual, Auditory). The DV was Pre-Use completion time. The
covariate used was Shipley’s (crystallized intelligence). We found a significant difference in completion times based on modal conflict when accounting for crystallized intelligence (F (1, 54) = 5.708, p < .05). This result reflects the previous MANOVA, so it can be concluded the crystallized intelligence did not impact completion time in the Pre-Use section.
A between-subjects ANCOVA was run on the Setup section (3rd section, visual task). IV’s were aid modality (2:Visual, Auditory). The DV was Setup completion time. The covariates included Paper Folding (spatial ability), Shipley’s (crystallized intelligence), and ANT
(attentional ability). We found a significant difference in completion time based on modal conflict when accounting for these individual differences (F (1, 52) = 8.402, p < .01). These results reflected the previous MANOVA, so it can be concluded that these individual differences did not impact completion time in the setup section.
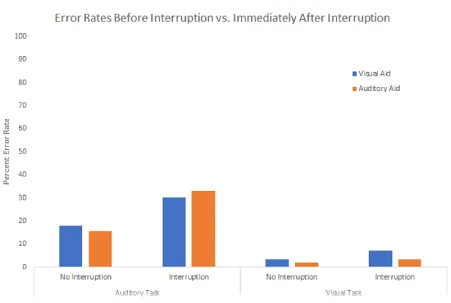
following the interruption. This allows for comparison of the rate at which participants made errors prior to and immediately after interruption. Participants in the Pre-Use section made an average error rate of 14.17% prior to being interrupted (SD = 11.1%). The error rate of the step after an interruption during the Pre-Use section was 31.6%. During the Setup section, the average error rate was 2.59% (SD = 8.0%) prior to being interrupted, and a 5% error rate
immediately after being interrupted. This indicates that error rates doubled on steps following an interruption.
The number of errors differed by section, therefore interruption error rates were
examined by sections (Section 1: Auditory, Section 2: Visual). When examining error rates by aid modality, participants in the auditory section with a visual aid made an average error rate of 15.56% prior to being interrupted (SD = 9.8%), and a 33% error rate after interruption (SD = 0.5%). Participants in the auditory section with an auditory aid had a 18% prior to being
Figure 8. Error rates before interruption vs. immediately after an interruption by aid type and section.
Experiment 2 Summary. Regardless of the task modality, a visual aid out-performed an auditory aid. There are some possible explanations for the visual aid superiority. First, human reading speed tends to be faster than speech, and allows for scanning (Just & Carpenter, 1987, Williams, 1998). Auditory information may have been inappropriate for the dense technical and complex procedure of setting up a ventilator. Furthermore, using the auditory aid still required some visual components, such as looking at pictures and steps being highlighted when
completed.
task section. Additionally, the auditory task was divided by another section that was not auditory. The visual task was much shorter, in both numbers of steps and time it took to complete. Error rates on this section were much lower, and a majority of this section involved a digital interface as opposed the auditory section which had a blend of physical components and an interface. The two sections may not be directly comparable as a result, although their individual qualities may also help explain results. For instance, the varied nature of the auditory section may be why modality did not affect final error rates as opposed to the visual section. It was easier for participants to make an error in the visual section and continue, whereas the auditory section sometimes made it obvious an error occurred by preventing users from continuing until they pressed a button or correctly assembled a piece, such as powering the machine on.
Although individual difference measures did correlate with some performance scores, including these individual difference measures into the model did not change the overall findings. This may show that, while participants’ performance did vary based on individual attributes, the manipulations were more prevalent to user performance. This may be due to the participants all possessing high levels of education and being around the same age group. Further studies could analyze different populations, such as older adults, and comparing their
performance to younger adults. Other possibilities may include comparing individuals of different educational backgrounds.
generally felt the tools were easy to use, and found them to be useful (See Table 5). To better understand tool usage by section and condition, further tool usage statistics were recorded in Experiment 2.
Table 5. Participant self-report on feelings towards tools
M SD
How often did you use tools? 4.57 .673
How inclined were you to use tools? 4.45 .769
Did you find the tools easy to use? 6.17 .994
Did you find the tools useful? 6.13 1.033
Note. The first two questions were asked on a 5-point likert scale with ratings that ranged from 1 (Never) to 5
(Always). These last two questions were asked on a 7-point likert scale with ratings that ranged from 1 (Strongly
Disagree) to 7 (Strongly Agree).
Experiment 2 - Input Design & Aid Interaction
METHOD
Participants
Twenty participants ages 18-35 were recruited from a pool of veterinary students. This group was chosen because they were substantially educated and motivated and had no or limited experience with the task. Participants were recruited through e-mail and sign-up sheets presented during classes. Participants were compensated $30 for participating in the experiment.
Table 6. Demographics and Experience Data for Experiment 2
M SD
Males/Females 3 Males/17 Females
Age 25.97 3.888
Years in Veterinary Care 2.85 2.783
Knowledge of Ventilator Procedures 1 3.71 .920
Procedural Checklist Usage 1 3.06 .899
Non-procedural Checklist Usage 1 2.24 .831
Paper Folding 2 13.25 4.05
Shipley’s 3 32.00 4.32
Raven’s 4 7.45 2.56
Note. 1 was on a 5 point Likert scale (1 = Never, 5 = Frequently). 2 Score was out of a maximum of 20. 3 Score was
out of a maximum of 60. 4 Score was out of a maximum of 12.
Materials
All materials during Experiment 1 were present during the second experiment except for the ANT, which was replaced with the Raven’s Progressive Matrices (Raven, 2000). An
additional tutorial section was also added to explain the voice-activated cognitive aid.
Raven’s Advanced Progressive Matrices. The Raven’s Advanced Progressive Matrices is
a measure of perceptual reasoning. Participants were asked to complete twelve questions within fifteen minutes. These questions increase in difficulty over time. The questions involve
Voice-Activated Cognitive Aid. A Wizard-of-Oz method was employed to use the aid in a
voice activated scenario. Users said commands and the ‘wizard’ manipulated the aid remotely to perform the user’s commands. For instance, the user may say “next” which would label the current step complete and move on to the next step. Commands were taught to the user prior to starting to use the aid during a 5 to 10 minute tutorial where they were asked to practice every possible command. Voice commands were intended to be flexible and intuitive; if a user said “done” or “complete” instead of “next,” the ‘wizard’ would still perform the appropriate
command. If a user used an unacceptable command, the ‘wizard’ would not perform any action to simulate how the final product should function. A list of accepted voice activated commands and their functions can be found in Appendix C.
Design and Procedure
Design. The design was mixed model. There were two independent variables: Aid Modality (Between subject, Two Levels: Visual, Auditory), and Input Type (Between subject, Two Levels: Manual, Vocal). The participants received a cognitive aid that displayed sensory information visually or aurally, the same as Experiment 1. Finally, the cognitive aid could be interfaced physically through manual interaction or through voice commands. Dependent variables were total completion time, completion time per step, number of errors (initial, final, and number of changes), number of tools used, and subjective workload.
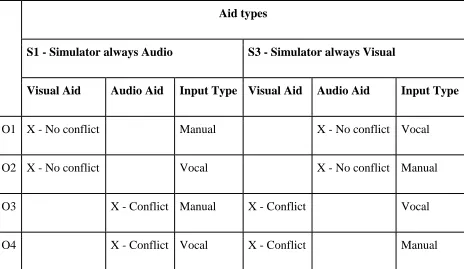
first and manual second. The second section (S2: Patient Circuit Setup) of the experiment has manual input for all participants (Table 7).
Table 7. Combinations for input-task/aid interactions
Aid types
S1 - Simulator always Audio S3 - Simulator always Visual
Visual Aid Audio Aid Input Type Visual Aid Audio Aid Input Type
O1 X - No conflict Manual X - No conflict Vocal
O2 X - No conflict Vocal X - No conflict Manual
O3 X - Conflict Manual X - Conflict Vocal
O4 X - Conflict Vocal X - Conflict Manual
were interrupted three times total, always between sections (as opposed to within sections such as during Experiment 1) and told to pretend a nurse needed them to fill out paperwork. They were escorted to a computer and completed one of the ability tests before returning to the experiment. The first interruption was the Medical Knowledge Survey. The second interruption was the Shipley’s. The third interruption was the Paper Folding Test. The NASA-TLX was administered at the end of each interruption and at the completion of the experiment. Participants then completed an exit interview and the ANT and were debriefed.
Analysis
Participants’ error scores were calculated in the same way to Experiment 1; errors were calculated by combining all errors (skips or performing incorrect actions) within each of the three sections. Participant’s initial and final response to each part were recorded, so an initial response may differ from a final response so that a participant may initially perform a step correctly but go back and perform it incorrectly or vice versa. User’s total initial and final errors per section became two separate variables. The total amount of changes that occurred were also recorded, so it was recorded if a participant changed their responses frequently. Finally, the total time in seconds was recorded for each section. Error analysis will focus on the 1st and 3rd
sections of the experiment only, as the 2nd section was not manipulated for task-aid modal interaction. See tables 8 and 9 for additional information.
Pre-Use Time, Setup Initial Errors, Setup Final Errors, and Setup Time were all found to be skewed. A log10 transformation corrected for this skewness and normalized the data. All data reported for the aforementioned variables are post transformation. Graphs and charts are
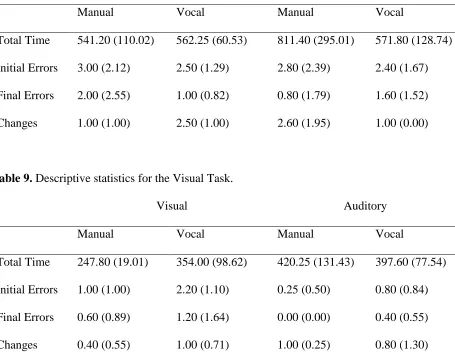
Table 8. Descriptive statistics for the Auditory Task.
Visual Auditory
Manual Vocal Manual Vocal
Total Time 541.20 (110.02) 562.25 (60.53) 811.40 (295.01) 571.80 (128.74) Initial Errors 3.00 (2.12) 2.50 (1.29) 2.80 (2.39) 2.40 (1.67) Final Errors 2.00 (2.55) 1.00 (0.82) 0.80 (1.79) 1.60 (1.52) Changes 1.00 (1.00) 2.50 (1.00) 2.60 (1.95) 1.00 (0.00)
Table 9. Descriptive statistics for the Visual Task.
Visual Auditory
Manual Vocal Manual Vocal
Total Time 247.80 (19.01) 354.00 (98.62) 420.25 (131.43) 397.60 (77.54) Initial Errors 1.00 (1.00) 2.20 (1.10) 0.25 (0.50) 0.80 (0.84) Final Errors 0.60 (0.89) 1.20 (1.64) 0.00 (0.00) 0.40 (0.55) Changes 0.40 (0.55) 1.00 (0.71) 1.00 (0.25) 0.80 (1.30)
Pre-Use MANOVA. 2x2 between-subjects MANOVA was run on the Pre-Use (auditory task) section data. IVs were modality (2:Visual, Auditory) and input type (2:Manual, Aural). DVs were Time, Initial Errors, Final Errors, and Number of Changed Responses. We found a significant difference between performance scores based on aid modality (Wilk’s Lambda = .306, F (5,11) = 4.993, p < .05). Therefore, further analysis was conducted.
input type on number of changes (F (1,15) = 9.264, p < .01). Participants made fewer changes when the aid was the same modality as the input type than when the aid did not share the same modality as the input type. There was no significant effect of modality on initial errors (F (1,15) = .065, p = .802), final errors (F (1,15) = .204, p = .658), or number of changes (F (1,15) = .058, p = .814). There was no significant effect of input type on initial errors (F (1,15) = .108, p = .747), final errors (F (1,15) = .245, p = .627), number of changes (F (1,15) = .145, p = .709), or time (F (1,15) = .534, p = .709). There was no significant interaction effect between modality and input type on initial errors (F (1,15) = .001, p = .979), final errors (F (1,15) = 1.160, p = .298), or time (F (1,15) = 1.473, p = .244).
Setup MANOVA. A 2x2 between-subjects MANOVA was run on the Setup (visual task) section data. IVs were modality (2:Visual, Auditory) and input type (2:Manual, Aural). DVs were Time, Initial Errors, Final Errors, and Number of Changed Responses. We found a significant difference between performance scores based on aid modality (Wilk’s Lambda = .379, F (5,11) = 4.922, p < .05). Therefore, further analysis was conducted.
There was a significant effect of modality on time (F (1,15) = 7.088, p < .05). Participants who received a visual aid completed the task faster than those who received an auditory aid. There was a significant effect of modality on initial errors (F (1,15) = 6.337, p < .05). Participants who received a visual aid made fewer errors than those who received an auditory aid. There was no significant effect of modality on final errors (F (1,15) = 2.417, p = .141) or changes made (F (1,15) = .596, p = .452).
initial errors was found to be marginally significant (F (1,15) = 4.495, p = .051), which may mean that manual aid users made fewer initial errors than vocal aid users.
There was no significant interaction between modality and input type on time (F (1,15) = 2.521, p = .133), initial errors, (F (1,15) = .285, p = .601), final errors, (F (1,15) = .007, p = .935), or number of changes (F (1,15) = .076, p = .786). See Figures 9-12 for additional information.
Figure 9. Time taken to complete the task (in seconds). Bars represent standard error.
0 100 200 300 400 500 600 700 800 900 1000
Manual Vocal Manual Vocal
Visual Aid Auditory Aid
Tim e in Se con d s
Time Taken (Aid Modality * Input Type)
Figure 10. Number of initial errors made. Bars represent standard error.
Figure 11. Number of final errors made. Bars represent standard error.
0 0.5 1 1.5 2 2.5 3 3.5 4 4.5
Manual Vocal Manual Vocal
Visual Aid Auditory Aid
N u m b er o f E rro rs
Initial Errors (Aid Modality * Input Type)
Auditory Task Visual Task 0 0.5 1 1.5 2 2.5 3 3.5 4 4.5
Manual Vocal Manual Vocal
Visual Aid Auditory Aid
N u m b er o f E rro rs
Final Errors (Aid Modality * Input Type)
Figure 12. Number of changes made. Bars represent standard error.
Individual difference scores (crystallized intelligence, spatial reasoning, and fluid intelligence) were not found to correlate with any of the DVs and thus an ANCOVA was not performed. This may be due to the lower sample size in comparison to Experiment 1.
Subjective Workload. Workload scores were averaged for each section. An ANOVA revealed that participants did not differ in workload during the Pre-Use section for aid modality (F (1,15) = .103, p = .752), input type (F (1, 15) = .120, p = .734), and there was no significant interaction between aid modality and input type (F (1,15) = .387, p = .543). Another ANOVA revealed participants did not differ in workload during the Setup section for aid modality (F (1,15) = .295, p = .595), input type (F (1,15) = .052, p = .823), and there was no significant interaction between aid modality and input type (F (1,15) = .045, p = .835) (see Figure 13).
0 0.5 1 1.5 2 2.5 3 3.5
Manual Vocal Manual Vocal
Visual Aid Auditory Aid
N u m b er o f Ch an ge s
Number of Changes (Aid Modality * Input Type)
Figure 13. Subjective workload for users. Bars represent standard error.
Tool Use. Tool usage was available for each section, and could now be analyzed by condition. On average, participants used 14.11 (SD = 4.68) tools in the Pre-Use (Auditory) section, and 8.00 (SD = 2.69) tools in the Setup (Visual) section.
Participants that received the visual aid tended to access fewer notes in both the auditory section (M = 12.78, SD = 3.53), and visual section (M = 7.10, SD = 2.60) than participants that received the auditory aid in the auditory section (M = 15.30, SD = 5.42), and visual section (M = 9.00, SD = 2.55) (Figures 14 and 15). When we compared input types, participants in the
auditory section tended to use notes more often in the manual condition (M = 15.70, SD = 5.23) than participants in the vocal condition (M = 12.33, SD = 3.43). Participants in the visual section did not differ when they received the manual aid (M = 7.78, SD = 2.33) or vocal aid (M = 8.2, SD = 3.08). 0 1 2 3 4 5 6 7 8 9 10
Manual Vocal Manual Vocal
Visual Aid Auditory Aid
Wo rk loa d Sco re
Subjective Workload Ratings
Figure 14. Average tool usage by modality. Bars represent standard error.
Figure 15. Average tool usage by input type. Bars represent standard error.
Similar to Experiment 1, participants found notes helpful, indicating in an exit survey that they were generally inclined to use notes and used them often. The same exit survey found that participants generally felt the tools were easy to use, and found them useful. See Table 10.
0 2 4 6 8 10 12 14 16 18
Auditory Task Visual Task
N u m b er o f Too l U sages
Average Tool Usage by Modality
Visual Aid Auditory Aid 0 2 4 6 8 10 12 14 16 18 20
Auditory Task Visual Task
N u m b er o f To o l U sages
Average Tool Usage by Input Type
Table 10. Participant self-report on feelings towards tools
M SD
How often did you use tools? 4.74 .452
How inclined were you to use tools? 4.68 .478
Did you find the tools easy to use? 5.74 1.447
Did you find the tools useful? 6.11 1.487
Note. The first two questions were asked on a 5-point likert scale with ratings that ranged from 1 (Never) to 5
(Always). These last two questions were asked on a 7-point likert scale with ratings that ranged from 1 (Strongly
Disagree) to 7 (Strongly Agree).
Interim Summary. The results of Experiment 2 mirrored Experiment 1 in many ways. Like Experiment 1, participants tended to be quicker with visual aids. Again, this may have been due to the type of information conveyed rather than conflicting modalities. Dense technical information, such as the steps in this procedure, may be best presented in a visual format in most situations.
Manual and vocal input types performed equally. Although we did not use an authentic voice recognition system, the Wizard-of-Oz method ensured that the ‘voice recognition’ was accurate and flexible, which removed any possibility of the voice recognition software being at fault for poor performance. Although more testing would be needed, it indicated that reliance on voice recognition to a cognitive aid does not hinder performance in ideal conditions. Additional considerations may include environmental noise that may interfere with voice recognition, and if multiple people are interacting with the aid simultaneously. However, voice activated aids ultimately free the user’s hands, which may speed up tasks that stress manual dexterity.
aid types were less likely to change their response. However, as other performance measures (error rates and time taken) did not differ when accounting for this interaction, the benefit of this interaction may be minimal. One possibility is that, when an error occurred, participants in the matched conditions made fewer overall changes to arrive at their final action, while people in the mismatched conditions may have changed their action multiple times before arriving at their final action. This may have only appeared in the auditory section due to the longer and more complex nature of this section compared to the visual section, which was shorter, contained fewer notes, and allowed for fewer errors to be made.
Visual aid users tended to use tools less frequently than auditory aid users, although this was likely because participants had to replay audio files multiple times to ‘re-read’ the
information, while visual users only needed to keep the note open to read and re-read at their leisure. This suggests audio notes may not function as efficiently as visual notes, having to be replayed multiple times and proving more effortful than a visual counterpart to gain the same information. Audio notes might be best reserved for unique cases where visual information cannot relay information as quickly, such as showing a user different types of alarms or audible signals a device may produce.
DISCUSSION
Several examples of hybrid cognitive aids exist or are in development, some containing similar features to the ones contained in this hybrid aid, such as additional user information, marking off steps as completed, and inserted pictures. These examples include the International Procedure Viewer (IPV) and the Mobile Procedure Viewer (MOBIPV) (“Skytek’s International Procedure Viewer,” n.d., Boyd et al., 2016). However, many of these designs do not follow basic human factors principles, such as proximity and grouping of integrated information, or allow use of limited modalities and media. Our research examines the interaction between the aid and the task, usability and design of the aid, and users’ adherence to tool usage.
Multiple Resource Theory. In dual tasks, having too much cognitive overlap can lead to
performance degradation in both tasks (Navon & Gopher, 1979). Understanding the cognitive demands the task put on the user is the first step to creating a better interaction between the two tasks. As one intent of a cognitive aid is to lessen the demand on the user, understanding how the aid and task interact can help guide future cognitive aid designs to ensure the least impact on user workload, which would then lead to better performance.
These experiments suggest that, despite the task being complex, it was more important to present information in a format that best conveys that information. Visual information for
complex, dense, technical information provided the best performance in this experiment, regardless of the modality of the task itself. While adding time pressure is another possibility to examining task-aid interaction, ultimately the type of information being conveyed to a user should be considered foremost.
expected (Pashler, 1994, Wickens, 2002, Lu, et al., 2013). This may be due to the nature of the cognitive aid as a task supplement rather than its own unique task. The two tasks are typically unrelated in most dual-task literature, such as rock climbing while memorizing lists of words (Woodham et al., 2016), or driving while talking on the phone (Strayer & Johnston, 2001), whereas the cognitive aid reinforced and augmented the task.
These costs may also be mitigated by the cognitive aid’s relative simplicity compared to a complex task such as the one the simulator offered. Patel, Lamar, and Bhatt (2013) found that participants walking at two different speeds while completing an array of cognitive tests tended to favor the more complex task. Our cognitive aid was designed with the intent of being easy to use, which may have allowed participants to focus on the simulator, which would largely decrease costs associated with dual-tasks.
It should also be noted that auditory information may also carry further concerns, especially in a busy medical setting. This experiment was conducted in a quiet room free from others talking and noise pollution. Certain settings may inherently be rife with loud noises such as the beeping of a machine unrelated to the task, or other people talking. This may increase the difficulty of using an auditory aid substantially.
Input Types. Input types (manual or vocal) also did not differ in amount of errors or time
taken. While it is recommended to test the system with a voice recognition software, it is
possible that both manual and vocal inputs are equally efficient in aid interaction. One benefit in using voice-activated commands includes users having their hands free to manipulate non-aid devices. The ventilator task may not have provided enough opportunities where both of a
is recommended, allowing for vocal commands is a viable option where other characteristics of the task and environment permit.
Input types did interact with modality in regards to amount of changes made. When the input modality and aid modality were the same, changes occurred the least frequently. These results differed from what is predicted by multiple resource theory (Wickens, 1987), which predicted that the same input and aid modality would lead to decreased performance. However, as errors did not differ between groups in Experiment 2, the amount of changes may not be an indicator of performance.
Interruptions. Interruptions were shown to double error rates on steps immediately after
the interruption. This was not affected by modality. This fits with interruption literature: interruption tend to increase error rates, and recovery can be difficult and add extra workload onto the user, which the tools were meant to lessen and enhance interruption recovery (Foroughi et al, 2014). Our study specifically examined how modal interaction could affect interruption recovery, but future research can examine how the hybrid cognitive aid reduces error rate compared to a non-hybrid aid or no aid at all.
Added Features. Tools were almost always used by participants. Overall, participants
participants could not add notes of their own, nor did they interact with tools generated by other users.
Another concept to examine is tool adherence. Sometimes participants willfully
disregarded tools that they read or listened to, and other times they never activated a given tool. A qualitative approach may be required to ascertain why participants disregarded certain tools. Some qualitative information was gathered at the end of the experiment by the researcher, but a systematic approach would be necessary to better understand why this occurs. Possibilities include distrust when a tool contradicts instruction, and the participant believing they do not need the information in the tool to complete the step. The latter may occur especially when the step looks deceptively simple.
Intellectual Merit and Broader Impacts. There are several unique contributions that would come from this research. Firstly, the examination of how modalities interact between task and aid. From that, we also gain a better understanding of how auditory tasks interact with checklists. In additional, aural aids are not well studied, typically only existing in the form of another person reading out the checklist or procedure. This experiment also remedies the gap in the literature and allows us to examine the effectiveness of an aural aid.