Swarm Based Features Selection for Text Summarization
Mohammed Salem Binwahlan1, Naomie Salim2, and Ladda Suanmali3
1,2
Faculty of Computer Science and Information Systems, University Teknologi Malaysia, 81300 Skudai, Johor, malaysia
3
Faculty of Science and Technology, Suan Dusit Rajabhat University 295 Rajasrima Rd, Dusit, Bangkok, Thailand 10300
Summary
The features are the main entries in text summarization. Treating all features equally causes poor summary generation. In this paper, we investigate the effect of the feature structure on the features selection using particle swarm optimization. The particle swarm optimization is trained using DUC 2002 data to learn the weight of each feature. The features used are different in terms of the structure, where some features were formed as combination of more than one feature while others as simple or individual feature. Therefore the determining of the effectiveness of each type of features could lead to mechanism to differentiate between the features having high importance and those having low importance. We assume that the combined features have higher priority of getting selection more than the simple features. In each iteration, the particle swarm optimization selects some features, then corresponding weights of those features are used to score the sentences and the top ranking sentences are selected as summary. The selected features of each best summary are used in calculation of the final features weights. The experimental results shown that the simple features are less effective than the combined features. Key words:
Fitness function, Feature selection, Particle swarm optimization, Sentence score
1.
Introduction
The features are the cornerstone in the generation process of the text summary. The summary quality is sensitive for those features in terms of how the sentences are scored based on the used features. Therefore the determination of the effectiveness of each feature could lead to mechanism to differentiate between the features having high importance and those having low importance. The work on the feature selection is not new, many approaches were proposed for such problem in different fields. For example, in classification problem the feature selection is used to reduce the dimensionality of data which leads to improve the accuracy of the classification. Tu et al. [1] used particle swarm optimization (PSO) for feature selection in the classification problem where support vector machines with one-versus-rest method were used as fitness function. Liu et al. [2] used particle
swarm optimization to select subset of features for classification and training of neural network. Lin et al. [3] employed PSO with support vector machine for parameter determination and features selection for improving the classification accuracy. Lee et al. [4] adapted PSO for feature selection to enhance the performance of support vector machines and neural networks to classify the power transformer faults. Liangtu and Xiaoming [5] used PSO for extracting the web text features and select the important ones. In all the works above, the target is to include the high important features and exclude the features with low importance. Our work is different from those works where our final target is to get weight for each feature based on its selection score and use these weights for weighting the same features for any new data.
In this paper, we employ the particle swarm optimization as machine learning for feature selection to investigate whether the feature structure plays a role in the feature selection process. We assume that the combined features have higher priority of getting selection more than the simple features.
The rest of this paper is organized as follows: Section 2 describes the particle swarm optimization (PSO). Section 3 presents the features. Section 4 describes the PSO encoding. Section 5 discusses the evaluation function. Section 6 introduces the training procedure. Section 7 draws the experimental results. Section 8 gives conclusion.
2.
Particle Swarm Optimization (PSO)
Particle swarm optimization was introduced by Kennedy and Eberhart [7] as a stochastic, population-based evolutionary algorithm for problem solving. The key idea of PSO method is to simulate the shared behavior happening among the birds flocks or fish school.
PSO depends on its methodology, a population of individuals to discover favorable regions of the search space. Every member in the population is called particle and the group of all particles is called a swarm. Each particle flies in the search space with a velocity that is dynamically adjusted according to its own flying experience and its companions' flying experience and retains the best position it ever encountered in memory. The best position ever encountered by all particles of the swarm is also announced to all particles. The work of PSO starts by initially randomizing a group of solutions (particles), the swarm will update its best value every cycle based on the Eq. (1) and Eq. (2) and then after several iterations finds the optimized solution. Fig.1 summarizes the work mechanism of PSO.
( 1) * ( ) ( ( ) ( )) ( ( ) ( )) (1)
1 1 2 2
V t w V t c r p t x t c r p t x t id + ← id + id − id + gd − id
Where Vid( )t is the velocity of the particle i in the time point t in the search space along the dimension d.
( )
id
p t is the best position in which the particle previously got high fitness value, it is called pbest, xid( )t is the current position of the particle i in the search space, r1
and r2 are random generated numbers in the range [0,1], ( )
gd
p t is the overall best position in which a particle got best fitness value, it is called the gbest, c1and c2are acceleration parameters and W is inertia weight, its value is decreased linearly over the time from 0.9 to 0.4 [8].
( 1) ( ) ( 1) (2)
x t x t V t
id + ← id + id +
( 1)
id
x t+ is the new position which the particle must move to, where xid( )t is the current position of the particle and (Vid t+1)is the new velocity of the particle resulting in the calculation in Eq. (1) which mainly determines the new position of the particle. The velocity of the particle must be in the range [Vmax, Vmin].
There are two types of PSO: continuous particle swarm optimization which is to optimize continuous nonlinear problems [7], and binary particle swarm optimization [9] which is extension of continuous PSO, in which the particle position is represented as bit string rather than real numbers; the update of the position in continuous PSO is done directly by adding the velocity to the previous position but in binary PSO, the velocity is used only in the sigmoid function as in Eq. (3) to calculate the probability
of the bit value to be changed to 1 or 0, where the value retrieved from the sigmoid function is compared with random generated value in the range between zero and one.
1
0 ( )
1 exp( ( ))
( 1) (3)
1 .
ij
ij ij
if p t
v t
x t
otherwise
⎧ ≥
⎪ + −
+ = ⎨ ⎪ ⎩
.
3.
The Features
The features used in this study are five features; two features were formed as combined features while the other three features are simple or individual features.
a. The combined features:
Sentence Centrality: the sentence centrality as in Eq. (4) consists of three features: the similarity Eq. (5), shared friends Eq. (6) and shared n-grams Eq. (7) between the sentence in hand and all other the document sentences, normalized by Fig.1 Flow Chart illustrating the PSO algorithm
Initialize population with random position (x) and velocity (v) vectors
For each particle
Evaluate Fitness
If fitness(x)>fitness(gbest) gbest=x
If fitness(x)>fitness(pbest) pbest=x
gbest = parameters of best solutions
Update:
n-1, n is the number of sentences in the document.
1 1 1
( , ) ( , ) ( , )
1 1 1
( ) | ( , ) (4)
1
n n n
simS S fr S S gr S S
i j i j i j
j j j
SCS i jandsimS S
i n i j θ
− − −
+ +
∑ ∑ ∑
= = =
= ≠ >=
−
2 log( ( ) 1) ( , ). ( , ).1
log( 1) ,
( , ) (5)
2 2
log( ( ) 1) log( ( ) 1)
( , ).1 ( , ).1
log( 1) log( 1)
sf wi tf w s tf w si i i j
n w s s
i i j sims s
i j
sf wi sf wi
tf w s tf w s
i i n i j n
w s w s
i i i j
+ ⎡ ⎤ − ∑ ⎢ ⎥ + ⎢ ⎥ ∈ ⎣ ⎦ = ⎛ ⎡ +⎤⎞ ⎛ ⎡ +⎤⎞ ⎜ − ⎟× ⎜ − ⎟ ∑ ⎜ ⎢ ⎥⎟ ∑ ⎜ ⎢ ⎥⎟ + + ⎢ ⎥ ⎢ ⎥ ⎜ ⎟ ⎜ ⎟ ∈ ⎝ ⎣ ⎦⎠ ∈ ⎝ ⎣ ⎦⎠ ( ) ( )
( , ) | (6)
| ( ) ( ) |
i j
i j
i j
s f riends s f riends
f r s s i j
s f riends s f riends
= I ≠
U
( ) ( )
( , ) | (7)
| ( ) ( ) |
i j
i j
i j
s n grams s n grams
gr s s i j
s n grams s n grams
− −
= ≠
− −
I U
Where Sj is a document sentence except Si , n is
the number of sentences in the document. θ is the similarity threshold which is determined empirically.
Title feature: this feature is formed as average of two features which are title-help sentence (THS) as in Eq. (8): the sentence containing n-gram terms of title and title-help sentence relevance sentence (THSRS) as in Eq. (9): the sentence containing n-gram terms of any title-help sentence.
( ) ( )
( ) (8)
| ( ) ( ) |
i i
i
s n grams T n grams THS s
s n grams T n grams
− −
=
− IU −
(9)
( ) ( ( ))
( )
| ( ) ( ( )) |
s n grams THS s n grams
j i
THSRS s
j s n grams THS s n grams
j i − − = − − I U
b. simple features:
Word sentence score (WSS): it is calculated as the following: j i ij t S i 1 2
WSS(S = 0.1+) | . j (10)
W
no of sentencescontainingt LS HTFS
∈
>=
∑
Where 0.1 is minimum score the sentence gets in the case its terms are not important, Wij as in Eq. (11) is the term weight (TF-ISF) of the term tij in the sentenceSi, LS is summary length and HTFS is highest term weights (TF-ISF) summation of a sentence in the document.
ij
log( ( ) 1)
( , ) 1 (11)
log( 1)
ij
ij i
ij
sf t
W tf t s
n
tf isf − +
+
⎡ ⎤
= × = ⎢ ⎥
⎣ ⎦
Key word feature: the top 10 words whose high TF-ISF score are chosen as key words.
The similarity to first sentence: This feature is to score the sentence based on its similarity to the first sentence in the document, where in news article, the first sentence in the article is very important.
4.
PSO Encoding
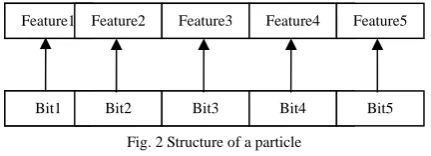
In this study, we use the binary PSO in which the particle position is represented as bit string. Each bit can take the value one or zero which represents the case of one feature. If the bit contains the value 1, it means the corresponding feature is selected, otherwise the corresponding feature is unselected. The first bit refers to the first feature, second bit refers to second feature and so on. The particle position can be represented as follows:
The velocity of the particle is represented in same way, where the value of each bit is retrieved from the sigmoid function.
5.
Evaluation Function
Evaluation function or the fitness function is the main component in the PSO architecture where it is responsible for calculating the value for each particle. The list of features contains the weights of those features for the current sentence. Each feature weight corresponds to one bit in the particle position, that bit may contain one or zero.
Feature1 Feature2 Feature3 Feature4 Feature5
Bit1 Bit2 Bit3 Bit4 Bit5
The score of the sentence is calculated by summing up the features weights corresponding to the bits containing ones and the features weights corresponding to the bits containing zeros are excluded from the scoring of the sentence. Based on the resulting scores for each sentence, the sentences are ranked in descending order. The top n of the sentences in the ranked list is selected as summary, where n is equal to the predefined compression rate which is 20% of the total number of sentences in the document. The evaluation of the generated summary will be the value of the current particle. Therefore the fitness function should be automatic text summarization metric. We use the ROUGE-1 [10] as fitness function.
}
{
}
{
( )
Re
(12)
( )
Re
count gram
match n
gram S
S ferencesummaries n
count gram n
gram S
S ferencesummaries n
∑ ∑
∈ ∈
∑ ∑
∈ ∈
Where n is the length of the n-gram and count
match is the most possible number of n-grams shared between a system generated summary and a set of reference summaries.
Based on the summary evaluation, the pbest of the particle is determined which means the evaluation value of the best summary generated by that particle and also the gbest is determined which is the evaluation value of the best summary created by a particle in the population so far.
6.
The Training Procedure
The data set we use for training PSO is Document Understanding Conference (DUC) [11] data collection, DUC 2002. The task 1 in DUC 2002 is to create a generic 100-word summary. Therefore we train PSO for creating that kind of summaries. In DUC 2002, each document has two 100-word human written summaries. We have selected the document sets D061j, D062j, D063j, D064j, D065j, D066j, D067f, D068f, D069f, D070f, D071f , D072f, D073b and D077b comprising 100 documents to be used as training data.
We have set the PSO variables as follows: number of particles is 5, Vmax=4, Vmin=-4, c1=2, c2=2, the value of w
is in the range [0.9, 0.4], the maximum number of iterations is 500 and the number of runs is 5.
In each iteration, each particle selects specific number of features. Based on the selected features, a summary for the current document is created and evaluated using the fitness function as in Eq. (12). By the end of each iteration, there will be five evaluation values. If the iteration is the first iteration, the evaluation value of each summary is selected as pbest for the corresponding particles and the best
evaluation value among those five evaluation values is selected as gbest. If the iteration number is 2 or above, the new pbest and gbest are selected by comparing the new evaluation values with the previous pbests. If any new evaluation value is better than the current pbest, the evaluation value will be selected as pbest. If there is any change in the pbest for any particle, the new pbest will be compared with the current gbest if it is better than gbest, it will be selected as new gbest.
By the end of each run, the position of the particle with the gpest value is selected as vector for the best selected features of the current document. The weights of the document features are calculated as average of the vectors created in each run. The final features weights are calculated over the vectors of the features weights of all documents in the data collection
7.
Experimental Results
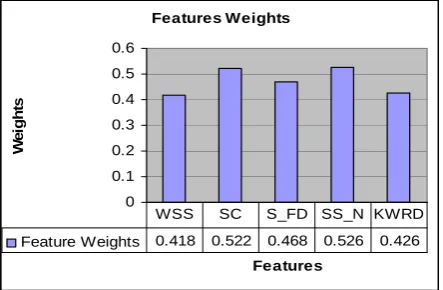
The main purpose of conducting this experiment is to study the effect of the feature structure on the feature selection process. Fig. 3 shows the final weights of the features used in this study. Each feature first got weight as average of its selection cases over five runs for each document in the data collection. Then the final weight of the feature is average of the feature average weight resulting in the five run over the total number of documents which is 100.
Features Weights
0 0.1 0.2 0.3 0.4 0.5 0.6
Features
We
ig
h
ts
Feature Weights 0.418 0.522 0.468 0.526 0.426 WSS SC S_FD SS_N KWRD
Fig. 3 Features weights
Acknowledgment
This project is sponsored partly by the Ministry of Science, Technology and Innovation under the E-Science grant 01-01-06-SF-0502.
8.
Conclusion
In this paper, we have investigated the influence of the feature structure on the feature selection process. Particle swarm optimization was used as features selection method through training process. We used 100 documents for training purpose. The final features weights shown that the feature structure plays an important role in the features selection process. The final average weights will be used as mechanism to distinguish between effective and ineffective features for scoring any new data. Future work will be to apply the features weights obtained from this study for text summarization problem.
References
[1]C. Tu, L. Chuang, J. Chang, and C. Yang, “Feature Selection using PSO-SVM”. IAENG International Journal of Computer Science. 33(1), 2006, pp.138-143
[2]Y. Liu, Z. Qin, Z. Xu and X. He, “Feature Selection with Particle Swarms”. In Computational and Information Science, LNCS 3314, J. Zhang, J.-H. He, and Y. Fu, Ed. Heidelberg: Springer-Verlag,2004, pp. 425–430.
[3]S. Lin, K. Ying, S. Chen and Z. Lee, “Particle swarm optimization for parameter determination and feature selection of support vector machines”. Expert Systems with Applications. 35, 2008, PP. 1817–1824.
[4]T. Lee, M. Cho and F. Fang, “Features Selection of SVM and ANN Using Particle Swarm Optimization for Power Transformers Incipient Fault” Symptom Diagnosis. International Journal of Computational Intelligence Research. 3(1) , 2007, pp. 60-65.
[5]S. Liangtu and Z. Xiaoming, “Web Text Feature Extraction with Particle Swarm Optimization”. International Journal of Computer Science and Network Security. 7(6), 2007, pp. 132-136.
[6]Ahmed, T. (2004). “Adaptive Particle Swarm Optimizer for Dynamic Environments”. Master Thesis. The University Of Texas, Texas.
[7]J. Kennedy, and R. Eberhart, “Particle swarm optimization”. Proceedings of the IEEE International Conference on Neural Networks. 27 Nov - 1 Dec,1995. Perth, Australia, PP. 1942- 1948.
[8]R. C. Eberhart, and Y. Shi, Particle swarm optimization: Developments, applications and resources. proceedings of the 2001 Congress on Evolutionary Computation. 27-30 May, 2001. Seoul, Korea: IEEE, PP. 81-86.
[9]J. Kennedy, R. C. Eberhart, “A discrete binary version of the particle swarm algorithm, Systems” Man, and Cybernetics.
Computational Cybernetics and Simulation, IEEE
International Conference on. 1997, vol. 5. New York, 4104-4108.
[10] C. Lin, “Rouge: A package for automatic evaluation of summaries”. Proceedings of the Workshop on Text Summarization Branches Out, 42nd Annual Meeting of the Association for Computational Linguistics. 25–26 July, 2004b. Barcelona, Spain, PP. 74-81.
[11] The Document Understanding Conference (DUC). http://duc.nist.gov.
Mr. Mohammed Salem Binwahlan received his B.Sc. degree in Computer Science from Hadhramout University of Science and Technology, Yemen in 2000. He received his Master degree from Universiti Teknologi Malaysia in 2006. He is currently with Hadhramout University of Science and Technology as lecturer and pursuing Ph.D degree in the Faculty of Computer Science and Information System, Universiti Teknologi Malaysia. His current research interest includes Information Retrieval, Text Summarization and Soft Computing.
Dr. Naomie Salim is an Assoc.Prof. presently working as a Deputy Dean of Postgraduate Studies in the Faculty of Computer Science and Information System in Universiti Teknologi Malaysia. She received her degree in Computer Science from Universiti Teknologi Malaysia in 1989. She received her Master degree from University of Illinois and Ph.D Degree from University of Sheffield in 1992 and 2002 respectively. Her current research interest includes Information Retrieval, Distributed Database and Chemoinformatic.