Manchester, United Kingdom - August 10-14, 2015
Division IX, Paper ID 576
ANALYSIS OF PORE STRUCTURE EFFECTS ON DIFFUSION IN
OPALINUS CLAY
Qingrong Xiong, Andrey P Jivkov
Research Centre for Radwaste & Decommissioning and Modelling & Simulation Centre, Dalton Nuclear Institute, The University of Manchester, UK.
ABSTRACT
Opalinus clay has a high sealing capacity and is therefore considered as viable candidates for hosting radioactive waste in future deep geological repositories. In order to validate and to predict the sealing capacity of the clay and the long-term containment performance of radioactive waste repositories, a comprehensive understanding of transport processes in the clay is necessary.
Pore network models are useful for linking material structure to longer length-scale diffusion, but in principle require accurate description of the morphology of real porous media to support model parameterisation, i.e. pore and throat size distribution, connectivity information. Opalinus clay has tight pore spaces and current experimental techniques do not allow for extracting sufficient connectivity data and throat sizes (if at all).
This work extends previous works on pore network modelling of porous media with limited structural information. Measured solid phase characteristics balance the insufficient geometrical and topological information for the clay pore systems to construct pore network. The constructed networks are described as mathematical graphs with diffusion modelled as a continuous process in water-saturated bonds.
The effects of length scale parameters and shaper factors on effective diffusivities are analyzed in this work. Calculated results are in the range of experimental data in different clay directions. The analyses suggest that the micro-pores, those smaller than 5nm, have major effect on diffusivity. Diffusion of larger complexes can be used for experimental validation of the model. The proposed methodology can be used for any micro and meso-porous material with limited information and be useful for further development of multi-phase and reactive transport.
1. INTRODUCTION
Opalinus clay (OPA) is considered as the main candidate in the decontamination and treatment of heavy metal ions (Aytas et al., 2009) and disposal of radioactive nuclear wastes (Boult et al., 1998). The principal mass transport mechanism is diffusion. Long-lived radionuclide is of great interest for risk assessment and performance of nuclear waste repositories (NuclearDecommissioningAuthority, 2014).
Engineering length scale assessments will use Fick’s law, which states that the diffusion flux of a species
through a medium is proportional to the species concentration gradient (Crank, 1980). The nature of the
conductive medium determines the coefficient of proportionality – the diffusivity. This means that
Pore network models (PNMs) provide a suitable description for dealing with mutable pore space
structures, which have been applied to single-phase transport problems (Reeves and Celia, 1996; Jivkov et
al., 2013b), multi-phase flow (Blunt, 2001), etc. The pore space is approximated by a set of sites connected by a set of bonds. The sites positions may form a regular lattice (regular PNM with one independent length scale) or reflect known length variations (irregular PNM).
PNM construction requires sufficiently experimental information: shape and size distribution of pores and throats, as well as the pore coordination spectrum, i.e. percentages of pores coordinated by different numbers of throats (Gao et al., 2012; Jivkov et al., 2013b). These can be obtained in structures with distinguishable pores and pore throats. However, pore space of OPA is dominated by meso-porosity (features between 5nm and 50nm) and micro-porosity (features smaller than 5nm) (NAGRA, 2002; Keller et al., 2011). Pore connectivity data cannot be extracted as throats cannot be identified at these length scales. The limited pore space structure information required different approaches for pore network construction.
Based on the limited experimentally reported data, two pore network models have been proposed. One is a regular PNM with pores from experimental distribution located at sites and notional throats between
each pair of neighbouring pores (Xiong et al., 2014). This method cannot change pore connectivity. The
other is an improved model with variable connectivity (Jivkov and Xiong, 2014). While this was more realistic in terms of pore space topology, the observable data was insufficient to establish rigorously a lattice length scale. The two approaches to tackle incomplete pore space information suffer from the lack of an additional constraint. This can be addressed by considering the solid phase structure, e.g. the shape and size distribution of mineral grains. This work proposes a methodology for incorporating the structure of the solid phase that improves substantially the realism of the constructed PNM, both in terms of geometry and topology. The proposal is conceptually different from the previous works and has the added benefit that the constructed PNM can be paired directly to lattice models of the solid phase developed for
analysis of damage evolution via micro-cracking (Jivkov et al., 2013a; Wang et al., 2015).
Usually the pore network model idealizes the pore space with simple geometries, i.e. pores are assumed to have uniform square or circular cross sectional shapes. This makes it difficult to simulate processes like sorption, which may change pore geometries by physical clogging. Recent advances have allowed to model pore geometries with irregular cross sectional shapes (Blunt, 2001). The influence of cross sectional shapes on diffusion and sorption will be analyzed in our work.
2. METHODOLOGY
2.1. Experimental Data
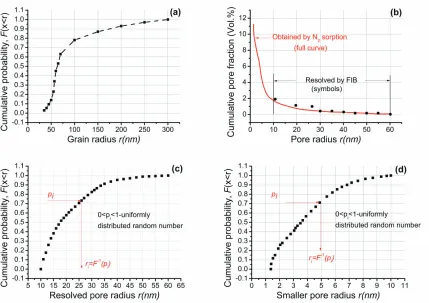
Regarding solid phase, Keller et al reported 18 vol.% non-porous carbonates with sizes ranging between 100 nm and 300 nm and 17 vol.% of non-porous quartz, the size distribution of which was undetermined. For constructing the model in this study, the reported data was converted into cumulative probability of carbonate grain sizes as shown in Fig. 1(a).
OPA displays pore sizes ranging from a few to several hundred nanometres (Keller et al., 2011). Pores
with radii larger than 10 nm were resolved by Focused Ion Beam nano-tomography (FIB-nt). These pores were elongated in the bedding plane occupying 1.8 vol.%. Pores with sizes smaller than 10nm occupied
approximately 9.7 vol.% obtained from N2 adsorption analysis. The pores with radii >10 nm and 10 nm
23rd Conference on Structural Mechanics in Reactor Technology Manchester, United Kingdom - August 10-14, 2015 Division IX
The above two measurements were combined into a single 'cumulative pore volume fraction – pore
radius' curve given in Fig 1(b) (Keller et al., 2011; Jivkov and Xiong, 2014). For model construction the
experimental distribution from Fig. 1(b) is converted to as cumulative probability separately for meso- and micro-pores. These are shown in Fig. 1(c) and Fig. 1(d), respectively. The use of the cumulative probability is to produce sizes from the measured distribution in Fig. 1(b) using a generator for uniformly
distributed numbers 0 ≤ p < 1. This is illustrated by the red arrows on Figs. 1(c) and 1(d); more details on statistics are given by Jivkov and Xiong (2014).
Fig. 1 Microstructure characteristics of Opalinus clay: (a) cumulative pore volume fraction versus pore
size determined by FIB-nt and N2 adsorption analyses (Keller et al., 2011); (b) cumulative distribution of
meso-pore sizes; (c) cumulative distribution of micro-pore sizes with assumed probability density (Jivkov
and Xiong, 2014); (d) cumulative distribution of carbonate grain sizes (Keller et al., 2013).
2.2. Pore Network Construction
The cellular basis for allocation of grains and pores results in complementary (dual) lattices for solid and pore systems, which needs to be selected first. The truncated octahedral cells (Fig.2a) have been used to represent a complex, proposed for site-bond modelling of solids (Jivkov and Yates, 2012), which was
used successfully in our previous works on transport problems (Jivkov et al., 2013b; Jivkov and Xiong,
2014; Xiong et al., 2014) and for mechanical analysis (Jivkov et al., 2012; Zhang and Jivkov, 2014). In
this work, we use a unit cell of this shape represents the average neighbourhood of a particle in OPA.
parameters, S1, S2, and S3, measuring the distances between the square faces in directions (1, 0, 0), (0, 1,
0) and (0, 0, 1), respectively. In an assembly of Nc cells, the particle radius, ri from Fig. 1(a), is assigned in each cell. The volume of all allocated particles is required to be equal to the experimentally-measured
particle volume fraction, f. From this requirement the volume of a cell assembly is calculated by:
3
1 2 3 1
4
1
1
3
2
c
N i c
i c
r
V
S S S
N
p
f
=æ
ö
=
ç
=
÷
è
ø
å
(1)where Vc is the volume of a cell. The calculation of the three length parameters from Eq. (1) depends on
the selection of their ratios used here to represent texture (a non-textured medium has S1 = S2 = S3).
Fig. 2 (a) a cellular assembly, illustrating particles of variable sizes allocated to cell interiors; (b) unit cell illustrating potential diffusion paths (bonds) in the neighbourhood of central particle; (c) exclusive assignment of meso-pores along (1, 0, 0) taken as the clay bedding direction; (d) pore network model after assignment of meso-pores (yellow) and micro-pores (red). Examples are given on lattice with equal length parameters for bedding and out-of-bedding directions.
We then propose a new pore network structure complementing the solid phase. Firstly, a skeleton is formed using sites at the centres of cell faces and bonds between neighbouring faces. This is illustrated in Fig. 2(b) on a single cell with S1 = S2 = S3. Considering the fact that the reported pore radii are derived
with the assumption of cylindrical pore shapes (Keller et al., 2011), The bonds show the positions where
23rd Conference on Structural Mechanics in Reactor Technology Manchester, United Kingdom - August 10-14, 2015 Division IX
reported meso-porous porosity. The micro-pores with radii selected from Fig. 1(c) are allocated to bonds not already occupied by the meso-pores. When the total pore volume fraction, from meso-pores and micro-pores, is equal to the experimental porosity, the process of pore distribution is ended. It should be noted that the pores can be assigned with different shapes. An example of a pore network model assigning meso-pores and pore sets is shown in Fig. 2(c) and Fig. 2(d). More details about meso- and micro-pore allocation can be found in Jivkov and Xiong, 2014.
2.3. Pore Diffusivities
The driving force for local diffusion is the concentration gradient between connected nodes with resistance provided by the pores. In reality, pores have different shapes. However, the experimental data
of cumulative pore fraction from Keller et al., 2011, substituted the irregular shape of pores by equivalent
circular shape. To reflect realistic situation, circularity dependent on shape factor is introduced to consider
the effect of pore shapes when all pores are assumed to be circular (Houben et al., 2013). In our work, the
pores are considered to be elongated conduits with different pore shapes. The diffusive flow, Jij, through a
pore is described by the Fick’s first law
4 i j
ij ij ij ij ij
c c J G D A
l
p
-= (2)
where Aij[L2] is the pore cross-section area, lij[L] is the pore length, ci – cj [ML-3] is the concentration difference between nodes, Gij denotes the pore shape factor Gij= Aij/ Pij2, 4πGij is the circularity, Pij is the perimeter of the pore cross-section, Dij[ M2T-1] is the pore diffusivity, which calculated in the same way as previous work (Xiong et al., 2014)
4 0 0 1 e e r D D R æ ö = ç - ÷
è ø (3)
where D0 is the free diffusion coefficients, which can be calculated with Einstein-Stokes equitation
(Cappelezzo et al., 2007). Three kinds of diffusing species are considered in this work: Hydrogen Tritium
Oxygen (HTO), with molecular size rA = 0.1 nm and free molecular diffusion coefficient, D0 = 2.24×10⁻⁹
m2/s (Mont Terri Project, 2010); Neutral U(VI) complex, Ca2UO2(CO3)3, with rA = 0.524 nm and D0 =
4.66×10⁻¹⁰ m2/s; Hypothetical solute particle with rA = 5 nm and D0 = 4.89×10⁻¹¹ m2/s.
Pore diffusivities enter a graph-theoretical representation of PNM, allowing for efficient solution of the transport through the network via discrete analysis on graphs as detailed by Jivkov and Xiong, 2014.
3. RESULTS AND DISCUSSION
The results presented hereafter were obtained with a pore network skeleton within the boxed region (0 ≤
X1 ≤ 20S1, 0 ≤ X2 ≤ 20S2, 0 ≤ X3 ≤ 20S3). Here, S1, S2, S3, are the cell sizes in the three coordinate
directions. The boundary conditions are: prescribing concentrations C0 and C1 on two opposite
boundaries, and isolating the remaining four boundaries. Analyses of ten random pore spatial distributions have been performed to obtain the transport in the bedding, S1, and out-of-bedding, S2, directions. As both
carbonates and quartz are non-porous, the quartz is assumed to follow the size distribution of the carbonate particles due to lack of quartz-specific experimental data. The results reported in this work are the averaged values on the basis of containing 35 vol.% solid particles. Specific details about the model and boundary conditions can be found in Jivkov and Xiong, 2014.
3.1. Shape factor effect on diffusivity
on the material texture, represented here by the ratios of the cell length parameters in three perpendicular
directions. Experimental results show that tortuosity is smaller in the bedding direction (Van Loon et al.,
2004). Therefore, we investigate the effect of larger cell length in the bedding direction and smaller cell lengths in the directions perpendicular to bedding. In this work, the cell length parameters, S1 / S2 = 2 and
S2 = S3, are assumed to investigate the effect of shape factors on effective diffusivities.
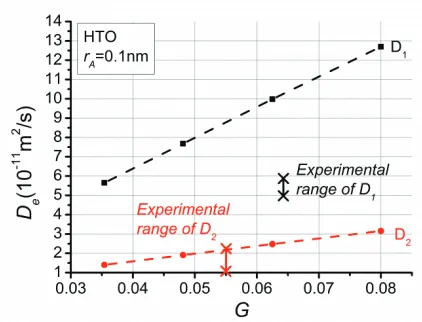
The effective diffusivities of HTO in both directions, D1 and D2, are shown to increase as the average shape factor G increases. The calculated effective diffusivity of HTO is in the following ranges: D1 =
5.65×10⁻¹¹ ~ 12.7×10⁻¹¹ m2/s; D2 = 1.40×10⁻¹¹ ~ 3.16×10⁻¹¹ m2/s (see Fig. 3). It should be noted that D1
and D2 are the diffusion coefficients along the bedding plane and out-of-bedding directions, respectively.
Reported experimentally obtained values for HTO diffusion in OPA shown in Fig. 3 are D1 =
(5.4±0.4)×10-11 m2/s (Van Loon et al., 2004; Project, 2010) and D2 = (1.6±0.6)×10-11 (Van Loon et al.,
2003; Joseph et al., 2013). The simulated results for HTO are in good agreement with experimental
investigations when average shape factor, G, is equal to 0.0354, in Fig.3. The circularity with shape factor
0.0354 is 0.445 which is very close to the experimentally reported average value, 0.45, reported by Houben et al., 2013.
Overall, the model in this work can predict diffusion in OPA very well. The difference between the computational and the experimental results could be partially due to a difference between the microstructure characteristics of OPA obtained by Keller et al., 2011, and Keller et al., 2013 used for model construction, and the clays used for experimental measurement of effective diffusion coefficients by Van Loon et al., 2004, and Joseph et al., 2013.
Fig. 3. Calculated effective diffusivity of HTO and U(VI) in OPA accounting for carbonates and quartz as non-porous particles with combined volume fraction of 0.35. Shape factors and experimentally determined ranges of OPA diffusion coefficients are shown for comparison.
3.2. Texture effect on diffusivity
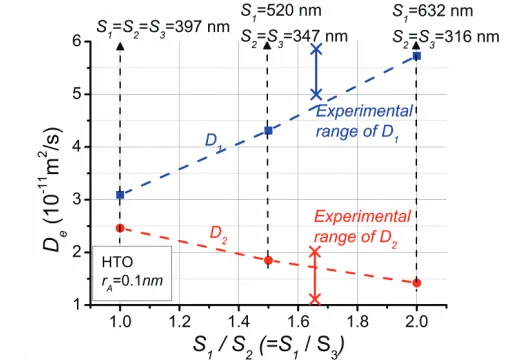
To investigate the effect of texture on diffusivity, the shape factor of 0.035 is adopted and the out-of-bedding directions are not differentiated, i.e. the case of having S2 = S3 is assumed. Three ratios of the cell
length parameters are considered: S1 / S2 = 2, 1.5, 1. The effective diffusivity in the bedding direction, D1,
is shown to increase as the ratio S1 / S2 increases, i.e. the material texture becomes more pronounced.
Because the cell volume is determined by the solid phase characteristics, the volume of meso-pores is
fixed by their volume density. Since the meso-pores are located entirely in the bedding, the increase of S1
decreases the number of meso-pores in the pore network. The effective diffusivity D1 could be anticipated
23rd Conference on Structural Mechanics in Reactor Technology Manchester, United Kingdom - August 10-14, 2015 Division IX
such an expectation. Although increasing S1 reduces meso-pores, it leaves more space for micro-pores
assignment. The significance of the micro-pores in bedding direction is increased. Further, the increase of S1 leads to longer meso-pores. This alone reduces the macroscopic tortuosity. The combined effect is
reduction of macroscopic tortuosity and corresponding, albeit not large, increase of diffusivity.
The reduction of effective diffusion coefficientperpendicular to the bedding direction, D2, yields increase
of the ratio S1 / S2. This is due to the following reasons: Firstly, because increasing S1 causes less
meso-pores in the bedding direction, the number of bonds in this direction allowed allocating micro-meso-pores increases. This results in smaller number of micro-pores in the out-of-bedding directions. Secondly, the
decrease of S2 alone leads to increase of tortuosity in the of-bedding directions. In addition, the
out-of-bedding micro-pores become shorter, which reduces the effect of approximating them with straight segments.
The calculated diffusion coefficients of HTO are in the following ranges: D1 = 3.09×10⁻¹¹ ~ 5.73×10⁻¹¹
m2/s; D2 = 1.42×10⁻¹¹ ~ 2.46×10⁻¹¹ m2/s (see Fig. 4). Experimentally data for HTO diffusion in OPA
shown in Fig. 4 is D1 = (5.4±0.4)×10-11 m2/s (Van Loon et al., 2004; Project, 2010) and D2 =
(1.6±0.6)×10-11 (Van Loon et al., 2003; Joseph et al., 2013). When S1/S2 = 2, the simulated results are closest to the experimental values. The difference between the computational and the experimental results is the same as previous section.
Fig. 4. Calculated macroscopic (effective) diffusivity of HTO in OPA. Clay textures are measured by the ratio of length parameters in the bedding, S1, and the out-of-bedding, S2, directions. D1 and D2 are the
diffusion coefficients parallel and perpendicular to the bedding plane.
3.3. Solute size effect on diffusivity
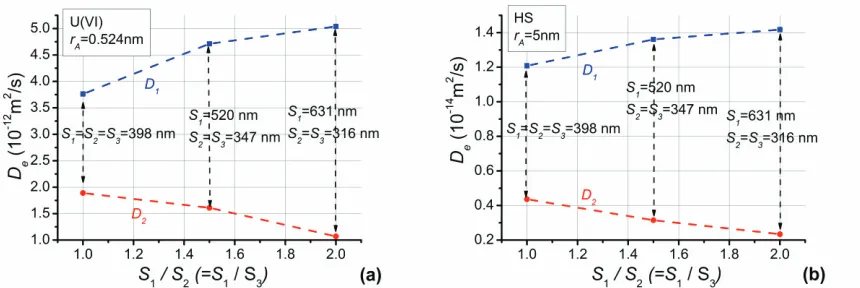
The predicted effective diffusion coefficients for HS are: D1 = 2.68×10⁻¹⁴ ~ 3.15×10⁻¹⁴ m2/s, D2 = 5.2×10 -15 ~ 9.7×10⁻¹⁵ m2/s.
From Figs. 4 and 5, it can be seen how the effect diffusivity decreases as the solute size increases. In particular, the effective diffusivity of HS is about three orders of magnitude smaller than the diffusivity of HTO for a 50-times difference in molecular size. This is due to the large fraction of pores with diameters below 5 nm in OPA, through which the large solute cannot diffuse. The observation allows for defining
an “effective connectivity” controlled by the solute size, relative to a base connectivity associated with
selected solute, e.g. HTO. The “effective connectivity” is a larger fraction of the base connectivity in the
bedding direction than in the perpendicular direction. This is seen from Figs. 4 and 5, where the difference between D1 and D2 increases as the solute size increases. In other words, the solute size has a
larger influence on the macroscopic diffusivity in out-of-bedding directions, which is expected because these contain only pores with diameters below 10 nm.
Notably, the analyses shows that by proper selection of solute size one can find clearly separated diffusivity intervals to plan and perform verification experiments. Species of molecular size smaller than 5 nm would be a better alternative than the hypothetical solute of this work, because the measurement of diffusivities in the order of 10-14-10-15 m2/s is impractical. Preparation for verification experiments is subject of ongoing work
Fig. 5. Calculated macroscopic diffusivity of U(VI) complex (a), and 5nm-solute (b) in OPA. Length parameters determined from 0.35 volume fraction of non-porous particles (carbonates and quartz).
4. CONCLUSIONS
A discrete model for mass transport through porous media has been proposed to balance incomplete knowledge of geometrical and topological pore system characteristics. The proposed model can be potentially used for coupling with deformation and fracture of porous media, where the pore system and the solid phase, represented as dual graphs, will interact effectively.
23rd Conference on Structural Mechanics in Reactor Technology Manchester, United Kingdom - August 10-14, 2015 Division IX
ACKNOWLEDGEMENTS
Xiong acknowledges gratefully the Doctoral Award from the President of The University of Manchester. Jivkov acknowledges the support from BNFL for the Research Centre for Radwaste & Decommissioning and from EdF R&D for the Modelling & Simulation Centre.
REFERENCES
Aytas, S., Yurtlu, M. and Donat, R. (2009) Adsorption characteristic of u(vi) ion onto thermally activated bentonite. J Hazard Mater, 172, 667-674.
Blunt, M.J. (2001) Flow in porous media—pore-network models and multiphase flow. Current opinion in
colloid & interface science, 6, 197-207.
Boult, K., Cowper, M., Heath, T., Sato, H., Shibutani, T. and Yui, M. (1998) Towards an understanding
of the sorption of u (vi) and se (iv) on sodium bentonite. Journal of Contaminant Hydrology, 35,
141-150.
Cappelezzo, M., Capellari, C., Pezzin, S. and Coelho, L. (2007) Stokes-einstein relation for pure simple fluids. The Journal of chemical physics, 126, 224516.
Crank, J. (1980) The mathematics of diffusion. Oxford University Press.
Gao, S., Meegoda, J.N. and Hu, L. (2012) Two methods for pore network of porous media. International
Journal for Numerical and Analytical Methods in Geomechanics, 36, 1954-1970.
Houben, M.E., Desbois, G. and Urai, J.L. (2013) Pore morphology and distribution in the shaly facies of
opalinus clay (mont terri, switzerland): Insights from representative 2d bib–sem investigations on
mm to nm scale. Applied Clay Science, 71, 82-97.
Jivkov, A.P., Engelberg, D.L., Stein, R. and Petkovski, M. (2013a) Pore space and brittle damage
evolution in concrete. Engineering Fracture Mechanics.
Jivkov, A.P., Gunther, M. and Travis, K.P. (2012) Site-bond modelling of porous quasi-brittle media. Mineralogical Magazine, 76, 2969-2974.
Jivkov, A.P., Hollis, C., Etiese, F., McDonald, S.A. and Withers, P.J. (2013b) A novel architecture for
pore network modelling with applications to permeability of porous media. Journal of Hydrology,
486, 246-258.
Jivkov, A.P. and Xiong, Q. (2014) A network model for diffusion in media with partially resolvable pore space characteristics. Transport in porous media, 105, 83-104.
Jivkov, A.P. and Yates, J.R. (2012) Elastic behaviour of a regular lattice for meso-scale modelling of solids. International Journal of Solids and Structures, 49, 3089-3099.
Joseph, C., Van Loon, L.R., Jakob, A., Steudtner, R., Schmeide, K., Sachs, S. and Bernhard, G. (2013) Diffusion of u(vi) in opalinus clay: Influence of temperature and humic acid. Geochimica et Cosmochimica Acta, 109, 74-89.
Keller, L.M., Holzer, L., Wepf, R. and Gasser, P. (2011) 3d geometry and topology of pore pathways in opalinus clay: Implications for mass transport. Applied Clay Science, 52, 85-95.
Keller, L.M., Schuetz, P., Erni, R., Rossell, M.D., Lucas, F., Gasser, P. and Holzer, L. (2013)
Characterization of multi-scale microstructural features in opalinus clay. Microporous and
Mesoporous Materials, 170, 83-94.
NAGRA. (2002) Projekt opalinuston: Synthese der geowissenschaftlichen untersuchungsergebnisse Technischer Bericht, 02 -03, 250-252.
NuclearDecommissioningAuthority. (2014) Geological disposal science & technology plan Report
NDA/RWM/121, Appendix B, 182-196.
Project, M.T. (2010) Long-term diffusion (di-a) experiment: Di-a2: Diffusion of hto, br-, i-, cs+, 85sr2+ and
60co2+: Field activities, data and modelling. Report TR, 2009-2004.
Qingrong, X. and Andrey, J. Analysis of pore structure effects on diffusive transport in opalinus clay via
Reeves, P.C. and Celia, M.A. (1996) A functional relationship between capillary pressure, saturation, and
interfacial area as revealed by a pore-scale network model. Water Resources Research, 32,
2345-2358.
Van Loon, L., Soler, J. and Bradbury, M. (2003) Diffusion of hto, 36cl− and 125 i− in opalinus clay samples
from mont terri: Effect of confining pressure. Journal of Contaminant Hydrology, 61, 73-83.
Van Loon, L.R., Soler, J.M., Müller, W. and Bradbury, M.H. (2004) Anisotropic diffusion in layered argillaceous rocks: A case study with opalinus clay. Environmental science & technology, 38, 5721-5728.
Wang, X.F., Yang, Z.J., Yates, J.R., Jivkov, A.P. and Zhang, C. (2015) Monte carlo simulations of
mesoscale fracture modelling of concrete with random aggregates and pores. Construction and
Building Materials, 75, 35-45.
Xiong, Q., Jivkov, A.P. and Yates, J.R. (2014) Discrete modelling of contaminant diffusion in porous
media with sorption. Microporous and Mesoporous Materials, 185, 51-60.
Zhang, M. and Jivkov, A. (2014) Microstructure-informed modelling of damage evolution in cement