JAYARAMAN, ARTHI. Computer Simulation Studies of Pattern Recognition in Biomimetic Polymers. (Under the direction of Carol K. Hall and Jan Genzer)
The overall aim of this research has been to understand the molecular phenomena governing recognition in biological processes such as antibody-antigen binding, transmembrane signaling, viral-inhibition, etc. Specifically, we use computer simulations to study the thermodynamics of recognition of patterns in a copolymer bulk adsorbed on a heterogeneous surfaces, recognition of monomer sequences in copolymers adsorbed on heterogeneous surfaces, and recognition of nucleotide sequences in DNA microarrays.
We first focus on the recognition of a bulk pattern in an AB diblock copolymer film adsorbed on a heterogeneous surface. We investigate how a pattern imposed in a copolymer film at a certain distance from the surface propagates through the film onto an adsorbing heterogeneous surface. We bias the copolymer film to adopt a specified target pattern and then use simulation to design a surface pattern that helps the adsorbed film to maintain that target pattern. We examine the effect of varying the copolymer chain length, the size of the target pattern, and the distance,
, from the surface where the target pattern is applied on the extent of pattern transfer. At constant chain length, pattern transfer is best when the pattern size brings the energy of the system close to the energy when no pattern is applied. At constant pattern size, pattern transfer is best in the systems with longer chains because longer chains are more likely to adsorb as brushes and loops, which then helps transfer the pattern through the adsorbed film down to the surface.
recognizing specific monomer sequences in copolymers, has not been answered yet. We have developed a novel simulation method to design surfaces for recognizing specific monomer se-quences in copolymers. We fix the sequence statistics of the AB copolymers and adsorb them on a surface containing two types of sites. We allow the simulation to iterate towards an optimal surface pattern that can ”recognize” and selectively adsorb the copolymer sequence. For copoly-mers with less blocky sequences the designed surfaces recognize the correct sequence well when the segment-surface interactions dominate over the intersegment interactions. For copolymers with more blocky sequences recognition is good when the segment-surface interactions are only slightly stronger than the intersegment interactions.
Polymers
by
ARTHI JAYARAMAN
A dissertation submitted to the Graduate Faculty of North Carolina State University
in partial fulfillment of the requirements for the Degree of
Doctor of Philosophy
Chemical Engineering
Raleigh, NC 27695 January 5, 2006 APPROVED BY:
Carol K. Hall Jan Genzer
Chair of Advisory Committee Co-chair of Advisory Committee
Biography
Acknowledgments
It is my pleasure to acknowledge all the people who have contributed their wisdom, support and encouragement towards the completion of this thesis.
I would like to thank my advisors Professor Carol Hall and Professor Jan Genzer for their insight, vision, passion and enthusiasm that started and propelled this project to its current state. I am grateful to them for being my mentors both in career directions and personal matters. I would also like to thank Professor Saad Khan for his encouragement and helpful discussions regarding my career.
I thank the Chemical Science Division of the U.S. Department of Energy for the financial support that made this research possible.
I thank the Hall research group, past and present, for providing a dynamic and enjoyable work environment. I would like to thank fellow systems administrators, Brian Attwood, Andrew Schultz, Alex Marchut, Aysa Akad, Victoria Wagoner and Amit Goyal, for the time and energy they have spent in maintaining the computer network. Special thanks to Andrew Schultz for helpful discussions about my research. Special thanks go to my dear friends Victoria Wagoner and Aysa Akad for the love, warmth, and support they have given me during my good and bad times.
all my life. Special thanks to my sister, Vasanthi Jayaraman, and my brother-in-law, Ramanan Krishnamoorti, for all the good times we have shared together. Special thanks to my nephew Ayush Krishnamoorti who always brings a smile to my face with his innocent laughter and delight.
I cannot express with words my immense gratitude to my mother, Jaya Jayaraman. I am forever indebted to her for all the sacrifices she has made for me in her life. She is the epitome of wisdom, grace, kindness, patience and dignity, and I cannot thank her enough for her love and support, especially in the years after my father’s passing.
Table of Contents
Page
List of Tables x
List of Figures xii
Chapter 1 Introduction 1
1.1 Overview . . . 2
1.2 References . . . 8
Chapter 2 Computer simulation study of pattern transfer in AB diblock copolymer film adsorbed on a heterogeneous surface 9 2.1 Introduction . . . 9
2.2 Model and Methods . . . 14
2.2.1 Simulation Technique . . . 14
2.2.2 Adsorption features . . . 19
2.2.3 Calculation of the extent of pattern transfer . . . 20
2.3 Results and Discussion . . . 21
2.3.1 Pattern transfer for different chain lengths . . . 22
2.3.2 Pattern transfer for different pattern sizes . . . 27
2.4 Summary . . . 31
2.5 Acknowledgements . . . 32
2.6 References . . . 33
2.7 Figures . . . 37
Chapter 3 Designing pattern recognition surfaces for selective adsorption of copoly-mer sequences using lattice Monte Carlo simulation 47 3.1 Introduction . . . 47
3.2 Method . . . 49
3.3 Results and Discussion . . . 52
3.4 Acknowledgements . . . 56
3.5 References . . . 57
3.6 Figures . . . 59
Chapter 4 Molecular Recognition in Model DNA Microarrays: A Computer Simu-lation Study 64 4.1 Introduction . . . 64
4.2 Model and Method . . . 71
4.3 Results and Discussion . . . 73
4.3.1 Effect of probe length . . . 74
4.3.2 Effect of position of complementary segments in the target . . . 76
4.3.3 Effect of hybridization energy . . . 77
4.3.5 Kinetics of hybridization . . . 80
4.4 Discussion . . . 81
4.5 Acknowledgements . . . 83
4.6 References . . . 84
4.7 Figures . . . 94
Chapter 5 Molecular Recognition in Model DNA Microarrays: Multiple Probes And Single Target 103 5.1 Results and Discussion . . . 104
5.2 Conclusion . . . 108
5.3 Appendix . . . 108
5.3.1 Surface density calculation . . . 108
5.4 References . . . 110
5.5 Figures . . . 111
Chapter 6 Theory and simulation study of kinetics of hybridization in DNA microar-rays 117 6.1 Introduction . . . 117
6.2 Simulation Method . . . 118
6.3 Simulation Results . . . 119
6.4 Theory . . . 121
6.5 Comparison of Theory and Simulation . . . 134
6.6.1 Spin operators . . . 135
6.6.2 Calculation of the matrix M expression . . . 136
6.7 References . . . 139
6.8 Figures . . . 140
Chapter 7 Future Work 146 7.1 Pattern Recognition on Chemically and Physically Heterogeneous Surfaces . . 146
7.2 Pattern Recognition on Charged Surfaces . . . 147
7.3 DNA Microarrays . . . 148
7.4 Theory of Kinetics of Hybridization . . . 148
7.5 References . . . 151
List of Tables
Page
Chapter 1 Introduction 1
Chapter 2 Computer simulation study of pattern transfer in AB diblock copolymer
film adsorbed on a heterogeneous surface 9
2.1 Pattern transfer parameter PTP(z=0) for different chain lengths and pattern sizes. 23 2.2 Fraction of chains in the system adsorbed in different conformations . . . 25 2.3 Average equilibrium
for different chain lengths and pattern sizes 1. during surface design, and 2. in test stage . . . 30
Chapter 3 Designing pattern recognition surfaces for selective adsorption of
copoly-mer sequences using lattice Monte Carlo simulation 47
3.1 The order parameter (OP) of the designed surfaces for each copolymer type for set I, set II, and set III interactions. . . 53
Chapter 4 Molecular Recognition in Model DNA Microarrays: A Computer
Simu-lation Study 64
Chapter 5 Molecular Recognition in Model DNA Microarrays: Multiple Probes And
Single Target 103
5.1 Overlap surface density for varying probe lengths . . . 105 5.2 Surface density for varying number of probes on the surface . . . 109
Chapter 6 Theory and simulation study of kinetics of hybridization in DNA
microar-rays 117
List of Figures
Page
Chapter 1 Introduction 1
Chapter 2 Computer simulation study of pattern transfer in AB diblock copolymer
film adsorbed on a heterogeneous surface 9
2.1 Contour plots for loop conformation (I), flat conformation (II), and brush confor-mations (III and IV). denotes the fraction of chain length adsorbed.
denotes the ratio of the number of adsorbed segments on type 1 sites over total num-ber of adsorbed segments. The contour plots show the fraction of chains in the simulation box with the characteristics and
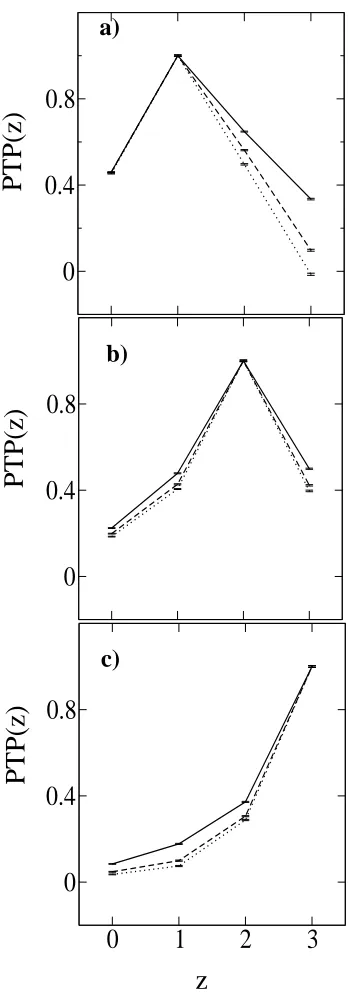
. The values of the fractions are indicated by the colors shown in the key. . . 39 2.2 Pattern transfer parameter, PTP(z), for chain length = 12, as a function of the
distance from the surface, z, for different target patterns: 6x6 (solid line), 12x12 (dashed line), and 24x24 (dotted line) applied at a)
, b)
c) . 40
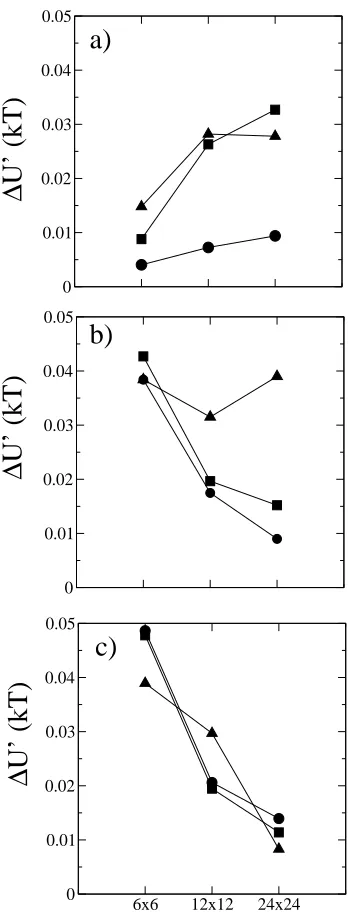
2.3 The difference,
, between the system internal energy when the target pattern is applied and when no target pattern is applied for different target pattern sizes at chain lengths a) 12, b) 18, c) 24. The circles represent
, squares represent
, and triangles represent
2.4 Contour plot for chain length 18, showing, , the fraction of chain length ad-sorbed and
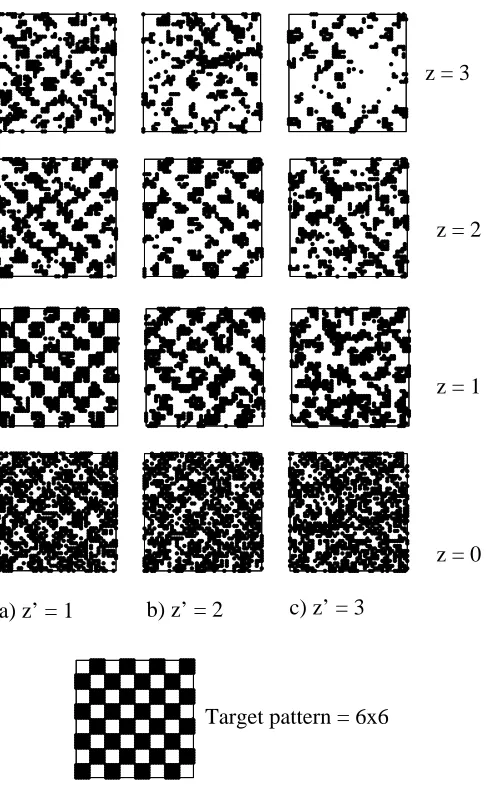
, the ratio of the number of adsorbed segments on top of type 1 sites to the total number of adsorbed segments. The values of the fractions are indicated by the colors in the key on Figure 2.1c. . . 42 2.5 The designed surfaces (
) when the 6x6 pattern is applied at a) , b)
, c)
with
. The 6x6 target pattern is shown for comparison. Also shown are the patterns observed in the bulk at
when diblock copolymers of chain length 12 are adsorbed on the designed surfaces. . 43 2.6 The designed surfaces (
) when the 6x6 pattern is applied at a) ,
b)
, c)
with
. The 6x6 target pattern is shown for comparison. Also shown are the patterns observed in the bulk at
when diblock copolymers of chain length 12 are adsorbed on the designed surfaces. . 44 2.7 The designed surfaces (
) when the 6x6 pattern is applied at a) , b)
, c)
with
. The 6x6 target pattern is shown for comparison. Also shown are the patterns observed in the bulk at
when diblock copolymers of chain length 12 are adsorbed on the designed surfaces. . 45 2.8 The designed surfaces (
) and the patterns observed in the bulk at when the 6x6 pattern is applied in a bulk of diblock copolymers of chain length 12 at a)
, b) , c)
with
. . . 46
Chapter 3 Designing pattern recognition surfaces for selective adsorption of
3.1 The surfaces designed for [A B ], [A B ], [A B ], [A B ], [A B ], and [A B ] copolymers with set I interactions. . . 60 3.2 The selectivity of the surfaces designed for copolymers a) [A B ], b) [A B ],
c) [A B ], d) [A B ], e) [A B ], and f) [A B ] with set I (squares + solid line), set II (circles + dashed line), and set III (triangles + dotted line) interaction potentials . . . 61 3.3 The selectivity of the surfaces designed for a) [A B ] copolymer with 0 % (solid
line) and 10 % (dashed line) neutral sites and b) [A B ] copolymer at 0 % (solid line) and 30 % (dashed line) neutral sites, using set III interactions. . . 62 3.4 Selectivity of checkerboard (squares solid line) and designed surfaces (circles
dashed line) for the different copolymers with set III interactions except as noted a) 1x1 versus surface designed for [A B ] with 0% neutral sites b) 2x2 ver-sus surface designed for [A B ] with 10% neutral sites c) 3x3 versus surface designed for [A B ] with 0% neutral sites, d) 4x4 versus surface designed for [A B ] with 10% neutral sites, e) 6x6 versus surface designed for [A B ] with 30% neutral sites, and f) 12x12 versus surface designed for [A B ] with 0% neutral sites using set I interactions. . . 63
Chapter 4 Molecular Recognition in Model DNA Microarrays: A Computer
4.1 A schematic for the three types of probes for probe length 8 (target not drawn to scale). The segments of the probe are complementary to A) segments 1 - 8 along the target (end type), B) segments 13 - 20 along the target (mid type), and C) segments 21 - 28 along the target (center type). . . 96 4.2 Effect of probe length on probability of binding a contiguous stretch of segments
along target to the probe segments for end type probes at
and spacer length = 4. . . 97 4.3 Comparison of probability of binding all the probe segments to the
complemen-tary target segments versus probe length for end type, mid type and center type probes. . . 98 4.4 Effect of hybridization energy – 2kT(circle), 3kT (squares) and 4kT
(triangle)-on probability of binding a) all probe segments and b)short c(triangle)-ontiguous stretch of probe segments to the complementary target segments for end type probes of varying length with spacers of length 4. . . 99 4.5 Effect of spacers of length 0 (circle), 4(triangle), 12(square) and 24(diamond) on
probability of binding a contiguous stretch of segments along target to the probe segments for end type probe of length 12 segments. . . 100 4.6 Probability of starting hybridization versus probe segment number for varying
lengths of end type probe, at and spacer length = 4. . . 101 4.7 Fraction of simulation time that a segment is bound versus probe segment
num-ber for varying lengths of end type probe, at
and spacer length = 4. . . 102
Single Target 103
5.1
versus probe length for 0.00176 (red line), 0.00390 (green line), 0.00694 (blue line) and 0.0156 (cyan) number of end type probes per
on the surface for spacer length 4 segments and . . . 112 5.2
versus probe length for 0.00176 (red line), 0.00390 (green line), 0.00694 (blue line) and 0.0156 (cyan) number of end type probes per
on the surface for spacer length 4 segments and . . . 113 5.3 Probability of a contiguous stretch of segments along target binding to segments
along end type probes of length 12 segments with spacer length = 4 at
for 1 (cross), 4 (triangle), 16 (square), 36 (circle), 64 (inverted triangle) and 144 (diamond) number of probes tethered to the surface. . . 114 5.4 Contour plots of probability (contours) of a contiguous stretch of segments along
target (y-axis) binding simultaneously to more than one probe (x-axis) for a) 16, b) 36, c) 64 and d) 144 end-type probes of length 12, spacer length = 4 at
. 115 5.5 Contour plots of probability (contours) of binding a contiguous stretch of
seg-ments along target to the probe segseg-ments for 144 end type probes of length a) 8, b) 12, c) 16, d) 20 and e) 24 at and spacer length = 4. . . 116
Chapter 6 Theory and simulation study of kinetics of hybridization in DNA
microar-rays 117
6.1
vs t for a system with a single probe of length 8, spacer length 4, target length 48 segments at
6.2
vs t for probe of length 12, spacer length 4, target length 48 segments at
. . . 142
6.3
vs t for probe of length 16, spacer length 4, target length 48 segments and
. . . 143 6.4 3 possible cases of probe-target segment binding . . . 144 6.5 Feynmann diagram for increasing powers of acting on
. . . 145
Chapter 7 Future Work 146
C
HAPTER
1
I
NTRODUCTION
Pattern recognition is a process in which two or more molecules identify one another based on their shapes, sizes, chemical sequences, physical properties, etc., and bind to each other in a highly specific way. Pattern recognition plays a major role in many biological processes such as antibody-antigen binding, DNA hybridization, transmembrane signaling, viral-inhibition, etc. Pattern recognition also has practical implications in pattern driven self-organization of nanocomposites with novel mechanical, optical or electrical properties, in designing smart sen-sors that are capable of discriminating between different analytes or toxins, in discovery of new drugs that bind to specific receptors, and in the development of chromatographic materials for target separations, just to name a few examples.
1.1
Overview
In this section, we summarize the remaining chapters of this thesis. All chapters contain their own literature review and bibliography.
Chapter 2 describes our investigation of pattern transfer in a AB diblock copolymer film adsorbing onto a flat, chemically-heterogeneous surface. We use lattice Monte Carlo simulations to explore how the length of the diblock copolymer, size of the patterns (checkerboard) and the distance from the surface where the pattern originally exists affect the extent of pattern transfer through the adsorbed layers to the surface. This study of how a diblock copolymer film transfers patterns with sizes on the order of the copolymer length scale through the adsorbed layers could help us to understand how to form unique nanoscale structures which in turn would be useful in nanolithography and the development of photonic devices
the target pattern, the higher the extent of pattern transfer through the adsorbed layers.
We study three different chain lengths (12, 18 and 24) and three different pattern sizes (checkerboard pattern of sizes 6x6, 12x12, and 24x24) applied at three different distances from the surface (
and ). We compare the results from each of these systems to the results when no pattern is applied in the adsorbed layers,i.e., the copolymer chains are free to attain their natural conformations. We do this comparison to understand why a certain pattern size gets transferred to the surface better than the other patterns. We find that as we increase the distance from the surface where the target pattern is applied, the pattern transfer to the surface decreases for all patterns and all chain lengths. For a constant pattern size, the pattern transfer to the surface increases as the chain length increases. For a constant chain length, the patterns that help the chains attain energies close to the case when no pattern is applied get transferred to the surface well. To test if we can use the designed surfaces from this stage to induce the target pattern in the adsorbed layers of a new copolymer bulk, we let a new copolymer bulk in a random configuration adsorb onto each of these ”designed” surfaces. We do not see the transfer of the surface pattern back to the adsorbed layers for all the pattern sizes and chain lengths considered. Instead the copolymer chains form other energetically favorable patterns.
Chapter 3 describe how lattice Monte Carlo simulations can be used to design optimum surfaces for recognizing specific monomer sequences in a mixture of many copolymer sequences. We perform lattice Monte Carlo (MC) simulation on a system of AB copolymers of length 24 with six possible monomer sequences: [A B ], [A B ], [A B ], [A B ], [A B ], and [A B ] and a surface containing two types of sites: 1 and 2. The segment-surface interactions, and
, and intersegment interactions,
is split into two steps: design and test. In the design step we ”train” the surface to recognize the monomer sequence by adsorbing a bulk of copolymers of that same monomer sequence. We ”train” the surface by switching the identities of randomly picked surface sites. In the test step we introduce the designed surface to a mixture containing the six types of copolymers and observe if the surface recognizes and selectively adsorbs the copolymer with the right sequence.
neutral.
Chapter 4 describes Monte Carlo simulations of coarse-grained lattice-model DNA molecules on model microarray surfaces aimed at uncovering the basic physics underlying the hybridization process. Our system consists of a single probe molecule tethered to a hard sur-face and a single target molecule. The probe and target molecules are modeled as self-avoiding chains on a cubic lattice. Each of the segments on the probe molecule recognizes and preferen-tially binds to its uniquely complementary segment on the target with an attractive interaction potential, . We study how the hybridization of the probe and the target is affected by the probe length, hybridization strength , and the position of the complementary segments on the target. We observe that as the probe length decreases, the probability that they bind all their segments to the complementary segments on the target increases, which in turn increases the ability of the probe to discriminate between perfectly complementary and partially complementary tar-gets. This implies that shorter probes have higher specificity. Probes with segments that are complementary to the segments at either ends of the target have higher specificity than probes with segments that are complementary to the center portion of the target. At strong hybridization strength (
) the probes tend to bind all their segments to the target. At low hybridization strength (
) the probes tend to stay unbound or bind only a few segments to the target. At intermediate hybridization strength (
high if the mismatches in the target lie in the region complementary to the center portion of the probe.
Chapter 6 describes our study of the kinetics of hybridization of single-stranded “target” genes in solution with complementary “probe” DNA molecules immobilized on a microarray surface. The target molecules in our system contain 48 statistical segments and the probes teth-ered on a hard surface contain 8 to 16 segments. The segments on the probe and target are distinct and each segment represents a sequence of nucleotides. Each probe segment interacts exclusively with its unique complementary target segment with a single hybridization energy
; all other interactions are zero. We first use lattice Monte Carlo simulations to obtain a time correlation function
that explains how the hybridization progresses along the probe from the point of nucleation (the segment that starts the hybridization). In other words,
predicts the state of the
segment at time
with respect to the state of the
segment at time
when the
segment starts the hybridization. Since each segment on the probe has one of two states - bound (+1) and unbound (-1) we use spin-1/2 theory to obtain a mathematical expression for
.
Chapters 2-6 have been adapted from the following publications:
Chapter 2 A. Jayaraman, C. K. Hall and J. Genzer,”Computer Simulation study of pattern
trans-fer in AB diblock copolymer film adsorbed on a heterogeneous surface ” J. Chem. Phys. 123 124702 (2005).
Chapter 3 Arthi Jayaraman, Carol K. Hall and Jan Genzer,”Designing Pattern-Recognition
Chapter 4 A. Jayaraman, C. K. Hall and J. Genzer, ”Molecular recognition in model DNA
microarrays : A computer simulation study ” (in preparation).
Chapter 5 A. Jayaraman, C. K. Hall and J. Genzer, ”A computer simulation study of model
DNA microarrays: multiple probes and multiple targets ” (in preparation).
Chapter 6 A. Jayaraman, E. E. Santiso, C. K. Hall and J. Genzer,”Theory and simulation study
1.2
References
[1] M. J. Fasolka and A. M. Mayes, “Block Copolymer Thin Films : Physics and Applications,”
Annu. Rev. Mater. Res. 31, 323 (2001).
[2] J. K. Cox, A. Eisenberg, and R. B. Lennox, “Pattern surfaces via self-assembly,” Curr. Opin.
C
HAPTER
2
C
OMPUTER SIMULATION STUDY OF PATTERN
TRANSFER IN
AB
DIBLOCK COPOLYMER FILM
ADSORBED ON A HETEROGENEOUS SURFACE
2.1
Introduction
Adsorption of polymers on solid surfaces plays an important role in many technological and scientific applications including adhesion , chromatography
, nanoscale patterning
, biomedical implant modification
, etc. In order to exploit these applications, it is important to understand how polymers organize in the vicinity of surfaces. Most surfaces in nature are physically or/and chemically heterogeneous and many polymers are typically composed of two or more types of monomers arranged in a specified sequence (diblock, triblock, alternating copolymers) or a random sequence. Therefore, studying the adsorption of heteropolymers on heterogeneous surfaces is useful in describing real world situations.
There have been many experimental efforts aimed at understanding how chemically hetero-geneous patterns on surfaces induce ordering in adsorbed block copolymers –
. Rockford et
al.
copoly-mers on surfaces containing alternating stripes of gold and silicon oxide. The PS-PMMA block copolymers formed ordered lamellar microdomains oriented perpendicular to the surface with the PS domains covering the gold stripes and the PMMA domains covering the silicon oxide stripes. Rockford et al.
and Kim et al.
also found that the influence of the surface pattern on the lamellar ordering and orientation of adsorbed polymers is strongly dependent on the de-gree of commensurability between the polymer length and the stripe widths. Yang et al. found that when the width of the surface pattern is much greater than the bulk lamellar period of the block copolymer then the lamellae orient parallel to the surface and replicate the underlying substrate pattern into the bulk. However, when the width of the surface pattern is commensu-rate with the bulk lamellar period of the block copolymer, the lamellae orient perpendicular to the substrate. Heier et al.
investigated the behavior of symmetric poly(styrene-2-vinylpyridine) (PS-PVP) block copolymer thin films on patterned substrates formed using microcontact printing that had alternating stripes of
and
terminated self-assembled monolayers (SAMs). They found that the energy required to form islands of PS-PVP is different for each surface stripe. Since the
terminated SAM domains are energetically more favorable for the for-mation of islands than the
terminated SAM domains are, PS-PVP forms islands over the
terminated SAM domains.
In addition to the experimental work mentioned above, theory and simulation have been used to shed light on the organization of block copolymer bulk on patterned surfaces–
. Pe-tera et al. used mean-field theory
and self-consistent field theory
, the surface pattern period and the lamellar period are commensurate and the lamellae align perpendicular to the surface. Genzer used a 3D self-consistent field model to investigate the adsorption of copolymers from a copolymer-homopolymer mixture – onto a heterogeneous surface composed of two chemically-different regions arranged either in checker-board or random patterns. He demonstrated that if heteropolymers recognize the patterns on the heterogeneous surface, they can transcribe the pattern from the surface into three dimen-sions. Semler and Genzer used the bond fluctuation model and Monte Carlo simulations to study the effect of domain size
and interaction potential
on adsorption of diblock and alternating copolymers on chemically heterogeneous surfaces. The block copolymers recognize the surface pattern and transfer it to the bulk if the size of the adsorbing surface domain is commensurate with the parallel component of the radius of gyration of the block copolymers. The alternating copolymers recognize chemical patterns of sizes much smaller than , the radius of gyra-tion parallel to the surface of the copolymer. As the strength of attracgyra-tion between the block copolymer and surface increases, the extent to which the pattern is transferred to the bulk re-mains unaffected. As the strength of attraction between the alternating copolymer and surface increases, the pattern transferred into the bulk at increasing distances from the surface resembles an inverted surface pattern. Jayaraman et al. developed a simulation method recently to design surfaces for recognizing specific monomer sequences in copolymers
that when copolymers made of short blocks adsorb on heterogeneous surfaces, marked pattern recognition is possible at high polymer/surface attraction
.
All of the work done so far has dealt with understanding how the pattern on the heteroge-neous surface gets recognized and propagates through the copolymer film. Here we attempt to understand how a pattern applied in the copolymer film at a certain distance from the surface propagates through the adsorbed film onto the adsorbing heterogeneous surface. Ultimately we intend to determine what surface pattern is required to induce a desired pattern in the adsorbed polymer film.
We use lattice Monte Carlo simulations to explore how the length of the diblock copolymer, size of the patterns (checkerboard) and the distance from the surface where the pattern originally exists affect the extent of pattern transfer through the adsorbed layers to the surface. A study of how a diblock copolymer film transfers patterns with sizes on the order of the copolymer length scale through the adsorbed layers could help us to understand how to form unique nanoscale structures which in turn would be useful in nanolithography and the development of photonic devices
.
consider an attractive potential between like copolymer segments (A-A and B-B) and an attrac-tive potential between the surface sites and copolymer segments (A-1 and B-2). These potentials favor the transfer of the target pattern through the different adsorbed layers to the surface and help the surface to adopt a pattern commensurate to the target pattern. The more the surface resembles the target pattern, the higher the extent of pattern transfer through the adsorbed layers. We study three different chain lengths (12, 18 and 24) and three different pattern sizes (checker-board pattern of sizes 6x6, 12x12, and 24x24). The pattern is applied at three different distances from the surface (
and ). We also compare each of these systems with the case when no pattern is applied while all other parameters are maintained the same. When no pattern is ap-plied in the adsorbed layers, the copolymer chains are free to attain their natural conformations. We do this comparison to understand why a certain pattern size gets transferred to the surface better than the other patterns.
The first section of this paper introduces the simulation technique. The second section describes the application of this method to a system of block copolymers to learn how variations in copolymer chain length, target pattern size, and distance from the surface at which the pattern is applied affect the extent of pattern transfer from the bulk to the surface. A brief summary of our conclusions is given in the last section.
2.2
Model and Methods
2.2.1 Simulation Technique
We use lattice Monte Carlo (MC) simulation, which has the advantage that it is computa-tionally fast and yet provides a good description of the large scale conformational features of polymer chains. Each MC simulation is performed on a cubic lattice in the NVT ensemble, i.e. the total number of monomers in the simulation box, the volume of the simulation box, and the temperature of the system are fixed. The simulation box has periodic boundary conditions in the x and y directions. The dimensions of the simulation box in the x, y, and z directions are 48, 48, and 12, respectively. In the z direction, there is an athermal surface at z=13 and an adsorbing surface at z=0.
A system of symmetric diblock copolymers is in contact with a heterogeneous surface lo-cated at z=0. The diblock copolymers contain two types of segments: A and B. The AB diblock copolymer chains are modeled as self-avoiding walks on a cubic lattice. The surface contains two types of sites, 1 and 2. The values of the segment-segment interaction potentials,
and , and the segment-surface interaction potential,
and , are assigned such that
are zero. Attractive segment-surface interactions, and , cause the chains to adsorb on the surface. Attractive segment-segment interactions, and , cause the adsorbed chains to pull other chains towards themselves leading to dense adsorbed layers near the surface. The segment-segment interaction potential is short ranged; it only affects non-bonded nearest neigh-bors. The segment-surface interaction potential is also short ranged, acting only between the sites on the adsorbing surface (z=0 plane) and the segments that are on the plane adjacent to the adsorbing surface (z=1 plane).
The volume fraction, , of the AB diblock copolymer segments in the simulation box is 0.35. The interaction potentials are taken to be = = -1.33 kT and
= = -0.6 kT. These interaction potentials were chosen to be strong enough to cause the chains to adsorb onto the surface yet weak enough to avoid ordering or segregation of adsorbed chains. Having strong interaction between the copolymer segments and the surface helps the copolymer chains to overcome the entropic penalty associated with coil formation during adsorption.
We design the surface by interchanging the positions of the surface sites over the course of the simulation. This is accomplished by generating moves that switch the identity of the different sites on the surface in response to a target function that specifies the target pattern at a particular layer in the bulk. The target patterns in this paper are checkerboards of alternating regions of segments of type A and type B. In addition to the surface site switches, we move the segments on the chain using the standard chain moves: kink jump (25%), crankshaft (25%), and reptation (50%). The type of move, chain and segment number along the chain are all picked randomly. In one Monte Carlo step (MC step) we make x
trials, where
is the number of chains in the simulation box and
chain. The acceptance criterion for the chain moves and the surface site switches are based on a modified Metropolis algorithm derived from reverse Monte Carlo acceptance criterion –
. The chain moves or site switches are accepted with a probability
given by (2.1)
where the subscript signifies the present state of the system, the subscript
signifies the new state of system after the chain move or site switch has been attempted,
is the energy of the system, is the deviation from the target pattern (defined below), is the temperature of the system, and is an effective temperature that is used to weight the importance of target function fitting versus energy minimization. The energy,
, is calculated by summing up all of the non-bonded segment-segment and segment-surface interactions. The deviation from the target pattern, , is calculated according to
! #" %$'& )( (2.2) where& )(
if the type of segment (A or B) present at (x,y) during the simulation does not match the type of segment at (x,y) in the target pattern, and 0 otherwise, and
is the area of the plane. The value of &
)(
is calculated only for the layer,
, where the target pattern is applied. The summation on&
)(
is over all the (x,y) coordinates in layer
and is a measure of how well layer
resembles the target pattern. We divide the summation by the area of the plane,
, to scale the deviation between 0 (no deviation) and 1 (maximum deviation). Thus the term
*
deviation from the target pattern. In our simulations, we choose
in order to weigh the energy minimization term 10 times more than the target function fitting term, as the energy minimization term has a magnitude of the order of
and the target fitting term has a value of the order of magnitude
. When no target pattern is applied, the term denoting the deviation from target pattern, , is always zero. In that case, the acceptance criterion depends only on energy minimization and is given by
(2.3)
The simulation proceeds in the following manner. For convenience, the initial configuration of the surface is an alternating sequence of 1 and 2 sites. The initial configuration of the chains is obtained by first placing ”head” segments for all chains on random locations on the lattice. The second segments are placed on sites adjacent to the ”head” segment on each of the chains, one by one. The third segments are placed on sites next to the second segment, one at a time, and this is repeated till the chains are all grown to the desired length. During this process, if there is no vacant site for adding a segment onto one end of the chain, the segment is added to the other end of the chain. If adding the segment to either end fails (because there is no vacant site), then the chains are moved in the box (using reptation, kink jump, crankshaft moves) until a vacancy next to the chain in question is created.
stage helps us avoid any bias that might arise due to the nature of the initial configuration of the chains. In the equilibration stage, the segment-segment and segment-surface interactions are switched on, the target pattern is applied at the specified distance from the surface and the chain segments are subjected to the usual assortment of moves with the site switches still turned off. During this stage a fraction of the polymers adsorb on the initial surface. Once the fraction of adsorbed segments reaches a certain value (2% of the segments in the system are adsorbed), the ”production” stage or ”design” stage starts. In the production stage the system goes through 8 million MC steps, during which the standard chain moves are made, the target pattern is still applied at the specified distance from the surface and the sites 1 and 2 are subjected to identity switches. We obtain data every 1000 MC steps and calculate the averages of the properties described in the next section. We take averages obtained from 10 trials and compute the standard deviations. At the end of the simulation we analyze the pattern of sites 1 and 2 on the designed surface to determine the extent to which the pattern has been transferred from the adsorbed layers to the surface.
2.2.2 Adsorption features
To characterize the adsorption process, we monitor various properties of the system as a function of the number of MC steps. These include the extent of adsorption, as measured by the number of adsorbed segments of type A and B, and the conformation of the chains near the surface during the adsorption process. The conformations of the adsorbed chains can be inferred from a contour plot depicting , the fraction of segments along the chain that are adsorbed (segments lying on the
layer) and
, the ratio of the number of adsorbed segments on top of type 1 sites to the total number of adsorbed segments. An example of such a contour plot is given in figure 2.1. The plot in figure 2.1a represents a system where most of the chains are adsorbed either in a flat conformation or in a loop conformation. The plot in figure 2.1b depicts a situation where most of the chains are adsorbed in brush conformations. The rationale for this identification is the following. If a large fraction of chains are adsorbed in loop conformations, most of the segments will be extended from the surface with only a few segments lying in the z=1 layer, implying that ; due to symmetry of the copolymers, equal numbers of adsorbed segments will lie on top of type 1 and type 2 sites, implying that
(region I in figure 2.1a). If a large fraction of chains is adsorbed in flat conformations, most of the segments will lie in the z=1 layer, implying that
; due to the symmetry of the diblock copolymers, equal numbers of adsorbed segments will lie on top of type 1 and type 2 sites, implying that
= 0.5 (region II in figure 2.1a). If a large fraction of chains is adsorbed in brush conformations, a small section of each chain (all of the same segment type) will be adsorbed on the surface ( ) and the adsorbing segments of types A and B will likely adsorb on their preferred sites (since the segment-surface interactions and are attractive) making
2.1b) or
(region IV in figure 2.1b).
2.2.3 Calculation of the extent of pattern transfer
In order to quantify the extent of pattern transfer we introduce a pattern transfer parameter, PTP – . The PTP of the copolymer at height z from the surface is defined as
(2.4) ! #" $ )( " $ )( #" $ )( #" %$
)( (2.5)
#" $ )( #" $ )( #" %$ )( #" $
)( (2.6)
where )( and )(
are the x,y coordinates of the A and B segments, respectively, in the layer at which the target pattern is applied, and
)( and
)(
are the average volume fraction of segments A and B, respectively, at position (x,y,z). In equation 2.5 the first term in the numerator is the sum of the volume fractions of A segments in the z plane, whose (x,y) positions are the same as the positions of the A segments in the layer,
, where the target pattern is applied. The second term in the numerator represents the sum of the volume fractions of A segments, whose positions are different from the positions of the A segments in the layer
. In equation 2.6 the first term in the numerator is the sum of the volume fractions of B segments in the z plane, whose positions are the same as the positions of the B segments in the layer
. The second term in the numerator stands for the sum of the volume fractions of B segments in the z plane whose positions are different from the positions of the B segments in the layer
. The larger the value of the first terms in
and
match between the pattern on layer z and layer
. The larger the value of the second terms in
and
, the greater the mismatch between the pattern on layer z and layer . Thus the numerators of
and
express how well the pattern formed by A and B segments, respectively, at a certain z layer resembles the pattern formed in the layer
. The denominator is the sum of the volume fractions of all the A and B segments in layer z. The value of PTP ranges between -1 (complete negative pattern transfer) and 1 (complete positive pattern transfer).
When we apply the pattern at
, we calculate the PTP at all layers below
to the sur-face. For example, when the pattern is applied at
we calculate PTP(z=0), PTP(z=1) and PTP(z=2) and, by doing so, we can observe the pattern transfer through the adsorbed layers.
2.3
Results and Discussion
When a target pattern is applied, the extent of pattern transfer is expected to be affected by the length of the copolymers, the distance from the surface where the target pattern is applied, and the size of the target pattern. In this section, we present and discuss the results from our simulations, showing the effect of variation in each of these parameters on the extent of pattern transfer. We consider chains of length 12, 18, and 24; checkerboard patterns with sizes 6x6, 12x12, and 24x24; and target patterns at distances from the surface of
,
and
pattern is applied, compares with the energy of the system when no pattern is applied. After the target pattern is transferred to the surface and the surface pattern is designed, we adsorb a new copolymer film in a random configuration (with the same chain length and interaction potentials) onto the designed surface to test if the designed surface can transfer the pattern back through the adsorbed layers, inducing the target pattern at the desired distance from the surface.
2.3.1 Pattern transfer for different chain lengths
In figure 2.2 we plot the PTP as a function of distance z from the surface for chain length 12 when the pattern is applied at (a)
, (b)
, (c)
for different pattern sizes (6x6, 12x12, 24x24). When the target pattern is applied at
, the layer adjacent to the surface (figure 2.2a), the PTP(z=0) is approximately 0.46 for all the pattern sizes indicating that the pattern sizes do not affect the extent of pattern transfer in this case. When the target pattern is applied at
(figure 2.2b), the PTP(z=0) for the 6x6 pattern is 0.24 while the PTPs(z=0) for patterns 12x12 and 24x24 are 0.19 and 0.18, respectively, revealing that the 6x6 pattern is transferred to the surface with higher fidelity than the 12x12 and 24x24 patterns. When the target pattern is applied at
(figure 2.2c) the PTPs(z=0) indicate that the 6x6 pattern (0.10) is transferred to the surface better than the 12x12 (0.04) and 24x24 (0.03) patterns. The differences in the PTP values for the various patterns is significant since the error bars for all the PTP values discussed in this paper were of the order of 0.001. The PTPs(z=0) for all chain lengths and pattern sizes are also tabulated in table 2.1.
For chain length 12, when the pattern is applied at
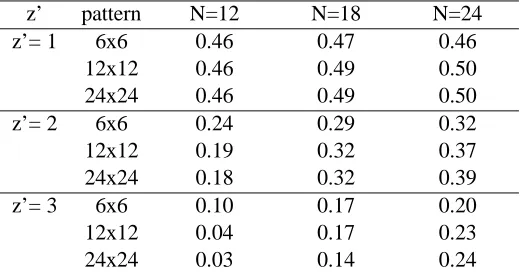
Table 2.1: Pattern transfer parameter PTP(z=0) for different chain lengths and pattern sizes.
z’ pattern N=12 N=18 N=24
z’= 1 6x6 0.46 0.47 0.46
12x12 0.46 0.49 0.50
24x24 0.46 0.49 0.50
z’= 2 6x6 0.24 0.29 0.32
12x12 0.19 0.32 0.37
24x24 0.18 0.32 0.39
z’= 3 6x6 0.10 0.17 0.20
12x12 0.04 0.17 0.23
24x24 0.03 0.14 0.24
difference,
, between the equilibrium energy per segment, when a target pattern is applied and that when no target pattern is applied, keeping all of the parameters the same. The filled black circles in figure 2.3a show that at
the
for the 6x6 pattern (0.00396 kT), the 12x12 pattern (0.0072 kT), and the 24x24 pattern (0.0094 kT) are all less than 0.01 kT. This means that when the target pattern is applied at
regardless of the pattern size, the energy of the system is close to the case when no pattern is applied. In other words, we do not have to force the chains into unfavorable conformations when we apply a target pattern at
for this chain length. When the pattern is applied at
or
, the 6x6 pattern is transferred to the surface better than the 12x12 and 24x24 patterns. This is because the
for the 6x6 pattern is lower than the
for the 12x12 and 24x24 patterns (figure 2.3a). This means that when the 12x12 pattern and 24x24 pattern are applied at
or
, the chains are forced to be in unfavorable conformations and the energy is high relative to the case when no target pattern is applied. The chains try to resist these unfavorable conformations and the pattern transfer is reduced.
Thus in the case of chain length 12, for all
length 12 adsorb in favorable conformations and maintain the energy of the system close to the energy of the system when no pattern is applied. When the 12x12 and 24x24 patterns are applied we force the copolymer chains to adopt conformations that increase the energy; the chains resist those conformations and in turn reduce the pattern transfer.
For chain length 18, when the pattern is applied at
or
, the 12x12 and 24x24 patterns are transferred to the surface slightly better than the 6x6 pattern (table 2.1). When the target pattern is applied at
, the 6x6 and 12x12 patterns are transferred to the surface better than the 24x24 pattern (table 2.1). For
, the 12x12 and 24x24 patterns are transferred to the surface better than the 6x6 pattern because the
for the 12x12 pattern (0.018 kT) and the 24x24 pattern (0.009 kT) are lower than the
for the 6x6 (0.038 kT) pattern (circles in figure 2.3b). This means that the 12x12 and 24x24 patterns help the chains form conformations that bring the energy of the system close to the energy when no pattern is applied. Contour plots, such as the ones in figure 2.4, help us to understand the conformations that the adsorbed chains adopt. As mentioned previously in section 2.2.2, the conformations of the adsorbed chains are deduced from , the fraction of segments along the chain that are adsorbed and
, the ratio of the number of adsorbed segments on top of type 1 sites to the total number of adsorbed segments. When a large fraction of chains adsorb in loop conformations, and
. When a large fraction of chains adsorb in flat conformations,
and
= 0.5. When a large fraction of chains adsorb in brush conformations, and
or
. For clarity, data from such contour plots are tabulated in table 2.2 which shows the conformations of the adsorbed chains for all the chain lengths and all pattern sizes applied at
,
and
Table 2.2: Fraction of chains in the system adsorbed in different conformations
z’ pattern N=12 N=18 N=24
Flat Loop Brush Flat Loop Brush Flat Loop Brush z’ = 1 6x6 0.09 0.09 0.04 0.05 0.14 0.20 0.06 0.25 0.19
12x12 0.08 0.09 0.09 0.06 0.11 0.23 0.06 0.22 0.19 24x24 0.06 0.09 0.13 0.04 0.09 0.36 0.04 0.15 0.38 z’ = 2 6x6 0.10 0.09 0.03 0.07 0.12 0.22 0.07 0.22 0.18 12x12 0.10 0.08 0.03 0.06 0.11 0.25 0.07 0.21 0.29 24x24 0.09 0.07 0.05 0.05 0.09 0.30 0.05 0.16 0.41 z’ = 3 6x6 0.10 0.08 0.04 0.07 0.12 0.22 0.07 0.22 0.17 12x12 0.10 0.08 0.05 0.07 0.11 0.21 0.07 0.21 0.18 24x24 0.10 0.09 0.03 0.07 0.11 0.19 0.07 0.19 0.31 no pattern 0.09 0.07 0.04 0.07 0.14 0.23 0.07 0.21 0.19
For chain length 18 and
, comparison of the adsorbed chain conformations with those when no pattern is applied can tell us why the 12x12 and 24x24 patterns get transferred to the surface better than the 6x6 pattern. When no pattern is applied for chain length 18 the chains adsorb in conformations similar to the case when the 6x6 pattern and the 12x12 pattern are applied at
(table 2.2). However, for the 6x6 pattern and ,
is not low even though the conformations are similar to those when no pattern is applied (figure 2.3b). On the other hand for the 24x24 pattern and
is very low, although the conformations are different from those when no pattern is applied. Thus it is clear that there can be many conformations of the adsorbed chains leading to a
close to the
when no pattern is applied.
For
, the 12x12 and 24x24 patterns are transferred to the surface better than the 6x6 pattern because the
for the 12x12 (0.020kT) and 24x24 (0.015 kT) patterns are lower than the
for the 6x6 (0.043 kT) pattern (squares in figure 2.3b). The conformations of the adsorbed chains when no pattern is applied for chain length 18 is similar to the case when the 6x6 pattern is applied at
(table 2.2), but the
for
, the conformations of the adsorbed chains for the pattern that has the lowest value of
are not similar to the conformations of the adsorbed chains when no pattern is applied. For
the
for the 6x6 (0.038kT) and the 12x12 (0.032kT) patterns are lower than the
for the 24x24 (0.039kT) pattern (triangles in figure 2.3b). The conformations of the adsorbed chains of chain length 18 when no pattern is applied (table 2.2) are similar to the cases when the 6x6 and the 12x12 patterns are applied at
(table 2.2), and the
for the 6x6 and the 12x12 patterns are the lowest. Thus the conformations of the adsorbed chains for the pattern that has the lowest
are similar to the conformations of the adsorbed chains when no pattern is applied. However since the same trend was not observed for
and
cases we cannot conclusively relate the
and the conformations.
Thus in the case of chain length 18, the patterns that have low
get transferred to the surface better. In order to achieve a low
the conformations of the adsorbed chains do not necessarily have to match the case when no pattern is applied.
For the longest chains (chain length 24) when the target pattern is applied at , the 12x12 and 24x24 patterns are transferred to the surface better than the 6x6 pattern (table 2.1). For
or
, the 24x24 pattern is transferred to the surface better than the 6x6 and the 12x12 patterns (table 2.1). Analysis of the data in tables 2.1 and 2.2 and figure 2.3c similar to those described above for the chain length 12 and 18 cases reveals the following trends. For chain length 24, when the 12x12 pattern is applied at
and
and when the 6x6 pattern is applied at
the chains adsorb in conformations similar to the no-pattern case. However for all three cases,
,
, and
similar to the no-pattern case, the energy of the system can be maintained close to the energy when no pattern is imposed.
2.3.2 Pattern transfer for different pattern sizes
When the 6x6 pattern is applied at
, the PTPs(z=0) are almost equal for all chain lengths (table 2.1), implying that the 6x6 pattern is transferred well, regardless of the chain length. When the 6x6 pattern is applied at
and
, the pattern transfer to the surface improves as chain length increases. This is because longer chains have a higher fraction of adsorbing chains forming loop and brush conformations than the shorter chains (table 2.2). When the adsorbing chains form loops, a part of the chain extends to
layers and thus bridges the pattern between the different layers. In order to transfer the pattern well between the layers we need to maintain a connectivity between the different layers. Therefore the systems with chains of length 24, which have a higher fraction of chains adsorbing in loop and brush conformations, transfer the patterns to the surface better than the systems with chain lengths 12 and 18.
When the 12x12 pattern is applied at
,
or
, the values of the the PTPs(z=0) in table 2.1 reveal that the 12x12 pattern gets transferred to the surface best for chain length 24. When the 24x24 pattern is applied at
, the PTP(z=0) is higher for chain length 24 and chain length 18 than for chain length 12 (table 2.1). For
and
2.3.3 Copolymer bulk adsorbed on the designed surfaces
So far, we have picked a target pattern, biased the adsorbed copolymer film to adopt that target pattern at a desired distance from the surface, let the pattern be transferred through the adsorbed layers to the surface, and designed the surface in response to the target pattern. The next question to be asked is the following: If a bulk of copolymers in a random configuration is placed on the designed surface, can the designed surface induce the target pattern in the adsorbing layers? Answering these questions will also reveal if we can determine beforehand what pattern must be present on the surface to induce adsorbing copolymer layers to attain a target pattern at a certain distance from the surface.
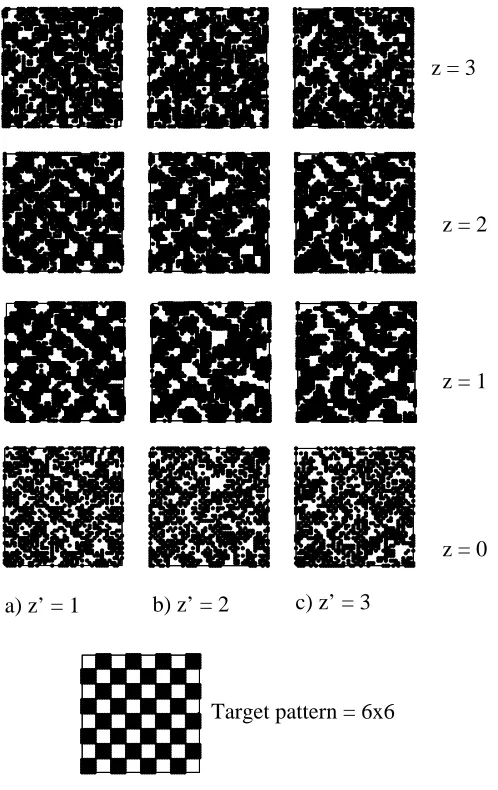
In order to answer the questions posed above, we allow the designed surfaces obtained in each of the cases discussed in the previous section to adsorb AB diblock copolymer bulk initially in random configurations. We term this ’the test stage’. Our purpose here is to test if the designed surfaces can induce the target pattern that was used originally to form the surface pattern. Figure 2.5 shows how the AB copolymer chains of length 12 respond to the surfaces designed for an AB copolymer film of chain length 12 when the 6x6 target pattern has been applied at a)
, b)
and c)
. The designed surface patterns at
we force the chains to adopt conformations that will help fit the target pattern, which does not correspond to their natural conformation. When there is no bias and the copolymer chains adsorb on the designed surface, they are free to have conformations close to their natural conformations and therefore do not form the target pattern we wanted them to attain.
To ensure that the results above were not an artifact resulting from the low value of weight-ing factor
used in equation 2.2 to weight the energy minimization term versus the target function fitting term, we run all the above simulations for all chain lengths and all pat-tern sizes at two other values of the weighting factor : 0.0001 and 0.00001. When
, the weighting factor used in the results shown so far, the target function fitting term is weighted 1/10 the energy minimization term in the acceptance criterion. When
and
the target function fitting term is weighted equal to and 10 times the energy minimization term, respectively, in the acceptance criterion. Figures 2.6 and 2.7 show how the AB copolymer chains of length 12 respond to the surfaces designed for an AB copolymer film of chain length 12 when the 6x6 target pattern has been applied at a)
, b)
and c)
using values of weighting factors
and
. In both cases we see that the target pattern is not induced in the copolymer bulk. This implies that irrespective of the weighting factor while designing the surface pattern, we do not induce the target pattern in the bulk.
In order to compare the system at the test stage to the system during the design, we show the designed surfaces (
) and the patterns observed in the bulk at
during the design stage when the 6x6 pattern is applied in a bulk of diblock copolymers of chain length 12 at a)
, b)
, c)
with
Table 2.3: Average equilibrium
for different chain lengths and pattern sizes 1. during surface design, and 2. in test stage
(1) (2)
z’ pattern N=12 N=18 N=24 N=12 N=18 N=24
z’= 1 6x6 0.0041 0.0384 0.0486 0.0061 0.0025 0.0028
12x12 0.0073 0.0175 0.0206 0.0013 0.0120 0.0150
24x24 0.0094 0.0089 0.0139 0.0044 0.0089 0.0014
z’= 2 6x6 0.0088 0.0427 0.0478 0.0016 0.0220 0.0190
12x12 0.0263 0.0196 0.0195 0.0077 0.0042 0.0190
24x24 0.0327 0.0152 0.0114 0.0015 0.0041 0.0150
z’= 3 6x6 0.0148 0.0384 0.0389 0.0014 0.0053 0.0089
12x12 0.0282 0.0315 0.0297 0.0016 0.0087 0.0097
24x24 0.0278 0.0390 0.0083 0.0012 0.0096 0.0082
the
layer of the bulk during the surface design when a pattern is applied at
(Fig.2.8) is not the same as the pattern obtained in the
layer of the bulk during the test stage (case
in Fig. 2.7).
In table 2.3 we tabulate the average equilibrium
for the chains in the system: (1) during surface design i.e. when the target pattern is applied at
and the surface reorganizes itself in response to the target pattern, and (2) in the test stage, i.e. after the new copolymer bulk has been adsorbed and equilibrated on the designed surface. The data in part (1) of table 2.3 is the same as the data plotted in figure 2.3, i.e. during surface design when the target pattern is applied at
with
. In part (2) of table 2.3, the cases where the
values are smaller than the corresponding
and therefore do not induce the target pattern in the adsorbed layers.
2.4
Summary
We performed lattice Monte Carlo simulations to study how symmetric diblock copolymers transfer a pattern through the adsorbed layers to the surface. We applied a target pattern in the copolymer film at a certain height above the surface, performed chain moves to maintain the target pattern and allowed the surface to rearrange itself in response to the target pattern. The attractive interactions between the copolymer segments and surface ( and ) and the attractive interactions between the like segments of the copolymer (
and ) enabled the surface to rearrange, forming a pattern similar to the target pattern. We varied the chain length, pattern size and the height above the surface (
) where the pattern was applied to study their effect on pattern transfer.
For constant chain length, the pattern that brings the energy of the system close to the energy when no pattern is applied is transferred to the surface the best. For the pattern that is transferred the best, the conformations of the adsorbed chains are not necessarily the same as when no pattern is applied. This shows that there can be many conformations that can bring the energy of the system close to that when no pattern is applied. For constant pattern size, increasing the chain length results in an increase in the extent of pattern transfer to the surface. This is because longer chains are able to adsorb in the form of brushes and loops that help transfer the pattern between adsorbed layers down to the surface.
all the cases the surface pattern was not induced back into the adsorbed layers. This is because the target pattern we applied in the bulk when designing the surfaces did not let the chains attain energy close to that of their natural conformations.
2.5
Acknowledgements
2.6
References
[1] S. Walheim, E. Schaffer, J. Mlynek, and U. Steiner, “Nanophase-separated polymer films as high performance antireflection coatings,” Science 283, 520 (1999).
[2] R. J. Todd, R. D. Johnson, and F. H. Arnold, “Multiple-site binding interactions in metal-affinity chromatography .1. Equilibrium binding of engineered histidine-containing cytochrome-C,” J. Chromatography A. 662, 13 (1994).
[3] T. L. Morkved et al., “Local control of microdomain orientation in diblock copolymer thin films with electric fields,” Science 273, 931 (1996).
[4] I. Norde, Surface and interfacial aspects of biomedical applications (Plenum, New York, 1995).
[5] R. F. Service, “Biotechnology: designer tissue take hold,” Science 270, 230 (1995).
[6] J. K. Cox, A. Eisenberg, and R. B. Lennox, “Pattern surfaces via self-assembly,” Curr.
Opin. Colloid. In. 4, 52 (1999).
[7] M. J. Fasolka and A. M. Mayes, “Block copolymer thin films : physics and applications,”
Annu. Rev. Mater. Res. 31, 323 (2001).
[8] L. Rockford et al., “Polymers on nanoperiodic, heterogeneous surfaces,” Phys. Rev. Lett.
82, 2602 (1999).
[10] S. O. Kim et al., “Epitaxial self-assembly of block copolymers on lithographically defined nanopatterned substrates,” Nature 424, 411 (2003).
[11] X. M. Yang et al., “Guided self-assembly of symmetric diblock copolymers films on chem-ically nanopatterned substrates,” Macromolecules 33, 9575 (2000).
[12] J. Heier et al., “Transfer of a chemical substrate pattern into an island-forming diblock copolymer film,” J. Chem. Phys. 111, 11101 (1999).
[13] D. Petera and M. Muthukumar, “Effect of patterned surface on diblock-copolymer melts and polymer blends near the critical point,” J. Chem. Phys. 107, 9640 (1997).
[14] D. Petera and M. Muthukumar, “Self-consistent field theort of diblock-copolymer melts at patterned surfaces,” J. Chem. Phys. 109, 5101 (1998).
[15] J. Genzer, “Copolymer adsorption at planar chemically heterogeneous substrates: The in-terplay between the monomer sequence distribution and interaction energies,” Macromol.
Theory Simul. 11, 481 (2002).
[16] J. Genzer, “Copolymer adsorption on planar substrates with a random distribution of chem-ical heterogeneities,” J. Chem. Phys. 115, 4873 (2001).
[17] J. Genzer, “Copolymer-assisted generation of three-dimensional patterns by replicating two-dimensional substrate motifs,” Phys. Rev. E 63, 022601 (2001).
[19] J. J. Semler and J. Genzer, “Monte Carlo simulations of copolymer adsorption at planar chemically patterned surfaces: Effect of interfacial interaction,” Macromol. Theory Simul.
13, 219 (2004).
[20] A. Jayaraman, C. K. Hall, and J. Genzer, “Designing pattern-recognition surfaces for selec-tive adsorption of copolymer sequences using lattice Monte Carlo simulation,” Phys. Rev.
Lett. 94, 078103 (2005).
[21] Y. A. Kriksin, P. G. Khalatur, and A. R. Khokhlov, “Adsorption of multiblock copolymers onto a chemically heterogeneous surface: A model of pattern recognition,” J. Chem. Phys.
122, 114703 (2005).
[22] H. Chen and A. Chakrabarti, “Morphology of thin block copolymer films on chemically patterned surfaces,” J. Chem. Phys. 108, 6897 (1998).
[23] C. Seok, K. F. Freed, and I. Szleifer, “Polymer blends near patterned surfaces,” J. Chem.
Phys. 112, 6452 (2000).
[24] C. Seok, K. F. Freed, and I. Szleifer, “Polymer melts and polymer solutions near patterned surfaces,” J. Chem. Phys. 112, 6443 (2000).
[25] K. T. Thomson and K. E. Gubbins, “Modelling structural morphology of microporous car-bons by reverse Monte Carlo,” Langmuir 16, 5761 (2000).
2.7
Figures
Page
2.1 Contour plots for loop conformation (I), flat conformation (II), and brush confor-mations (III and IV). denotes the fraction of chain length adsorbed.
denotes the ratio of the number of adsorbed segments on type 1 sites over total num-ber of adsorbed segments. The contour plots show the fraction of chains in the simulation box with the characteristics and
. The values of the fractions are indicated by the colors shown in the key. . . 39 2.2 Pattern transfer parameter, PTP(z), for chain length = 12, as a function of the
distance from the surface, z, for different target patterns: 6x6 (solid line), 12x12 (dashed line), and 24x24 (dotted line) applied at a)
, b)
c) . 40
2.3 The difference,
, between the system internal energy when the target pattern is applied and when no target pattern is applied for different target pattern sizes at chain lengths a) 12, b) 18, c) 24. The circles represent
, squares represent
, and triangles represent
. The lines are drawn as a guide to the eye. 41 2.4 Contour plot for chain length 18, showing, , the fraction of chain length
ad-sorbed and
2.5 The designed surfaces (
) when the 6x6 pattern is applied at a)
, b)
, c)
with
. The 6x6 target pattern is shown for comparison. Also shown are the patterns observed in the bulk at
when diblock copolymers of chain length 12 are adsorbed on the designed surfaces. . 43 2.6 The designed surfaces (
) when the 6x6 pattern is applied at a) ,
b)
, c)
with
. The 6x6 target pattern is shown for comparison. Also shown are the patterns observed in the bulk at
when diblock copolymers of chain length 12 are adsorbed on the designed surfaces. . 44 2.7 The designed surfaces (
) when the 6x6 pattern is applied at a) , b)
, c)
with
. The 6x6 target pattern is shown for comparison. Also shown are the patterns observed in the bulk at
when diblock copolymers of chain length 12 are adsorbed on the designed surfaces. . 45 2.8 The designed surfaces (
) and the patterns observed in the bulk at when the 6x6 pattern is applied in a bulk of diblock copolymers of chain length 12 at a)
, b)
, c) with
I II
α β
I II
0.1 0.5
0.3 0.7
0.8 0.6 1 0.2 0.4
0.9
(a) Loop (I) and flat (II) conformations
IV III
0.1 0.3 0.5 0.7 0.9
0.2 0.4 0.6 0.8 1
IV III
β
α
(b) Brush (III and IV) conformations (c) Key
Figure 2.1: Contour plots for loop conformation (I), flat conformation (II), and brush confor-mations (III and IV). denotes the fraction of chain length adsorbed.
denotes the ratio of the number of adsorbed segments on type 1 sites over total number of adsorbed segments. The contour plots show the fraction of chains in the simulation box with the characteristics and


![Figure 3.2: The selectivity of the surfaces designed for copolymers a) [A� B� ], b) [A� B� ], c)[A� B� ], d) [A� B� ], e) [A� B� ], and f) [A�� B�� ] with set I (squares + solid line), set II (circles +dashed line), and set III (triangles + dotted line) interaction potentials .](https://thumb-us.123doks.com/thumbv2/123dok_us/1296788.1162257/81.612.142.497.101.382/figure-selectivity-surfaces-designed-copolymers-triangles-interaction-potentials.webp)
