ABSTRACT
YUHAN WANG. A Novel Method to Produce a Multi-components Wood Plastic Composite. (Under the direction of Dr. Joel J. Pawlak).
Wood is a natural polymeric composite material that people have been working on manipulating and mimicking its wonderful useful properties for hundreds of years. Artificial polymeric materials such as polyethylene (PE), polypropylene (PP), polystyrene (PS), have also been created with desirable properties. There are on-going efforts to combine artificial polymers and natural polymers (composed of wood fiber, lignin, fibril cellulose (MFC), and starch) together to maximize their useful properties and minimize their undesirable
properties. The resulting heterogeneous composite is called wood plastic composite (WPC). A mathematical model was first set up for understanding the theoretical relationship of mechanical properties between the plastic matrix and natural material. The model indicated that micro fibril cellulose (MFC) theatrically supposed to contribute the most to the
mechanical properties to WPC.
Two components, literature reported polyethylene and polypropylene based WPC were first extruded. Different weight percentage of different natural materials including hardwood fiber, softwood fiber and micro-fibrillated cellulose (MFC) were added into WPC with or without the addition of compatibilizer. Mechanical properties including tensile strength and tensile modulus were tested and compared. The thermal properties of the extruded WPC samples were determined with a thermogravimetric analysis (TGA) and a Pekin-Elmer Pyris-1 differential scanning calorimeter (DSC). The result showed that hardwood fiber is the most suitable natural material among the three candidates. The sample of 50 weight percent HW and 5 weight percent polypropylene grafted (MAPP) PP based WPC exhibited the best mechanical properties.
LDPE based WPC exhibited relatively lower mechanical properties. Due to the lower melting point, LDPE based WPC is more flexible, easier to process and possible for later multi-components extrusion.
LDPE-PSA based WPC was the upgraded version of LDPE based WPC, while a certain amount of corn starch was also added to the WPC. LDPE-PSA based WPC
by Yuhan Wang
A thesis submitted to the Graduate Faculty of North Carolina State University
in partial fulfillment of the requirements for the degree of
Master of Science
Forest Biomaterial
Raleigh, North Carolina 2016
APPROVED BY:
_______________________________ _______________________________ Dr. Joel J. Pawlak Dr. Richard A. Venditti
Committee Chair
_______________________________
DEDICATION
BIOGRAPHY
ACKNOWLEDGMENTS
I would like to thank to all the people that gives the assistance in this journey.
I would like to first give my appreciation to Dr. Joel J. Pawlak who provide me both financial and knowledge support in this project. Without his assistance, I could not finish this project.
I would also like to thank Dr. Venditti and Dr. Hubbe who constantly give me useful suggestion when I was struggling in this research.
TABLE OF CONTENTS
TABLE OF CONTENTS ... v
LIST OF TABLES ... vii
LIST OF FIGURES ... viii
Preface ... 1
Chapter 1 ... 4
Literature review. ... 4
1.1Common compatibilizers and chemical mechanisms inWPC ... 5
1.2 Surface treatment agent and other additives in WPC ... 11
1.3 Wood plastic composite molding process ... 17
1.4 Choices of matrix and natural content ... 19
Reference ... 24
Chapter 2 ... 29
Theoretical extrusion and foaming model for WPC ... 29
2.1 Introduction ... 30
2.2 Foam Model Results: ... 30
2.3 Scenario 1 – MFC Cellulose and Poly-propylene ... 33
2.4 Scenario 2 – Poly-propylene and Softwood Fiber ... 34
2.5 Scenario 3 – Ground Softwood and Poly-propylene ... 35
2.6 Conclusion. ... 36
Reference ... 37
Chapter 3 ... 38
Wood Plastic Composite extrusion with polyethylene as the matrix. ... 38
3.1 Introduction ... 39
3.2 Experimental Methods and Materials ... 39
3.3. Measurements ... 45
3.4 Results and discussion ... 46
3.5 Conclusion ... 52
Reference ... 54
Chapter 4 ... 55
WPC extrusion with polyethylene as the plastic matrix ... 55
4.1 Introduction ... 56
4.2 Experimental Methods and Materials ... 56
4.4 Results and discussion ... 58
4.5 Conclusion ... 60
Reference ... 61
Chapter 5 ... 62
Wood fiber, Low Density Polyethylene, Starch Composite Extrusion. ... 62
5.1 Introduction ... 63
5.2 Experimental Methods and Materials ... 63
5.3. Measurement ... 64
5.4 Results and discussion ... 66
5.5 Conclusion ... 72
Chapter 6 ... 74
Conclusion ... 74
Appendices ... 76
Appendix A- extrude PP based WPC with nanoclay. ... 77
Appendix B- extrude PP based WPC with starch. ... 81
LIST OF TABLES Chapter 3.
Table 1: Reference literature values for various materials of interest. ... 33 Table 2: Basic components properties of fibers used in modeling. ... 33 Appendix A.
LIST OF FIGURES Chapter 1
Figure 1. Maleic Anhydride (MAH) bonding mechanism (Lipponen, 2012). ... 5 Figure 2. I. Plot of tensile strength of starch and LDPE (25:100) blends versus the
concentration of PE-g-MA; II. Tensile strength of the HDPE /TPS blends with and without PE-g-MA as a function of TPS loading. (Liu, et.al., 2012) ... 6 Figure 3. I. Tensile strength of hard- and soft-wood-fiber–PP composites with and without
compatibilizer in both processes. II. Elongation at break of wood–fiber-PP composites. (Bledzki, 2004) ... 8 Figure 4. Coupling mechanism of m-TMI grafted polypropylene. (Lipponen, 2012). ... 9 Figure 5. The chemical structure of compatibilizers. (a) Lotader 2210 and (b) Lotader AX
8900 (Altun, 2012). ... 10 Figure 6. I. Interaction of silane with natural fibers by hydrolysis process. (Xie, et.al. 2004).
II. Flexural strengths of wood fiber composites as a function of wood fiber content with (a) different surface treatment methods and (b) different fiber lengths (Cui, et.al., 2008).
... 13 Figure 7. Tortuous pathway of a permeant in a clay nanocomposites (Turku, 2014) ... 14 Figure 8. I Stress-strain curve of HDPE : PP polymer blends. II. Stress-strain curve of LDPE
: PP polymer blends ... 20 Figure 9. Flexural strengths of wood fiber composites as a function of wood fiber content
Chapter 2
Figure 1: Fibrous composite model shows how the foam wall strength is determined from combination of the matrix and fiber. Foam structure model shows how the foam structure is approximated to determine density. Note that the space between cells is considered negligible in this model. ... 31 Figure 2: The elastic modulus and the density of a foam composite material with 0.52 relative volume (i.e. 0.48 void fraction). The composite material is made of poly-propylene and MFC. ... 34 Figure 3: The elastic modulus and the density of a foam composite material with 0.48 void
fraction. The composite material is made of poly-propylene and softwood fiber. ... 35 Figure 4: The elastic modulus and the density of a foam composite material with 0.48 void
fraction. The composite material is made of poly-propylene and ground softwood. .... 36
Chapter 3
Figure 1. a. Pulp disintegrator. b. Handsheet maker ... 40 Figure 2. a. Freeze dried SW sample; b. Thoroughly disintegrated SW sample. ... 42 Figure 3. a.Thoroughly disintegrated MFC sample, b. DSM Xplore twin-screw extruder. ... 44 Figure 4. The TGA curves for PP phase WPC ... 46 Figure 3. Tensile properties for PP based WPC. ... 48 Figure 4. Tensile properties for PP based WPC with MAPP addition ... 52
Chapter 4
Figure 1. The TGA curves for LDPE phase WPC ... 58 Figure 2. Tensile properties for LDPE based WPC. ... 59 Figure 3. (Left to right): 30 weight percent HW LDPE based WPC, 30 weight percent HW
Chapter 5
Figure 1. The TGA curves for LDPE –PSA based WPC ... 66
Figure 2. LDPE-PSA based WPC samples. (Left to Right): LDPE; 15% SA, 25% HW; 20% SA, 25%HW; 27% SA, 25% HW; 5% Glycerol. ... 67
3a. DSC curves for LDPE-HW. ... Error! Bookmark not defined. Figure 3. The TGA curves for LDPE phase WPC. ... 68
4A. Tensile Strength for LDPE-HW-PSA. ... 69
4b. Tensile Modulus for LDPE-HW-PSA. ... 69
4c. Tensile Strength for LDPE-HW-PSA (constant 25 weight percent HW) ... 70
4d. Tensile Modulus for LDPE-HW-PSA (constant 25 weight percent HW) ... 70
Figure 4. Tensile properties for LDPE-PSA based WPC. ... 70
Appendix A Figure 1. Mechanical properties of PP based WPC with Nanoclay. a, tensile properties with HW addition; b, tensile properties with SW addition; c, tensile properties with MFC addition. ... 79
Appendix C Figure 1. a. Pulp disintegrator. b. Handsheet maker ... 82
Figure 2. a. Freeze dried SW sample; b. Thoroughly disintegrated SW sample. ... 83
Figure 3. a.Thoroughly disintegrated MFC sample, b. DSM Xplore twin-screw extruder. ... 84
3a. TGA curves for LDPE-HW. ... 86
3b. TGA curves for LDPE-SW. ... 86
3c. TGA curves for LDPE-MFC. ... 87
4a. DSC curves for LDPE-HW. ... 87
4b. DSC curves for LDPE-SW. ... 88
4c. DSC curves for LDPE-MFC. ... 88
Figure 4. The TGA curves for LDPE phase WPC ... 88
5a. Tensile properties for LDPE-HW. ... 89
5b. Tensile properties for LDPE-SW. ... 90
5c. Tensile properties for LDPE-MFC. ... 91
Preface
Wood is a natural polymeric composite material that people have been working on manipulating and mimicking its wonderful useful properties for hundreds of years. Artificial polymeric materials such as polyethylene (PE), polypropylene (PP), polystyrene (PS), have also been created with desirable properties. There are on-going efforts to combine artificial polymers and natural polymers (composed of wood fiber, lignin, micro fibril cellulose (MFC), and starch) together to maximize their useful properties and minimize their undesirable properties. The resulting heterogeneous composite is called wood plastic composite (WPC). WPC can be categorized as either wood-based or plastic-based. Wood-based WPC was introduced in the early 1960s. To make wood-Wood-based WPC, wood is first immersed in solution containing monomers, heated and irradiated in order to initiate the polymerization and crosslink of the monomers from the solution with the wood. The
challenge of wood-based WPC is the trade-off between the improved properties and the cost, since the process requires huge amount of heat and energy input, and this makes the process less practical (Zhang, 2013). In the current marketplace, the most common artificial fiber board is the medium density fiber board (MDF). MDF production involves bonding small wood chips, referred to as fibers in the MDF industry, with urea-formaldehyde resin and wax to increase its strength and water resistance. MDF is cheaper, more flexible, and more stable in dimensions than its natural wood counterparts. However, the high density and unavoidable urea-formaldehyde content impede the utilization of MDF in the future. There are numerous reports of consumers getting cancers of inhaling formaldehyde released from their new decorated MDF flooring or furniture.
Comparing with MDF, WPC is a composite has a number of positive attributes. For example, it avoids the need for the urea-formaldehyde, can be formed with recycled or sustainable polymers, and can have a wider variety of characteristics. Manufacturing a WPC that is competitive in properties to MDF has three challenges: the price, strength and
stability. The manufacture of MDF is relatively mature now comparing with WPC.
very affordable product. It will take significant advances in manufacturing in material formulation for WPC to directly compete with the properties and cost of MDF.
The formaldehyde resins bonds the wood chips of MDF tightly together which make MDF relatively strong but also heavy. For making a green composite, WPC does not contain any organic resins. On the other hand, the defects in the WPC undermine the connection between the plastic matrix and natural wood fiber. As a result, the force transmission from the plastic matrix to the wood fiber is relatively poor. Therefore, WPC typically do not achieve the theoretical strength of the composite.
The ultimate goal of this project is create a WPC that has improved strength and
approaches the theoretical strength and modulus values for the composite. This will allow for the WPC to be used as a substitute for MDF. In order to improve the stress transfer from the matrix to the fibers, an agent is needed to bring the plastic matrix and natural content
together. This agent is so-called the compatibilizer. A literature review for the history of compatibilizer is first conducted in this thesis. The review of the choices of compatibilizer and their effects on different materials is useful to set a starting point of this project. In addition, a review of the process method and other additives for further enhancement of WPC is also conducted. Overall, the literature review provided extensive knowledge and understanding of the effects of compatibilizer and other reagents on the strength of wood plastic composite.
The project was broken down into three tasks. In the first task, a theoretical model was developed to create a general sense of relationship between the strength and the content of natural fibers and plastic matrix. Hardwood (HW) and softwood fiber (SW) are used as examples for natural contents. The model was under the assumption that there were no defection and force was transmitted completely and efficiently in WPC.
Chapter 1 Literature review.
1.1Common compatibilizers and chemical mechanisms inWPC
Combining natural polymer and artificial products together does not result in their physical properties being added together. It is similar of embedding an artificial limb into body which will cause incompatibility. Because of the heterogeneity between the two kinds of materials to be combined, the WPC is heterogeneous, and external mechanical forces cannot be transmitted well throughout the composite. The lack of bonding and interactions, under ordinary processing conditions and in the absence of chemical additions, result in deficient shear and friction between the wood particles. An adhesive is necessary to glue these two components together. The compatibilizer is then introduced, and it serves as the adhesive that improves the bonding between natural and artificial polymers. (Figure 1). The most widely used or studied compatibilizer is maleic anhydride (MAH) (Figure
1).(Lippomen, 2012) MAH is typically introduced in a grafted form, such that the MAH has already been reacted with polyethylene (PE) or polypropylene (PP) before its used in the manufacture of WPCs. This grafting process increased the miscibility between the MAH and the artificial PE phase. Once heat is applied, a ring-opening reaction will proceed, along with the hydroxyl groups on the natural polymer side. An ester bond will then form. In addition, the functional groups in MAH and starch will form intermolecular hydrogen bonding to
enhance the adhesion of wood and plastic.
There is typically a saturation point with respect to compatibilization. Before the
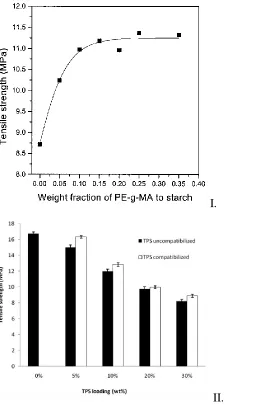
saturation point, the tensile strength will increase with the addition of MAH. After reaching the saturation point, the tensile strength will level off and the interfacial tension will hence reach its minimum point.(Lippomen, 2012) The saturation point varies with different natural polymers. For the case of corn starch, the saturation point of MAH is approximately 10% of starch weight for the blend of starch and low density PE (at a ratio of 25:100). Figure (2I)
I.
II.
Figure 2. I. Plot of tensile strength of starch and LDPE (25:100) blends versus the concentration of PE-g-MA; II. Tensile strength of the HDPE /TPS blends with and
The ratio between the filler and plastic is another key factor affecting the strength. As shown in Figure 2 II, increasing the starch content up to 30% results in a decrease of the tensile strength (Wang, 2003). This is due to the theory that large starch particle formation increased the stress-concentration, which will ultimately cause the reduction of tensile strength. (Kahar, 2012).
Similarly, this theory applies to wood fiber, where a content of 50 weight percent in the WPC reached the maximized tensile strength for the composite. One major trade-off about adding wood fiber is that an excessive amount of wood fiber will lead to less elongation, making a more brittle product. (Bledzki, 2004). (Figure 3)
II.
Figure 3. I. Tensile strength of hard- and soft-wood-fiber–PP composites with and without compatibilizer in both processes. II. Elongation at break of wood–fiber-PP composites.
(Bledzki, 2004)
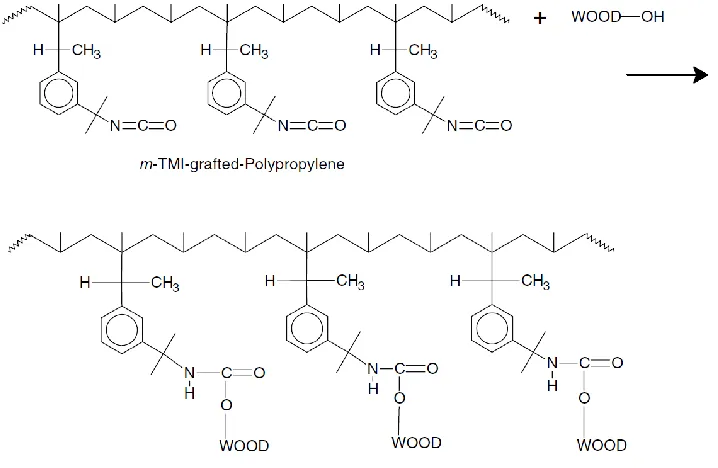
Other compatibilizers include ethylene-methacrylic acid, and 1-4 isocyanate. These compatibilizers are either highly toxic or highly selective to specific components. For
Figure 4. Coupling mechanism of m-TMI grafted polypropylene. (Lipponen, 2012).
As shown in Figure 1, the maleic anhydrite group is attached on the side chain of the polypropylene grafted MAH. On one hand, it is easy to manipulate and miscible with the plastic matrix. On the other hand, since the attachments are on the side chains, it is possible that polypropylene grafted MAH (MAPP) would be detached through high heat and shear force. Based on this limitation, Arkema Chemical (Colombes, Paris, France) invented a new compatibilizer called Lotader. Lotader terpolymers are reactive polyolefins and contain certain amount of MAH or glycidyl methacrylate. Comparing with grafted MAH, Lotader embeds the MAH group on the backbone of the terpolymers, which offers more effective support on extrusion and coating. (Figure 5)
weight percent Lotader AX 8900 increased the tensile strength from 21 MPa to 27.7 MPa and modulus from 0.64 GPa to 1.64 GPa.
Altun et al. compared the effects of two different types of Lotader compatibilizers on the strength of HDPE based WPC. The paper provided the structures of Lotader 2210 and Lotader AX 8900 (Figure 5).
Figure 5. The chemical structure of compatibilizers. (a) Lotader 2210 and (b) Lotader AX 8900 (Altun, 2012).
1.2 Surface treatment agent and other additives in WPC
Surface treatments for WPC Heat treatment
Due to the hydrophilic property of the natural content and hydrophobic nature of the matrix, fibers will clump and agglomerate during extrusion. As a result, fiber clumps become defects that locally reduce the strength of composite and force transmission in the system. This reduces the overall modulus and strength of the composite materials. In order to make Wood Plastic Composite (WPC) stronger, surface treatments are necessary. Heat treatment refers to preconditioning the wood fibers at high and moist environment. A common technique is to use hot steam (180 oC to 230 oC) to condition the fiber. Through heat and moisture, the hemicellulose is removed, crystallinity of cellulose is increased while the polymerization index is decreased. (Pelaez, 2013)
Andrusky et al. (2008) extruded conditioned wood flour (WR) with Poly- Propylene (PP). As a result, the tensile modulus was increased from 1868 MPa (unconditioned) to 2178 MPa (conditioned). The tensile strength was increased from 16 MPa (unconditioned) to 19.5 MPa (conditioned).
Hosseinaei et al. (2012) conditioned the fibers at varied temperature and found that as the condition temperature increased, the tensile strength increased. As reported, the tensile strength increased from 24.1 MPa (140 oC) to 26.9 MPa (170 oC). The tensile modulus increased from 4505 MPa (140 oC) to 5363 MPa (140 oC).
Mechanical Treatment
Kinetic treatment refers to use high frequency radio plasma to make the fiber particles move inside the WPC. As a result, the fiber particles will be distributed more evenly in the system. Such treatment will decrease amount of defects in WPC and therefore increase the strength. (Dong, 1993)
Chemical Treatment
remove the impurities such as hemicellulose or small lignin and extractives on the wood fiber surface. (Xie, 2004). Such treatment helps expose and disperse the wood fiber to
compatibilizers and increase the sites for bonding. The functions of silane are mainly made up by four steps (Figure 6 I). The silane monomer are first hydrolyzed in the presence of either acid or base. During the hydrolysis process, the self-condensation of silane monomers take place at same time. The rate of condensation can be controlled by the pH of the
hydrolysis system. In order to free as much silane monomers as possible, the rate of self-condensation should be minimized. The silanol monomers are then bonded with hydroxyl groups on the wood side to form the hydrogen bonds. Finally, under heating condition, the hydrogen bonds can be converted to –Si—O—C—bonds to further increase the
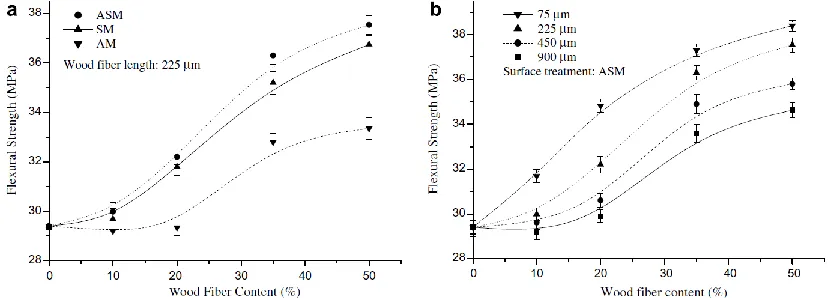
strength.(Cui, 2008) As shown in Figure 15 II a, ASM exhibits the highest flexural strength. In Figure 6 II b, 75 um wood fiber exhibits the highest flexural strength, which is in
I
The pretreatment of the natural content is now common in industry. A pre-wash through NaOH is necessary for better contacts between the natural content and compatibilizers. The treatment with silane is still expensive and complicated which make it less acceptable in industry.
Nanoclays and Nanoxide addition
Nanoclays and Nanoxide have been well studied and are currently regarded as the most suitable nanofillers to WPC due to their high aspect ratio and large surface area. As shown in Figure 7, the clay may increase the overall tortuosity of the system and packed the fibers and plastic matrix together. The permeability of the composite may decrease with addition of clay and act as fillers to enhance the stiffness of the system. (Turku, 2014). There are various nanoclays that are commercially available on the market. The one that has been most commonly used is cloisite Na+(Tjong, 2006) In comparison with original cloisite, the addition of sodium ions improves its swelling such that it can be easily inserted into organic cations. (Tjong,2006)
Figure 7. Tortuous pathway of a permeant in a clay nanocomposites (Turku, 2014)
five weight percent of MAH. An improved tensile strength of 10 MPa and tensile modulus of 1.1 GPa was observed.
Such improvement was due to the restriction of mobility of polymer chains (Deka, 2011) and better intercalation between fibers and matrix (Faruk, 2008) that supplied by the
nanoclay layer. The less mobility of polymer chains and better intercalation will result as an enhancement of the modulus of the matrix. It has little effect on the bonding between the fibers and matrix.
Other fillers
Besides nanoclay, there are many other fillers that have been added into the WPCs to enhance their thermal and mechanical properties. Micro-crystalline cellulose (MCC) and carbon nano-tube (CNT) are the two most popular additives recently explored.
Faruk and Matuana(2008) blended PVC/Wood flour/chitin/CNT for manufacturing WPC. One thing to be noted that chitin is a better compatibilizer than MAH in the case of a PVC matrix. With the addition of five weight percent of CNT into the system, the tensile strength increased from 28 MPa to 40 MPa. The issue with CNT is that CNT is expensive and hard to produce in comparison with nanoclay.
Ashori and Nourbakhsh (2009), instead of using nanoclay, blended MCC with wood flour and polypropylene. With the addition of 8weight percent of MCC, the tensile strength increased from 18 MPa to 39 MPa. The authors did not explain the potential mechanism behind this improvement, and further study is necessary.
Foaming additives
1.3 Wood plastic composite molding process
Compression molding
Compression and injection moldings are the two most typical methods to process wood plastic composite. (Faruk and Bledzki 2007) As mentioned earlier, compression molding was unable to provide competitive strength as the injection mold provided. Such difference is due to different layer orientations retained by compression molding. (Bledzki, 2004) The
compression molding is also less efficient and more costly than injection mold which make it impractical in industry.
Injection molding
Compared to the compression molding, injection molding is more interchangeable. An extruder is typically used to optimize the injection molding process while a plastic resin is heated, melted and conveyed by screws in a barrel. The process is typically downstream and most effective in plastic production. (Bledzki, 2004) Injection molding provided a much more uniform orientation than compression molding. On the other hand, the shear force of provided by extruders is much higher than the compression molding. Such high shear force aggravates the degradation of plastic and shorten the fibers which ultimately decreases the overall strength. (Ku and Wang 2011)
Two-step process
One of the major issue while adding nanoclay into the WPCs is the difficulty to
thoroughly disperse the nanoclay into the system. This difficulty is due to absence of solvent in the whole process. Poor distribution of nanoclay increases the overall heterogeneity and leads to poor force transmission in the system. In order to optimize the disperse, a two-step compounding process was introduced.
increased the mechanical properties of the WPC significantly comparing with the “one-step” WPC.
Lee et al.(2010) proposed a masterbatch process in which instead of blending the
nanoclay with plastic phase, they compounded the nanoclay with MAH in a ratio of 1:9. The author claimed that the masterbatch method promoted the interaction of OH group on the nanoclay with the maleic anhydride groups on MAH. Such interaction increased the opportunities of forming ester and hydrogen bonds between nanoclay and MAH which therefore disperse the nanoclay uniformly in the system.
1.4 Choices of matrix and natural content
Different researchers chose different materials as their starting materials. For the plastic matrix, common candidates are LDPE, HDPE, and PP. For the natural content, wood residue flour (WR), hardwood fiber (HW), softwood fiber (SW), and starch (SA) are common choices. Different materials are best suited for particular applications. Combining natural materials and plastic matrixes together would create different process challenges such as temperature and machine operating limitations. The review of these combinations would provide comprehensive knowledge on the advantages and disadvantages of them.
Plastic Matrix
Salih et al. (2013) blended LDPE and HDPE with PP and tested the mechanical
properties of the blends. As shown in Figure 1, tensile tests were conducted at various ratios of LDPE: PP and HDPE: PP blends.
II.
Figure 8. I Stress-strain curve of HDPE : PP polymer blends. II. Stress-strain curve of LDPE : PP polymer blends Salih et al. (2013).
With the addition of polyethylene into the blends, tensile strength decreased and elongation break increased. HDPE had a less significant effect on the properties of PP. As shown in Figure 8I, the addition of HDPE decreased the maximum stress, but had little effects on the strain. On the other hand, blending LDPE and PP had a significant effect on the PP properties. As shown in Figure 8II, the addition of LDPE decreased the stress and
increased the strain significantly.
From Salih’s work, it can be confirmed that when choosing plastic matrix, PP would provide more strength and rigidity, while LDPE would provide more flexibility. There are also other commercial plastic been used as matrix such as polystyrene, polyethylene
terephthalate and polyvinyl chloride (Yong, 2010). These polymers are chosen to cooperate with different natural content to meet special requirements.
Natural content
industry because of their powder-like form. SW, HW and also cotton fibers are more fluffy and hard to pre-mix with compatibilizers.
It is still uncertain that whether longer fiber length would provide more strength to WPC. Theoretically, the longer the fiber was, the stronger the WPC would be. Based on the formula provided by Ashby (1983), the density and elastic modulus would increase with the increase of the cross sectional area of fiber perpendicular to the applied force. Whereas the cross section area is direct proportion to the fiber length.
ρc = Af ATρf+
Am AT ρm
Where ρc is the density of the composite, ρf is the density of the fiber, ρm is the density of the
matrix, Af is the cross sectional area of fiber perpendicular to the applied force, Am is the
cross section area of the matrix perpendicular to the applied load, and AT is the total cross
sectional area (Af plus Am).
Ec = Af ATEf+
Am AT Em
Where Ec is the elastic modulus of the composite, Ef is the elastic modulus of the fiber, Em is
the elastic modulus of the matrix.
Nonetheless, the experimental results did not always correspond to this theory. As shown in Figure 2 II, the flexural strength of the composite decreased with the increase of fiber length, whereas the one extruded with 75 um (shortest) fiber actually gave the best strength. (Cui, et.al., 2008)
Compared to wood fibers, starch (SA) gives relatively low contribution to the
strength of WPC. As shown in Figure 9, the addition of starch had little positive effect on the strength of WPC. Even with the addition of polyethylene grafted MAH, the strength barely reached to the original strength of HDPE at five weight percent of starch. (Liu, et.al., 2012)
Figure 9. Flexural strengths of wood fiber composites as a function of wood fiber content
with (a) different surface treatment methods and (b) different fiber lengths (Cui, et.al., 2008).
Glass fiber (GF)
Besides natural contents, glass fibers were used as a reinforcement to WPC. Comparing with natural fibers, the fiber length of GF is easier to manipulate. However, the
Cellulose nanocomposites
Nanocomposite refers to a solid material which contain multiphase of additives that are in the nanoscale (less than 100 nm). As mentioned earlier, nanoclay may be used a nano-additives to enhance the strength of the overall system. Other than nanoclay, current popular nanoparticles are cellulose nanocrystals (CNCs) and cellulose nanofibrils (CNFs). (Xu, 2013)
Comparing with CNCs, CNFs are a better additives for reinforcing WPC due to their larger aspect ratio. (Mariano, 2014) Jonoobi and his colleagues extrude CNF with PLA by twin screw extrusion. With the increased amount of CNF (up to five weight percent), the tensile modulus increased from 2.9 GPa to 3.6 GPa. The tensile strength increased from 58.9 MPa to 71.2 MPa. (Jonoobi, 2010)
Other nano-additives include nano-carbon fiber, carbon-nanotube and nano filled glass fibers. Different types of nano-additives fit various types of application. The main challenge with the nano technology is the high cost of these nano-materials.
Patent Statics
As Gardener mentioned, patent containing “wood plastic composite” have increased greatly in the last decade.(Figure 10) . As environmental awareness has grown, the importance of WPC to provide more environmentally friendly alternative to pure plastics seems to have grown. This is manifested in the rapid increase in the patent record for WPC.
References
Altun Yaemin, Dogan Mehmet and Bayramli Erdal., 2013. “Comparative Study of Maleated and Glycidyl Methacrylate Functionalized Terpolymers as Compatibilizers for Low-Density Polyethylene–Wood Flour Composites” Applied Polymer Sci. 127 \ 1010-1016.
Andrusyk L, Oporto GS, Gardner DJ, Neivandt DJ., 2008. Wood plastic composites
manufactured from hot water extracted wood. Part I: mechanical evaluation. Proceedings of the 51st international convention of society of wood science and technology, November;
Ashby MF., 1983. “The mechanical properties of cellular solids” Metallurgical Transactions A 14 1755-1769
Ashori A and Nourbakhsh A., 2009. Characteristic of wood-fiber plastic composites made of recycled materials. Elsevier 1291-1295.
Bledzki AK, Faruk O.,2005. Effects of the chemical foaming agents, injection parameters, and melt‐flow index on the microstructure and mechanical properties of microcellular injection‐molded wood‐ fiber/polypropylene composites. J Appl Polym Sci.; 97(3): 1090– 6.
Bledzki, Andrzej K.. 2004"Wood Fiber Reinforced Polypropylene Composites: Compression and Injection Molding Process." Polymer-Plastic Technology and Engineering 43: 871-888.
Cui, Yihua, Stepeh Lee, and Bahman Noruziaan. 2008 "Fabrication and Interfacial Modification of Wood/recycled Plastic Composite Materials." Composites 39.
Faruk O and Matuana LM. 2008. Nanoclay reinforced HDPE as a matrix for wood-plastic composites. Compos Sci Technol; 68: 2073–2077.
Faruk O and Matuana LM. 2008. Reinforcement of rigid PVC/wood-flour composites with multi walled carbon nanotubes. J Vinyl Add Tech; 12(2): 60–64.
Faruk O and Matuana LM. 2008 Nanoclay reinforced HDPE as a matrix for wood-plastic composites. Compos Sci Technol; 68: 2073–2077.
Gardner D., Han Y., and Wang L., 2015. “Wood-Plastic Composite Technology” Curr Forestry Rep (1): 130-150
H.Ku, H.Wang, N.pattarrchaiyakoop, and M.Trada. 2011. A review on the tensile properties of natural fiber reinforced polymer composites. Composite:Part B 42: 856-873
Jonoobi M, Harun J, Mathew AP, Oksman K. 2010. Mechanical properties of cellulose nanofiber (CNF) reinforced polylactic acid (PLA) prepared by twin screw extrusion. Compos Sci Technol.70(12): 1742–7.
Kahar, A.W.M., H. Ismail, and N. Othman.2012. "Effects of Polyethylene-Grafted Maleic Anhydride as a Compatibilizer on the Morphology and Tensile Properties of (Thermoplastic Tapioca Starch)/ (High-Density Polyethylene)/(Natural Rubber) Blends." Journal of Vinyl and Additive Technology 10: 65-70.
Lee YH, Kuboki T, Park CB, Sain M and Kontopoulou M. 2010.The effects of clay dispersion on the mechanical, physical, and flame-retarding properties of wood fiber/polyethylene/clay nanocomposites. J App Polym Sci; 118: 452–461.
Lei, Yong and Wu, Qinglin. 2011.“Wood plastic composites based on microfibrillar blends of high density polyethylene/poly(ethylene terephthalate)” Bioresource Technology
1013665-3671.
Lipponen, Sami. 2012 ."Preparation and Properties of Cellulose/PE-co-AA Blends." European Polymer Journal 48: 1439-1445.
Liu, W., Y-J. Wang, and Z. Sun. 2003. "Effects of Polyethylene-Grafted Maleic Anhydride (PE-gMA) on Thermal Properties, Morphology, and Tensile Properties of Low-Density Polyethylene (LDPE) and Corn Starch Blends." Journal of Applied Polymer Science 88: 2904-2911.
Mariano M, El Kissi N, Dufresne A. 2014. Cellulose nanocrystals and related nanocomposites: review of some properties and challenges. J Polym Sci B Polym Phys.;52(12):791–806.
Migneault S., Houbaa A., Erchiqui F. , Chaala A. and Wolcott M. 2008. “Effect of Fiber Length on Processing and Properties of Extruded Wood-Fiber/HDPE Composites” Applied Polymer Sci. 1085-1092
Pelaez-Samaniego MR, Yadama V, Lowell E, Espinoza-Herrera R. 2013. A review of wood thermal pretreatments to improve wood composite properties. Wood Sci
Pelaez-Samaniego MR, Yadama V, Lowell E, Espinoza-Herrera R. 2013. A review of wood thermal pretreatments to improve wood composite properties. Wood Sci Technol.
47(6):1285–319.
S. TUNGJITPORNKULL, K. CHAOCHANCHAIKUL AND N. SOMBATSOMPOP. 2007. “Mechanical Characterization of E-Chopped Strand Glass Fiber Reinforced Wood/PVC Composites.” Journal of THERMOPLASTIC COMPOSITE MATERIALS 535-550.
Salih,S. , Hammood A. and ABD alsalam A. 2013. Comparison of the Characteristics of LDPE : PP and HDPE : PP Polymer Blends. Modern Applied Science 1913-1852.
TaBari, H., & Nourbakhsh, A. 2011. Effects of Nanoclay and Coupling Agent on the
Physico-Mechanical, Morphological, and Thermal Properties of Wood Flour/Polypropylene Composites. POLYMER ENGINEERING AND SCIENCE, 51(2), 272-277.
Tjong SC. 2006. Structural and mechanical properties of polymer nanocomposites. Mater Sci Eng R; 53: 71–179.
Turku, I., & Karki, T. 2014. Research progress in wood-plastic nanocomposites: A review. Journal of Thermoplastic Composite Materials, 27(2), 180-204.
Xie, Yanjun, Callum Hill, and Xiaoze Fang. 2004. "Silane Coupling Agents Used for Natural Fiber/polymer Composites: a Review." Composites 41: 806-819.
Yeh S-K and Gupta RK.2010. Nanoclay-reinforced, polypropylene-based wood-plastic composites. Polym Eng Sci; 50(10): 2013–2020.
Zhang H, Rizvi GM, Park CB. 2004. Development of an extrusion system for producing fine-celled HDPE/wood-fiber composite foams using CO2 as a blowing agent. Adv Polym
Technol. 23(4):263–76.
Chapter 2
2.1 Introduction
In wood plastic composites (WPC), the fiber dimensions have various effects on the modulus and strength of the composite. Longer fibers would provide more modulus and strength. On the other hand, longer fibers would create more opportunities for defects. Such defects were caused by uneven distribution of fibers, poor direction arrangements of fibers. These defects would lead to poor interfacial adhesion and force transmission. (Liu, et.al. 2012)
In order to better understand the relationship between the fiber lengths, plastic types vs. strength of WPCs, we have developed a model to predict the elastic modulus of foam materials made of both pure and composite materials. This will help guide the research in identifying the material properties required to achieve the desired levels of strength needed.
2.2 Foam Model Results:
The model was constructed using the general relationship for behavior of foams
identified by Ashby (1983) in his review of the mechanical properties of cellular foam solids. This work brings together the body of knowledge at that time to explain generalized
relationships between foam density and elastic modulus. These foam materials include both wood, metal foams, and plastic foams. The basic relationship between foam density and the elastic modulus is:
E ES = (
p pS)
2
Where E is the elastic modulus of the foam, Es is the elastic modulus of the solid material
making up the foam, p is the density of the foam, and ps is the density of solid material
The elastic modulus and density of the solid making up the foam is determined using a fibrous composite model with the matrix and fiber working in parallel. This assumes that strain is distributed equally between both the matrix material and the fibers added. The result is a weight averaging between the cross sectional areas of the fiber and matrix inside of unit element as shown in Figure 1. Using the respective volume (cross sectional area) fraction of the matrix and the fiber, as well as the density of these two materials, the density of the composite can be calculated:
ρc = Af ATρf+
Am AT ρm
Where ρc is the density of the composite, ρf is the density of the fiber, ρm is the density of the
matrix, Af is the cross sectional area of fiber perpendicular to the applied force, Am is the
cross section area of the matrix perpendicular to the applied load, and AT is the total cross
sectional area (Af plus Am).
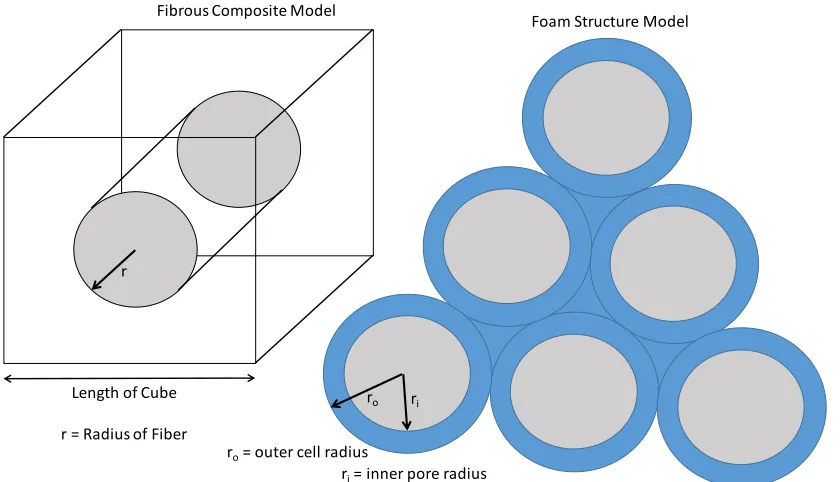
Figure 1: Fibrous composite model shows how the foam wall strength is determined from combination of the matrix and fiber. Foam structure model shows how the foam
r
Length of Cube r = Radius of Fiber
ro ri
ro= outer cell radius
ri= inner pore radius Fibrous Composite Model
structure is approximated to determine density. Note that the space between cells is considered negligible in this model.
The equation for the elastic modulus of the composite material making up the foam wall is as follows:
Ec = Af ATEf+
Am AT Em
Where Ec is the elastic modulus of the composite, Ef is the elastic modulus of the fiber, Em is
the elastic modulus of the matrix, Af is the cross sectional area of fiber perpendicular to the applied force, Am is the cross section area of the matrix perpendicular to the applied load, and AT is the total cross sectional area (Af plus Am).
The foam structure is determined by a simple bubble model. The concept is that the individual foam cell can be approximated as a bubble with a thick wall. This is then used to approximate the density of the foam, cf. Figure1: This approximation ignores the mass between individual cells.
ρfoam =
(𝑉0− 𝑉𝑖)ρc Vo
Where Vo is the volume of a sphere characterized by radius ro, Vi is the volume of a sphere characterized by radius ri, and ρc is defined above.
This model is used to predict the elastic modulus of the foam material. Ideally, WPC can be formed that approximates the properties of wood, but can be manufactured in unique cross sections and have additional benefits related to plastics, ex. water resistance, dimension stability, rot resistance. Literature values for medium density fiberboard (MDF), softwood, hardwood, and balsa wood are shown in Table 1 for comparison purposes. As one can see, the elastic modulus of medium density fiberboard (MDF) is 4000 MPa. This value is significantly higher than LDPE (200 MPa (literature), 95 MPa (measured) and
material to achieve the desired level of elastic modulus. The basic approach will be to add fibrous material to create a fibrous composite for the foam wall.
TABLE 1: Reference literature values for various materials of interest.
Three different reinforcing fibers were examined using the model. These were softwood fibers, ground softwood, and micro-fibrillated cellulose (MFC). Each of these material have the basic components characteristics as shown in Table 2.
TABLE 2: Basic components properties of fibers used in modeling.
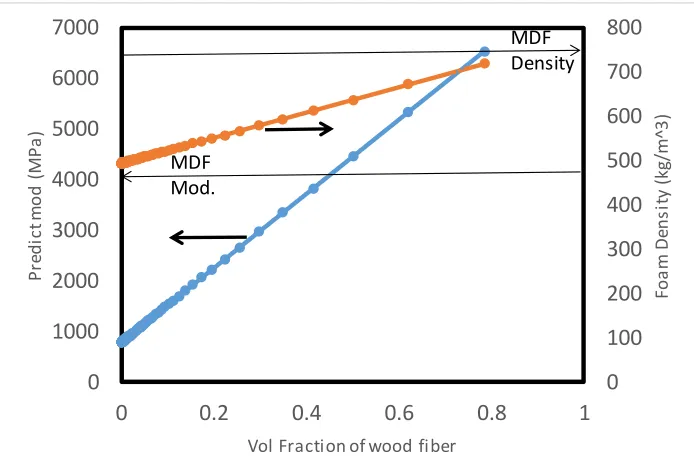
2.3 Scenario 1 – MFC Cellulose and Poly-propylene
Figure 2 shows the effect of adding various amounts of MFC to poly-propylene (PP) on the elastic modulus and the density of the foam. The foam was held constant at a relative volume (void/ total) of 0.52. This means that 48 % of the foam material is composed of air.
Modulus (MPa) Density (kg/m^3) Density (lbs/ft^3) Modulus/Density (m^2/s^2)
MDF 4000 750 46.8 5.33
Softwood 16000 500 31.2 32.00
Hardwood 12000 700 43.7 17.14
Balsa Wood 3000 130 8.1 23.08
LDPE (measured) 95 910 56.8 0.10
LDPE (Lit.) 200 910 56.8 0.22
PP (Lit.) 2880 950 59.3 3.03
MFC 30000 1500 93.6 20.00
Fiber Property
Softwood
Groundwood
MFC
Length (mm)
3
1
1
Eff. Diameter (um)
40
200
4
Figure 2: The elastic modulus and the density of a foam composite material with 0.52 relative volume (i.e. 0.48 void fraction). The composite material is made of poly-propylene and
MFC.
Figure 2 shows the range of materials that will produce a foam with properties similar to MDF. This range can be identified by the lower horizontal line which defines the modulus of MDF (4000 MPa). Any mixture of MFC and matrix that produces a modulus above this line is advantageous. Thus, at ~0.5 volume fraction the composite foam material has a 4000 MPa and a density of ~600 kg/m^3. This combination of materials and void volume has about a 20 % lower density than MDF and similar elastic modulus.
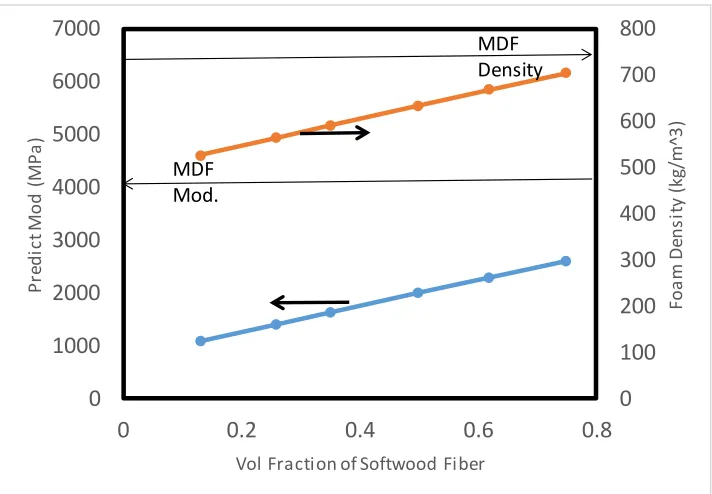
2.4 Scenario 2 – Poly-propylene and Softwood Fiber
Figure 3 shows the predicted elastic modulus and the density of a foam composite with a 48 % void volume. It is worth noting that according to the prediction, there is no reasonable combination of softwood fiber and poly-propylene that will achieve an elastic modulus equal to or greater than MDF.
0 100 200 300 400 500 600 700 800 0 1000 2000 3000 4000 5000 6000 7000
0 0.2 0.4 0.6 0.8 1
Fo a m De n si ty ( kg /m ^3 ) P re d ic t m o d ( M P a )
Vol Fraction of wood fiber MDF
Mod.
Figure 3: The elastic modulus and the density of a foam composite material with 0.48 void fraction. The composite material is made of poly-propylene and softwood fiber.
Using a composite material made of 75 % fiber and adjusting the void fraction of the foam to equal a density of 750 kg/m^3, the predicted elastic modulus rises to 2940 MPa, which is about 75 % of the modulus of MDF. Thus, it appears that there is no practical advantage to pursuing this technology if the intention is to create an exact replacement for MDF with a wood fiber plastic composite.
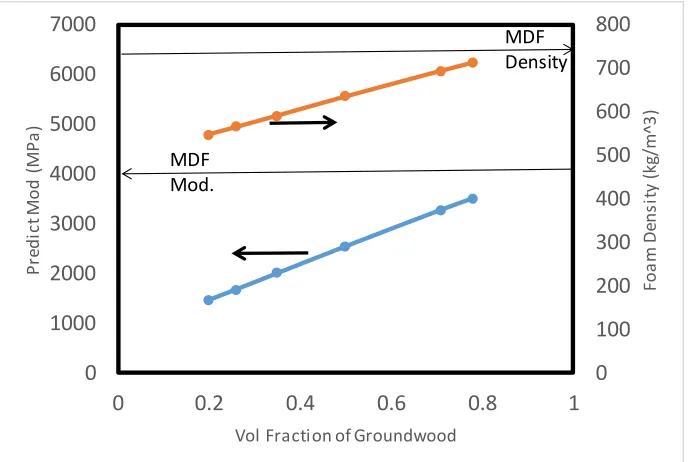
2.5 Scenario 3 – Ground Softwood and Poly-propylene
In the modeling, the ground softwood, as compared to the softwood fiber, shows slightly higher elastic modulus at the same fiber volume fraction. This is attributed to higher
modulus of the ground wood as compared to the softwood fiber. However, up to a 75 % volume fraction of the ground wood, the elastic modulus still does not achieve the elastic modulus of MDF. When the density is adjusted at 0.75 volume fraction of wood fiber to the
0 100 200 300 400 500 600 700 800 0 1000 2000 3000 4000 5000 6000 7000
0 0.2 0.4 0.6 0.8
Fo a m De n si ty ( kg /m ^3 ) P re d ic t M o d ( M P a )
Vol Fraction of Softwood Fiber
MDF Mod.
density of MDF (750 kg/m^3), the elastic modulus of the foam is 3847 MPa, which is comparable to MDF.
Figure 4: The elastic modulus and the density of a foam composite material with 0.48 void fraction. The composite material is made of poly-propylene and ground softwood.
2.6 Conclusion.
Only the MFC showed the combination of an increase in the elastic modulus and a lower density when compared to MDF. Thus, using the MFC/Poly-propylene combination of materials will have the greatest chance at achieving the combination of reduced weight and strength as desired by the marketplace. Alternatively, this indicates that it is imperative to investigate various matrix materials that can provide a greater elastic modulus in an extrudeable form. Softwood fiber and ground wood are both predicted to create similar or slightly lower performance as compared to MDF.
0 100 200 300 400 500 600 700 800 0 1000 2000 3000 4000 5000 6000 7000
0 0.2 0.4 0.6 0.8 1
Fo a m De n si ty ( kg /m ^3 ) P re d ic t M o d ( M P a )
Vol Fraction of Groundwood MDF
Mod.
References
Ashby MF. 1983 “The mechanical properties of cellular solids” Metallurgical Transactions A 14(1983) 1755-1769.
Chapter 3
3.1 Introduction
From the result of Chapter 2, it was predicted that the combination of MFC and polypropylene would provide a competitive modulus compared with MDF. The result was underlying the assumption that the natural contents would bond completely with the plastic matrixes. This assumption is untrue because of the different properties possessed by plastic and natural content. Cellulose, which is mainly composed of linear D-glucose monomers, is polar and immiscible with hydrophobic non-polar polymer matrixes. (Kahar, 2012)
It is necessary to know how far the actual experimental results of the extrusion is from the theory model. In this section, HW (medium), SW (long) and MFC (short) were chosen as the natural content. Polyethylene grafted, maleic anhydrite (MAPE) was selected as the compatibilizers. Polypropylene (PP) was used as the plastic matrix for producing high
mechanical performance WPC. The detailed method and experimental design were described in the follow.
3.2 Experimental Methods and Materials
3.2.1 Materials
Polymeric Matrix
Polypropylene was received from ENTC Polymers as pellets. Its melting temperature is 170 ˚C. Polypropylene grafted maleic anhydrite was purchased from Sigma-Aldrich.
Wood Fibers
Hardwood (HW) and softwood (SW) was used as the fiber resource from U.S. National Institute of Standards and Technology (AKR A.D.#18002). MFC was received from
Figure 1. a. Pulp disintegrator. b. Handsheet maker
I.
III. Figure 2. I. Freeze dried SW sample; II. Thoroughly disintegrated SW sample; III.
Microscopic picture of hardwood fiber
I.
III.
Figure 3. I. Thoroughly disintegrated MFC sample, II Microscopic picture of MFC, III. DSM Xplore twin-screw extruder.
3.2.2 Extrusion
PP phase WPC. Six grams of PP pellets with the oven dried HW, SW and MFC (nominally at 4.7%, 9.1%, 13%, 16% and 33% by weight) were mixed by twin-screw extruder at 220 ˚C .To improve dispersion, the materials were circulated inside the extruder for five mins before extrusion It is also notable that PP was separated into two three gram batches and were added before and after the addition of natural fibers for reaching a better dispersion.
MAPP addition. Six grams of oven dried HW with MAPP (nominally at 3%, 5%, and 7% by weight of HW) and six grams PP pellets were mixed by twin-screw extruder at 220 ˚C. To improve dispersion, the materials were circulated inside the extruder for five minute before extrusion. The PP and MAPP were mixed and added first, followed by natural fibers for a better dispersion.
PP phase WPC at 200 ˚C. Six grams of PP pellets with the oven dried HW
percent by weight percent of MAPP were added to all the samples. To improve dispersion, the materials were circulated inside the extruder for five minute before extrusion. It is also notable that PP was separated into two 3 g batches and were added before and after the addition of natural fibers for reaching a better dispersion.
3.2.3 Dog-bone specimen preparation.
1.1 grams of all the extruded samples were input into the piston of a dog-bone mold instrument (DAKA, Raleigh, USA) at 200°C. The samples were placed in the piston for five minutes before injection.
3.3. Measurements
3.3.1 Thermal analysis.
The thermal degradation properties of the extruded PP phase WPC samples were determined with thermogravimetric analysis (TGA). For TGA, samples were heated from 20 to 500°C in a rate of 20°C/min.
3.3.2 Tensile properties
3.4 Results and discussion
200 300 400 500 600
0.0 0.2 0.4 0.6 0.8 1.0
Weight
%
Tempaerature (ºC) 30% HW, 5%MAPP
40% HW, 5%MAPP 50% HW, 5%MAPP 40% HW Calibration
Figure 4. The TGA curves for PP phase WPC
-5 0 5 10 15 20 25 30 35 40 0 100 200 300 400 500 600 700 800 Tensile Strength Tensile Modulus Te nsile Str en gth (M Pa)
Hardwood Weight Percentage
3a. Tensile properties for PP-HW.
-5 0 5 10 15 20 25 30 35 40
0 100 200 300 400 500 600 700 800 Tensile Strength Tensile Modulus Te nsile Str en gth (M Pa)
Softwood Weight Percentage
-5 0 5 10 15 20 25 30 35 40 0
100 200 300 400 500 600 700
Tensile Strength Tensile Modulus
Te
nsile Str
en
gth
(M
Pa)
Micro-fibril Cellulose Weight Percentage
3c. Tensile properties for PP-MFC. Figure 3. Tensile properties for PP based WPC.
PP based WPC exhibited a good tensile strength and modulus which is attribute to physical properties of polypropylene. As similar, increased amount of natural fibers
0 10 20 30 40 50 60 20 25 30 35 40 45 50 Tensile Strength
Tensile Strength with 5% MAPP
Te nsile Str en gth (M Pa)
Hardwood weight Percentage
4a. Tensile strength properties for PP-HW with MAPP addition.
0 10 20 30 40 50 60
500 600 700 800 900 1000 1100 1200 1300 1400 Tensile Modulus
Tensile Moduluswith 5% MAPP
Te nsile M od ulus (MPa )
Hardwood Weight Percentage
0 5 10 15 20 25 30 35 40 45 50 Tensile Strength Te nsile Str en gth (M Pa)
MAPP Weight Percentage
4c. Tensile strength properties for PP-HW with addition of MAPP.
0 5 10 15 20
1300 1400 1500 1600 1700 1800 Tensile Modulus Te nsile M od ulus (MPa )
Weight Percentage of MAPP
40% 50% 60% 180 200 220 240 260 280 300
Tensile Strength at 220 Celsius degree Tensile Strength at 200 Celsius degree
Te nsile Str en gth (M Pa)
Hardwood Weight Percentage
4e. Tensile strength at different extruded temperature.
40% 50% 60%
1000 1100 1200 1300 1400 1500 1600 1700 1800
Tensile modulus at 220 Celsius degree Tensile modulus at 200 Celsius degree
Te nsile M od ulus (MPa )
Hardwood Weight Percentage
Figure 4. Tensile properties for PP based WPC with MAPP addition As shown in Figure 4a and 4b, the addition of only hardwood fiber into the WPC decreased the tensile properties, which can be attributed to poor force transmission between two phases. With addition of MAPP, the tensile strength increased by approximately 25% and tensile modulus increased by approximately 30%. The MAPP maximized the tensile properties at five weight percent (4c and 4d). At this point, it can be confirmed that MAPP reached a saturated condition, and further addition would increase the heterogeneity and decrease the strength. As shown in Figure 4e, identical weight percent of HW were extruded at both 200ºC and 220ºC. At 200 ºC, the tensile strength increased from 200 N to 250 N (40% HW) and 220 N to 290 N (60% HW). The tensile modulus stayed at nearly the same level after decreasing the extrude temperature. The improvement of tensile strength was probably due to the slower degradation of the cellulose at 200 ºC. Such deceleration would protect more hydroxyl groups for bonding with MAPP. The homogeneity was therefore increased which resulted of the increase of tensile strength.
3.5 Conclusion
PP served as a good plastic matrix. Adding natural content without any compatibilizer decrease the homogeneity of the PP based WPC. No significant increased tensile strength were observed, this is probably due to the defections in the system. It is also notable that MFC weakened the tensile strength of the system most which is probably due to the poor dispersion caused by the abundant amount internal hydrogen bonds in MFC. (Mohanty, 2005). Furthermore, 50 weight percent of HW with PP would provide the highest modulus.
Adding MAPP into PP based WPC increased the overall homogeneity and reinforced the overall mechanical strength. With addition of MAPP, the tensile strength increased by approximately 25% and tensile modulus increased by approximately 30%. The MAPP reached maximized the strength at 5 weight percent
References
Rowell, R. M., Lange, S. E. and Jacobson, R. E., ‘Weathering Performance of
PlantFiber/Thermoplastic Composites’, Molecular Crystals & Liquid Crystals 353, 2000, 85.
Chapter 4
4.1 Introduction
Based on the result acquired from Chapter 3, it can be confirmed that the plain mix of natural content and polypropylene (PP) does not provide any tensile strength enhancement to the WPC. The absence of bonding between the natural phase and plastic phase caused the poor force transmission in the system. (Rowell, et. al 2000) Furthermore, maleic anhydride (MAH) is effective in increasing the overall bonding characteristic in the WPC.. In addition, the results showed that hardwood fiber (HW) acted as the most suitable natural phase among the three candidates (HW, SW, and MFC), because HW contributed most modulus in WPC.
In this chapter, low density polyethylene (LDPE) and HW were blended with and without polyethylene grafted maleic anhydride (MAPE). Compared to PP, LDPE has relatively a low mechanical properties. On the other hand, LDPE has a lower melting point which make the extrusion possible at a lower temperature. In Chapter 3, extrusion at a lower temperature with PP showed improved tensile strength. This may be attributed to the partial degradation of the wood fibers during extrusion at higher temperatures. . The detailed method and experimental design are described in the following sections.
4.2 Experimental Methods and Materials
4.2.1 Materials
Polymeric Matrix
LDPE was received from purchased from Sigma Aldrich (Cas No. 9002-88-4) as pellets. Its melting temperature is 115 ˚C.
Wood Fibers
4.2.2 Extrusion
LDPE based WPC. Six grams of LDPE pellets with the oven dried HW, SW and MFC (nominal additions at 4.7%, 9.1%, 13%, 16% and 33% by weight) were mixed by DSM Xplore twin-screw extruder (Xplore, Netherlands) (Figure 3b) at 130 ˚C. To improve dispersion, the materials were circulated inside the extruder for five miutes before extrusion It is also notable that LDPE was separated into two three gram batches and were added before and after the addition of natural fibers for reaching a better dispersion.
MAPE addition. Four grams of LDPE pellets with HW (nominal additions at 0%, 4.7%, 9.1%, 13%, 16% and 25% by weight) and MAPE 5 % by weight were mixed by twin-screw extruder at 130˚C. Two grams of starch was then added to all the samples. To improve
dispersion, the materials were circulated inside the extruder for five minutes before extrusion
4.2.3 Dog-bone specimen preparation.
One grams of all the extruded samples were input into the piston of a dog-bone mold instrument DaKa (Raleigh, NC, USA) at 200°C. The samples were placed in the piston for five minutes before injection.
4.3. Measurement
4.3.1 Thermal analysis.
4.3.2 Tensile properties
Five dog-bone shaped specimens (gauge length of 25 mm, width 4 mm and thickness 1.5 mm) were prepared from each extruded sample. The tensile tests were carried out with an Instron Universal Testing Machine at 23 °C with a cross head speed of 2.5 mm/min.
4.4 Results and discussion
0 100 200 300 400 500 600
0.0 0.2 0.4 0.6 0.8 1.0
Weight
%
Temperature (°C) LDPE
30%HW,5%MAPE 35%HW
35%HW,5% MAPE
Figure 1. The TGA curves for LDPE phase WPC
0 10 20 30 40 50 60 8 9 10 11 12 13 14 15 16 Tensile Strength
Tensile Strength with 5% MAPE
Te nsile Str en gth (M Pa)
Hardwood weight Percentage
2a. Tensile strength for LDPE based WPC.
-5 0 5 10 15 20 25 30 35 40
100 200 300 400 500 600 700 800
Tensile modulus without addition of MAPE Tensile modulus with addition of 5% MAPE
Te nsile M od ulus (MPa )
Hardwood Weight Percentage
As shown in Figure 2, increased amount of HW fibers increased the tensile modulus. On the other hand, adding more than 20 weight percent HW increased the tensile modulus significantly. By adding 35 weight percent of HW, the tensile strength increased from 0.075 kN to 0.11 kN; the tensile modulus increased from 150 MPa to 750 MPa. MAPE further increased the mechanical properties. For 35 weight percent of WPC, adding 5% of MAPE increased the tensile strength by 10% and tensile modulus by 8%.
As mentioned in last chapter, adding only HW to PP decreased the tensile strength from 200 N to approximately 165 N. Compared to PP based WPC, the strength of LDPE based WPC increased with addition of HW (without MAPE) from 75 N to 100N. This is probably due to the lower extrusion temperature slow down the degradation of HW fiber whereas the fibers contributed more strength into the system. As shown in Figure 3, the LDPE based WPC is a much lighter color than PP based WPC which indicated the slower degradation of HW in LDPE.
Figure 3. (Left to right): 30 weight percent HW LDPE based WPC, 30 weight percent HW PP based WPC and 50 weight percent HW PP based WPC.
4.5 Conclusion
For LDPE based WPC, the tensile strength increased with the addition of only
tensile modulus. Such difference is probably due to the lower processing temperature for LDPE based WPC (135 ˚C) . Hardwood fiber degraded slower at lower temperature and contributed more strength into the system. Adding 5 weight percent MAPE further improved the mechanical properties by approximately 10%.
References
Mohanty A, Misra M, Drzal LT, editors. Natural fibers, biopolymers and biocomposites. Boca Raton, FL: CRC Press, Taylor and Francis Group; 2005.
Kahar, A.W.M., H. Ismail, and N. Othman. "Effects of Polyethylene-Grafted Maleic
Chapter 5
5.1 Introduction
In Chapter 3 and 4, polypropylene and polyethylene grafted maleic anhydride was shown to increase the strength and uniformity for both PP and LDPE matrix. This is also shown by previous author (Bledzki, 2004). However, such enhancement is limited. There are few effective compatibilizer other than maleic anhydride. The natural fiber weight percentage is also limited at about 50 weight percent. When adding more than 50 weight percent natural fiber, the fiber agglomerate forming defects and reducing tensile properties. In order to further increase the strength of WPC, it is necessary to find another component that has the capability to bond fiber and matrix tighter.
Nanoclay (appendix) and plasticized starch (PSA) were chosen as the candidates. In this chapter, plasticized corn starch was used as an additional component and low density
polyethylene (LDPE) was used as plastic matrix. The point of choosing SA was attempting to mimic the formation of tree. Trees were mainly composed by cellulose, hemicellulose, lignin and extractives. Conceptually, the plastic matrix acts as the lignin, plasticized starch as hemicellulose and the hardwood fiber as cellulosic component. The advantage of this composition is that a higher fraction of renewable raw material can be used, while maintain the manufacturing characteristic of traditional WPC. In this chapter, we attempt to create a higher renewable content WPC with improved mechanical properties. These materials were examined by SEM, thermal properties and mechanical properties.
5.2 Experimental Methods and Materials
5.2.1 Materials
56-81-5). Hardwood (HW) was purchased from U.S. National Institute of Standards and Technology. The natural content were pretreated identically as described in Chapter 3.
5.2.2 Mix of glycerol and starch (PSA)
Sixty gram of starch and 40 gram of glycerol were first mixed in a beaker using a glass rod for 10 mins. The mixture was then placed in a vacuum dryer for 24 hrs before using.
5.2.2 Extrusion
Starch as a constant. Four grams of LDPE pellets with Hardwood (nominally at 0%, 4.7%, 9.1%, 13%, 16% and 25% by weight) were mixed by twin-screw extruder at 130˚C. Two grams of plasticized starch (PSA) was then added to all the samples. To improve
dispersion, the materials were circulated inside the extruder for five minutes before extrusion HW as a constant. Four grams of LDPE pellets with 25 weight percent HW and MAPE five weight percent were mixed by twin-screw extruder at 130˚C. PSA mixture was added at 0%, 5%, 10%, 15%, 20% and 27% by weight(nominally). To improve dispersion, the materials were circulated inside the extruder for five minutes before extrusion
5.2.3 Dog-bone specimen preparation.
1.1 grams of all the extruded samples were input into the piston of a dog-bone mold instrument (DAKA, Raleigh, USA) at 150°C. The samples were placed in the piston for five minutes before injection.
5.3. Measurement
5.3.1 Thermal analysis.
differential scanning calorimeter (DSC). For TGA, samples were heated from 20°C to 600°C in a rate of 20°C/min. For DSC, samples were heated from 40°C to 250°C, cooled to 40°C, and then reheated to 250°C at a rate of 10°C/min. The peak temperature of the second heating curves was termed the melting temperature (Tm).
5.3.2 Scanning electron microscopy (SEM) morphological characterization
A composite sample was dropped directly into liquid nitrogen and fractured with a pre-chilled razor blade held in a vice-grip. The fractured pieces were picked out of the liquid nitrogen using a pre-chilled forceps and placed in a desiccator to thaw to reduce the condensation of water on the surface of the material. All composite materials, fractured by the Instron Testing Machine and in liquid nitrogen, were mounted with the fractured surfaces facing up. All specimens were coated with Gold–Palladium for 45 s in a Denton Desk II sputter coating unit (Denton Vacuum USA, Raleigh, NC). Specimens were viewed in a FEI Verios 460L field emission scanning electron microscope (Raleigh, NC,USA) at 2 kV.
5.3.3 Tensile properties
Five dog-bone shaped specimens (gauge length of 25 mm, width 4 mm and thickness 1.5 mm) were prepared from each extruded sample. The tensile tests were carried out with an Instron Universal Testing Machine at 23°C with a cross head speed of 2.5mm/min.
5.3.4 Water uptake procedure
Water absorption (%)
= weight after immersion-oven dry weight oven dry weight
oven dry weight × 100%
5.4 Results and discussion
Figure 1. The TGA curves for LDPE –PSA based WPC
Figure 2. LDPE-PSA based WPC samples. (Left to Right): LDPE; 15% SA, 25% HW; 20% SA, 25%HW; 27% SA, 25% HW; 5% Glycerol.
0 50 100 150 200 250 -3 -2 -1 0 1 2 Exothe rma l
TemperatureoC
25% HW, 5% MAPE, 27% SA 25% HW, 5% MAPE, 10% SA 50% HW, 5% MAPE
25% HW, 5% MAPE LDPE
Figure 3. The DSC curves for LDPE-PSA based WPC.
As shown in Figure 4a, the addition of starch into the LDPE/HW first decreased at tensile strength at low HW weight percent. As the HW weight percent increased, the addition of starch increased strength significantly. However, as shown in Figure 4a, adding only starch has negative effect on the strength of WPC. With the addition of 15 weight percent starch, the strength decreased from 0.075 kN to 0.062 kN. The tensile modulus increased approximately 50% (200 MPa) with the addition of 15 weight percent starch (Figure 4b). With the addition of starch, the heterogeneity of WPC decreased which resulted of the decrease of tensile property. However, starch probably improved the restriction of mobility of polymer chains and intercalation between fibers and matrix which ultimately increased the mechanical properties.
the hardwood fiber did, whereas adding more starch increase the heterogeneity of the overall system. This also explained the large standard deviation of tensile modulus at 20% and 27% of starch. (Figure 4d).
-5 0 5 10 15 20 25 30 35 40
8 10 12 14 16 18
Tensile Strength without addition of MAPE Tensile Strength with addition of 5% MAPE
TensileStrength with addition of 15% of PSA and 5% MAPE
Te nsile Str en gth (M Pa)
Hardwood Weight Percentage
4a. Tensile Strength for LDPE-HW-SA.
-5 0 5 10 15 20 25 30 35 40
100 200 300 400 500 600 700 800
Tensile modulus without addition of MAPE Tensile modulus with addition of 5% MAPE
Tensile modulus with addition of 15% of PSA and 5% MAPE
Te nsile m od ulus (MPa )
Hardwood Weight Percentage
0 5 10 15 20 25 30 12 14 16 18 20 22 24 26
Tensile Strength with 5% MAPE and 25% Hardwood
Te nsile Str en gth (M pa )
Plasticized Starch Weight Percentage
4c. Tensile Strength for LDPE-HW-SA (constant 25 weight percent HW)
0 5 10 15 20 25 30
400 450 500 550 600 650 700
Tensile modulus with 5% MAPE and 25% Hardwood
Te nsile m od ulus (MPa )
Plasticized Starch Weight Percentage