University of South Carolina
Scholar Commons
Theses and Dissertations
1-1-2013
High Fat Diet Induced Obesity in a Mouse Model
for Colorectal Cancer
Kennerly Clinton Patrick University of South Carolina
Follow this and additional works at:https://scholarcommons.sc.edu/etd Part of theBiomedical Commons, and theChemicals and Drugs Commons
This Open Access Dissertation is brought to you by Scholar Commons. It has been accepted for inclusion in Theses and Dissertations by an authorized administrator of Scholar Commons. For more information, please [email protected].
Recommended Citation
Patrick, K. C.(2013).High Fat Diet Induced Obesity in a Mouse Model for Colorectal Cancer.(Doctoral dissertation). Retrieved from
H
IGH FAT DIET INDUCED OBESITY IN A MOUSE MODEL FOR COLORECTAL CANCERby
Kennerly Clinton Patrick
Bachelor of Science
University of South Carolina, 2011
Submitted in Partial Fulfillment of the Requirements For the Degree of Master of Science in
Biomedical Sciences School of Medicine University of South Carolina
2013 Accepted by:
Angela Murphy, Director of Thesis Chandrashekhar Patel, Reader
Cory Robinson, Reader
A
CKNOWLEDGEMENTSI would like to acknowledge Dr. Angela Murphy for all the inspiration, support, and guidance during the duration of this research project. I would also like to
A
BSTRACTObesity is widely correlated with the incidence of colorectal cancer (CRC). The exact mechanisms that link obesity to CRC risk have not yet been fully established, and only a limited number of animal models are available to study pathways involved in
obesity-related colon carcinogenesis. The objective of this study was to determine the influence of HFD-induced obesity on AOM/DSS-mediated colorectal tumorigenesis,
tumor proliferation, and symptom severity. Male C57BL/6 mice were fed a novel high fat diet, designed to mimic the standard American diet (12 % saturated fat & 28 % unsaturated fat), at 4 weeks of age until 16 weeks of age to induce obesity. At 16 weeks
of age HFD-fed mice had significantly increased mean body mass compared to LFD-fed mice. Thus, mice were obese prior to initiation of CRC. Following treatment with AOM/DSS, study results indicated no significant changes in tumor number or size with
obesity. Similarly, obesity did not increase the severity of symptoms in this model. These findings challenge previously published data, with the caveat that the low number
T
ABLE OFC
ONTENTSACKNOWLEDGEMENTS ... iii
ABSTRACT ... iv
LIST OF FIGURES ... vi
LIST OF ABBREVIATIONS ... vii
CHAPTER 1:INTRODUCTION ...1
CHAPTER 2:MATERIALS &METHODS ...4
CHAPTER 3:RESULTS ...9
CHAPTER 4:DISCUSSION ...19
L
IST OFF
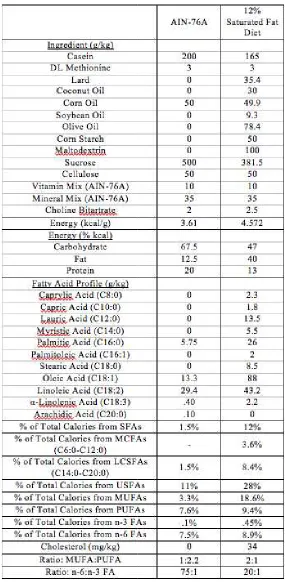
IGURESFigure 3.1 DEXA body composition collected at baseline (16 weeks of age) and at sacrifice (26 weeks of age) on (A) lean mass and BMC, (B) body fat, (C) % lean mass and BMC, (D) % body fat. *Significantly different from LFD-Con (P≤.05).
#Significantly different from HFD-Con (P≤.05). $Significantly different from LFD-CRC (P≤.05) ...4
Figure 3.2 The impact of HFD and CRC on (A) percent change in body weight. *Significantly different from LFD-Con (week 17.5-18: HFD-Con & LFD-CRC; week 18.5-19: HFD-Con, CRC, & HFD-CRC-1 & 2; week 19.5-21.5: HFD-Con, LFD-CRC, & HFD-CRC-1; week 22-24.5: HFD-Con & LFD-CRC; week 25-26: HFD-Con, LFD-CRC, & HFD-CRC-1&2; P≤.05) #Significantly different from HFD-Con (week 16.5-17: LFD-CRC; week 17.5-26: LFD-CRC & HFD-CRC-1&2; P≤.05). $Significantly different from LFD-CRC (week 17.5-26: HFD-CRC-1&2; P≤.05). (B) The effect of DSS induced inflammation on symptom scores. $Significantly different from LFD-CRC (week 18.5: HFD-CRC-2 only; P≤.05) ...4
Figure 3.3 The effect of HFD and CRC on (A) epididymal, (B) mesentery, (C) kidney, and (D) total visceral (Total) fat pad weights at sacrifice. *Significantly different from LFD-Con (P≤.05). #Significantly different from HFD-Con (P≤.05). $Significantly
L
IST OFA
BBREVIATIONSCHAPTER 1
I
NTRODUCTIONAs the second leading cause of cancer-related deaths for both men and women in
the United States, colorectal cancer (CRC) is a national burden. It is the third most commonly diagnosed cancer and is of increasing health concern to a growing aging
population 1,2. It has been shown in epidemiological studies that obesity and metabolic syndromes, like hyperglycemia, hypertension, and hyperlipidemia, increase the risk of developing CRC 3. As such, lifestyle factors such as limited physical activity,
consumption of food with high fat/limited fiber content, high caloric intake, and obesity are controllable factors that can influence the development of CRC 4. Conversely, it has been demonstrated that behavioral factors like exercise and consumption of fruits and
vegetables, even among obese individuals, can reduce the incidence of CRC 4. While family history is a large component in determining CRC risk, environmental factors are
responsible for the majority of cases. In fact, sporadic CRC, the most prominent form of CRC that occurs due to an accumulation of mutations in genes regulating the growth and proliferation of colonic epithelial cells is influenced largely by environmental factors
independent of genetic background 5.
Obesity is widely correlated with the incidence of CRC 6. The exact mechanisms
that link obesity to CRC risk have not yet been fully elucidated; however, a number of biochemical changes associated with obesity have been implicated and include
leptin that is upregulated in obese individuals is a hormone and cytokine produced primarily by adipocytes has been shown to induce CRC by a variety of different
pathways 4. Similarly, increased plasma levels of insulin observed during obesity disrupt normal metabolic processes and thought to activate pathways involved in oncogenesis 4. In addition, inflammatory mediators that are increased in adipose tissue have been linked
to every step involved in the development and promotion of CRC. While there is an abundance of obesity-mouse models, the number of models available to study pathways
involved in colon carcinogenesis is limited 3.
Among the chemically induced CRC models, the azoxymethane (AOM) and dextran sodium sulfate (DSS) model has been proven to induce CRC in a shortened
amount of time with a high level of reproducibility 7. This outstanding model has been utilized in a variety of studies investigating the histopathologic and molecular features
involved in carcinogenesis as well as determining chemopreventive and therapeutic approaches in combating CRC 7. The purpose of this current investigation was to examine the effects of high fat diet induced obesity on CRC. In this study, male
C57BL/6 mice were fed a novel high fat diet, designed to mimic the standard American diet (12 % saturated fat & 28 % unsaturated fat), at 4 weeks of age until 16 weeks of age
to induce obesity. At 16 weeks of age mice were exposed to the CRC protocol. Thus, mice were obese prior to initiation of CRC. This clinically relevant model aims to mimic the conditions of tumor initiation and progression that occurs in obese humans. Previous
studies have co-induced obesity and CRC with the AOM/DSS protocol; however, this approach fails to account for the conditions observed in the at risk obese population prior
CRC would lead to increased severity of sickness symptoms in association with enhanced tumorigenesis. A better understanding of the impact of obesity on CRC is necessary in
determining possible therapeutic targets and/or preventative screening and diagnostic techniques.
CHAPTER 2
M
ATERIALS&
M
ETHODS2.1 ANIMALS
Male C57BL/6 mice, 4 weeks of age, were purchased from Jackson Laboratories (Bar Harbor, ME) and cared for in the animal facility at the University of South Carolina. They were housed four-five per cage and maintained on a 12:12-hr light-dark cycle in a
low stress environment (22°C, 50% humidity, low noise) and given food and water ad
libitum. All animal experimentationwas approved by the University of South Carolina's
InstitutionalAnimal Care and Use Committee. 2.2 DIETS
Mice were randomly assigned to one of five treatment groups as follows: 1) Low
Fat Control (LFD-Con), 2) High Fat Control (HFD-Con), 3) Low Fat Diet-Colorectal Cancer (LFD-CRC), 4) High Fat Diet-Diet-Colorectal Cancer Group
1(HFD-CRC-1) or 5) High Fat Diet-Colorectal Cancer Group 2 (HFD-CRC-2). HFD-CRC-1 and HFD-CRC-2 differed in the dose of azoxymethane (AOM) that was administered to initiate the cancer; group 1 received a dose of AOM based on body weight (10mg/Kg)
whereas group 2 received a dose of AOM that was equivalent to the LFD-CRC group. This was done in order to eliminate any potential differences among the groups due to the
AIN-of age through sacrifice at 26 weeks AIN-of age. The HFD retained the same vitamin and mineral content as the control diet. Food and water was available ad libitum and
measured on a weekly basis.
2.3 BODY WEIGHT & BODY COMPOSITION
Body weight was examined weekly beginning at 4 weeks of age and for the
duration of the 22 week study. In addition, body composition was assessed at 16 weeks of age (prior to initiation of the CRC protocol) and at 26 weeks of age (prior to sacrifice).
For this procedure, mice were placed under brief anesthesia (isoflurane inhalation) and were assessed for lean mass, fat mass, and body fat percentage via dual-energy x-ray absorptiometry (DEXA) (Lunar PIXImus, Madison, WI).
2.4 COLORECTAL CANCER PROTOCOL
To induce colorectal cancer, mice in the CRC groups underwent a standard
protocol consisting of a single subcutaneous injection of azoxymethane (AOM) at 16 weeks of age, followed by 3 cycles of DSS (2% DSS in water for one week followed by two weeks of regular water for the first cycle and 1% DSS in water for the second and
third cycles) beginning at week 17. Both the LFD-CRC and the HFD-CRC-1 groups received a dose of AOM based on their body weight (10mg/Kg body weight) whereas
HFD-CRC-2 received a dose of AOM that was equivalent to the LFD-CRC group. As mentioned above, this was done in order to eliminate any potential differences among the groups due to the dose of AOM (i.e. an increase in tumor number with HFD that may be
due to the increased concentration of AOM that was administered to these mice given their increased weight).
Symptoms were scored twice weekly throughout the 10 week protocol using a standard scoring system that has previously been used in this model. Briefly, scores were
based on diarrhea, blood in stools and weight loss. Diarrhea symptoms were evaluated based on visualization of the fecal matter. Blood in the stools was determined using a Hemoccult Fecal occult blood test. Weight loss was based on the percent change in
weight compared to baseline levels. Mice were given scores of 0, 2 or 4 depending on the severity of the symptoms.
2.6 SACRIFICE & TISSUE COLLECTION
At 26 weeks of age, mice were sacrificed for tissue collection via isofluorane overdose. The kidney fat, mesenteric fat and epididymal fat were removed, weighed, and
immediately snap-frozen in liquid nitrogen and stored at -80°C. The large intestine was dissected from the cecum to the anus and placed on filter paper. A large needle and
syringe was used to flush the large intestine with PBS. The large intestine was then cut longitudinally, flattened with a cotton swab saturated with PBS, and another filter paper was placed on top of the sections. The filter paper was then sandwiched between two
pieces of blotting paper, clipped together on all four sides, and subsequently fixed in 10% formalin for at least 24 hours. After that time, the sections were transferred and stored in
70% ethanol at room temperature to be further analyzed for tumor number and size. 2.7 TUMOR COUNTS
To count tumors, the large intestines were rinsed in deionized water, and briefly
stained in 0.1% methylene blue. Tumors were counted by the same blinded technician for all samples under a dissecting microscope, using tweezers to pick through the villi to
greater than 1mm, or less than 1mm in diameter using an ocular micrometer. Colon lengths were measured as an indicator of inflammation; a shorter colon length is
CHAPTER 3
R
ESULTS3.1 BODY WEIGHT & BODY COMPOSITION
Body composition was calculated by DEXA and lean mass, percent lean mass, total body fat, and body fat percent were determined (Figure 3.1). The mice consuming
the HFD had significantly elevated body fat and percent body fat relative to LFD-fed mice by 16 weeks of age (following 12 weeks of HFD feedings and prior to initiation of CRC), thus HFD-fed mice were obese prior to induction of CRC at 16 weeks of age
(P≤.05). While we observed a general increase in lean mass at sacrifice compared to baseline for all groups, the percent lean mass for HFD-fed mice was significantly reduced relative to the LFD-fed mice (P≤.05). Conversely, body fat and percent body fat at
sacrifice were significantly increased versus baseline in all the HFD groups. Interestingly, at sacrifice the LFD-CRC mice had significantly lower body fat and body
fat percent than the LFD-Con, but the HFD-CRC-1 & 2 mice had significantly increased body fat and body fat percent compared to HFD-Con mice.
Body weight was monitored twice weekly throughout the 10 week AOM/DSS
protocol and was expressed as a percent of baseline (i.e. normalized to measured body weight prior to the initiation of the AOM/DSS protocol) (Figure 3.2A). The LFD-Con
from weeks 17.5 to 22 and was significantly different from all other groups (P≤.05). The HFD-CRC-1 & 2 groups had a significantly greater increase in percent change in body
weight than the LFD-CRC group from 17.5 weeks to 22 weeks (P≤.05).
3.2 SYMPTOM SEVERITY
Symptom scores were calculated twice weekly throughout the 10-week protocol
and were based on diarrhea, blood in stools and body weight loss (Figure 3.2B). Symptom scores in all groups followed the same general trend; there was an increase in symptom score during each week of DSS treatment, which dropped in the subsequent 2
weeks during the water cycle. The only significant increase in symptom severity score was observed in LFD-CRC mice compared to HFD-CRC-2 mice at week 18.5 (P≤.05).
3.3 FOOD & FLUID INTAKE
It was not possible to calculate individual food intake, as mice were housed 4-5/cage. However, in general, we did not observe any differences among the HFD-fed
mice in weekly food intake (i.e food consumed by mice in each cage/number of mice in cage) over the course of the study.
3.4 TISSUE WEIGHTS
Fat pads were collected at sacrifice and for all fat pad depots, the HFD-fed mice had enhanced fad pad mass compared to the LFD-fed mice (Figure 3.3) (P≤.05). Both
CRC-1 & 2 groups had a significantly greater epididymal fat pad mass than HFD-Con mice; however, the HFD-CRC-1 & 2 groups had reduced mesentery fat pads relative
to HFD-Con.
to the control HFD and LFD mice and this reached significance when LFD-CRC mice were compared to HFD-Con mice (P≤.05).
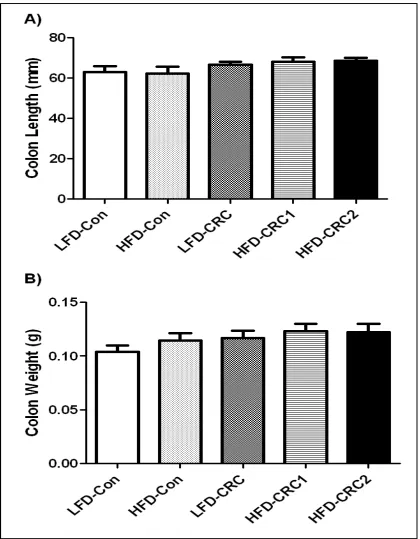
3.5 TUMOR COUNTS
At sacrifice, colons were harvested and tumors were counted on formalin-fixed, methylene blue-stained sections. No significant differences between groups were
determined; however, the number of polyps in the LFD-CRC and HFD-CRC-2 groups was elevated compared to HFD-CRC-1 (Figure 3.6). Colon length and weight were measured following fixation. No significant differences were observed between groups
Figure 3.1 DEXA body composition collected at baseline (16 weeks of age) and at sacrifice (26 weeks of age) on (A) lean mass and BMC, (B) body fat, (C) % lean mass and BMC, (D) % body fat. *Significantly different from LFD
#Significantly different from CRC (P≤.05)
DEXA body composition collected at baseline (16 weeks of age) and at sacrifice (26 weeks of age) on (A) lean mass and BMC, (B) body fat, (C) % lean mass and BMC, (D) % body fat. *Significantly different from LFD-Con (P≤.05).
#Significantly different from HFD-Con (P≤.05). $Significantly different from LFD DEXA body composition collected at baseline (16 weeks of age) and at sacrifice (26 weeks of age) on (A) lean mass and BMC, (B) body fat, (C) % lean mass
.05).
LFD-Figure 3.2 The impact of HFD and CRC on (A) percent change in body weight. *Significantly different from LFD-Con (week 17.5-18: HFD-Con & LFD-CRC; week 18.5-19: HFD-Con, CRC, & HFD-CRC-1 & 2; week 19.5-21.5: HFD-Con, LFD-CRC, & HFD-CRC-1; week 22-24.5: HFD-Con & LFD-CRC; week 25-26: HFD-Con, LFD-CRC, & HFD-CRC1&2; P≤.05) #Significantly different from HFD-Con (week 16.5-17: LFD-CRC; week 17.5-26: LFD-CRC & HFD-CRC-1&2; P≤.05).
Figure 3.3 The effect of HFD and CRC on (A) epididymal, (B) mesentery, (C) kidney, and (D) total visceral (Total) fat pad weights at sacrifice.
Figure 3.5 The effect of CRC and DSS induced inflammation on (A) colon length and (B) colon weight. *Significantly different from LFD-Con (P≤.05).
CHAPTER 4
D
ISCUSSIONCRC is the second leading cause of cancer related deaths worldwide and is a
serious public health concern. Lifestyle factors, such as obesity, smoking, high caloric intake and physical inactivity, have been linked to increased mortality in CRC cases and are controllable factors in the prevention of CRC development and progression 7.
Clinical studies suggest that up to 20% of all cancers are attributed to obesity. Further, it has been well characterized that obesity is widely correlated with the incidence of CRC 7.
In addition, obesity is largely responsible for poorer oncologic outcomes in CRC treatment and management 7. Our novel study examined the impact of HFD-induced obesity in a mouse model of CRC by initiating obesity prior to colon carcinogenesis and
is thus, clinically relevant to the human obese population at risk for developing CRC. However, we did not find any significant changes in tumor number or size with obesity.
Similarly, obesity did not increase the severity of symptoms in this model. Currently, AOM/DSS-induced carcinogenesis in animal models is widely
accepted and offers a reliable, reproducible, and time-effective approach for the study of
colonic tumorigenesis 7. Previous studies have utilized this model to investigate the link between obesity and colonic/colitis-related carcinogenesis. It is well established that
adipocytes regulate inflammatory processes and secrete proinflammatory cytokines, which have been linked to increased proliferation of colonic epithelial cells and
al. showed that HFD induced obesity in a colitis-related tumorigenesis model increased tumor formation and revealed that adiposity-associated inflammation contributes to
colonic epithelial cell carcinogenesis 9. In addition, the AOM/DSS model has been widely used to explore potential chemopreventive and therapeutic agents in the treatment of obesity and colitis-related colonic carcinogenesis 8.
In our study, male C57BL/6 mice were fed either a LFD (AIN-76A) or HFD (12% saturated fat and 28% unsaturated fat) at 4 weeks of age and placed in one of five
groups (LFD-Control, HFD-Control, LFD-CRC, HFD-CRC-1, and HFD-CRC-2). The HFD was designed to be similar to the American standard diet; we previously
demonstrated that this diet led to increased adiposity, macrophage infiltration, and insulin
resistance in obese mice 10. As such, in our study, we observed that at 16 weeks of age the HFD-fed mice had significantly increased mean body mass compared to LFD-fed
mice, thus were obese prior to administration of AOM/DSS treatment (P≤.05). Enos et al. and others have shown that varying saturated fatty acid composition leads to an increased risk of obesity and can differentially regulate inflammatory processes, thus it is
now widely accepted that high-fat-diet-induced obesity can lead to a chronic state of low-grade inflammation 10. Although inflammatory processes were not measured in the
current investigation, we expected that obesity-induced inflammation following administration of this diet, would contribute to the hypothesized effects of increased tumorigenesis with obesity.
DSS, a proinflammatory agent, accelerates tumor growth and proliferation when instituted following an intraperitoneal injection of AOM by promoting cell growth in the
seen in inflammatory bowel disease and Crohn’s disease, also contribute to the development of CRC through various mechanisms that disrupt cellular function and
regulation 11. We observed in the weeks following treatment with DSS that the sickness symptoms in all the AOM/DSS groups was lower than expected and remained diminished over the remainder of the study. This decrease in sickness symptoms over time is
consistent with previous reports; in a comprehensive review by De Robertis et al., it was reported that severe colitis is observed in the week following initial administration of
DSS but its severity is diminished in subsequent weeks 7. Contrary to expectations though, we did not find an increase in symptom severity in the HFD groups. Similarly, at sacrifice, the colon length in the AOM/DSS treated groups did not decrease, suggesting
little to no inflammation. A decrease in colon length is a characteristic feature observed in an inflamed colon, therefore these findings were unexpected. Further, tumor number
was quite low and there were no differences in tumor size or tumor numbers with HFD. In a recent series of studies we conducted on colitis-related colon carcinogenesis, 2% DSS was administered in all three treatment cycles; however, a high number of fatalities
prior to sacrifice limited the scope of the study. In this study, we subsequently reduced the dosage of DSS to 2%, 1%, and 1% at weeks 17, 20, and 23, respectively; however,
contrary to what was expected, we found tumor numbers to be lower than those reported in the literature. These findings of a failure to find a detrimental effect of obesity on tumorigenesis in this model should be interpreted with caution; it is certainly possible
A possible explanation for the discrepancy in inflammation and CRC tumor development may be the difference in the dosage of DSS. It has been established that the
risk of developing CRC is positively correlated with the degree of inflammation within the colon and the duration of the inflammatory disease state. A DSS dosage study conducted with AOM-induced CRC carcinogenesis reported that 2% DSS treatment
resulted in the highest number of colorectal adenocarcinomas 12. Similarly, it was also reported that inflammation scores were higher in mice receiving 2% DSS, suggesting
there is a tumor-promoting activity in DSS 12. As inflammation is necessary in the induction of tumor formation, this may help to explain the minimal number of tumors observed in our model. In addition, it is worthwhile mentioning that the body weight and
age of mice at time of AOM/DSS treatment were greater than those reported in previous models, which may have also contributed to the observed findings. Another possible
rationale for the inconsistent tumor number and inflammatory symptom severity may be due to the extent of excess fat accumulation at the time of AOM/DSS treatment. While obesity is generally understood to have a proinflammatory effect in the colon, our results
suggest that obesity may have some protective role in the initiation of CRC. This affirms the need for future research utilizing HFD-induced obesity models to better understand
the relationship between obesity and colorectal tumorigenesis.
In summary, we examined the influence of HFD-induced obesity on
inflammatory-mediated colorectal tumorigenesis, tumor proliferation, and symptom
severity. In general, there was no increase in symptom severity with HFD-induced obesity. Similarly, in regard to tumor number, our findings are contradictory to
increased risk of CRC development. However, our findings should be interpreted with caution; it is certainly possible that low tumor numbers precluded our ability to find
changes in tumor characteristics and symptom severity with obesity. Although obesity has implications of having proinflammatory and carcinogenic outcomes in the colon, future research should examine the degree to which HFD induced obesity impacts
metabolic disruption, pro-inflammatory signaling, and subsequent initiation and proliferation of CRC as well as determine the pro-oncogenic factors involved in this
R
EFERENCES1. Siegel R, Naishadham D, Jemal A. Cancer Statistics, 2013. CA Cancer J Clin 2013; 63:11-30.
2. Vucenik I, Stain J. Obesity and cancer risk: evidence, mechanisms and recommendations. Ann N Y Acad Sci 2012; 1271:37-43.
3. Teraoka N, Mutoh M, Takasa S, et al. High susceptibility to azoxymethan-induced colorectal carninogenesis in obese KK-Ay mice. Int J Cancer 2011; 129:528-535.
4. Gribovskaja-Rupp I, Kosinski L, Ludwig K. Obesity and Colorectal Cancer. Clin Colon Rectal Surg 2011; 24:229-243.
5. Kanneganti M, Mino-Kenudson M, Mizoguchi E. Animal models of colitis-associated carnicogenesis. J Biomed Biotechnol 2011; 2011:1-22
6. Ma Y, Yang Y, Wang F et al. Obesity and risk of colorectal cancer: a systematic review of prospective studies. PLoS ONE 2013; 8:1-16.
7. De Robertis M, Massi E, Poeta M et al. The AOM/DSS murine model for the study of colon carniogenesis: From pathways to diagnosis and therapy studies. J Carinog 2011; 10:9.
8. Tanaka T, Yasui Y, Ishigamori-Suzuki R et al. Citrus compounds inhibit
inflammation and obesity-related colon carcinogenesis in mice. Nutr Cancer 2008; 60:70-80.
9. Park SY, Kim JS, Seo YK et al. Effects of diet-induced obesity on colitis-associated colon tumor formation in A/J mice. Int J Obes 2012; 36:273-280.
10. Enos RT, Davis JM, Velazquez KT et al. Influence of dietary saturated fat content on adiposity, macrophage behavior, inflammation, and metabolism: composition matters. J Lipid Res 2013; 54:152-63.