The Effectiveness Of Social Media Content
Marketing Towards Brand Health Of A
Company: Social Media Analytics
A. Pappu Rajan
Abstract: Nowadays, companies are tending to use social media marketing to create awareness about the product and promote their brands to the customers. Social Media Content Marketing is an important to convey effective information to the consumers to make them engage with the brands. Brand health is measuring how the digital audience feel about company and their products. The social media analytics is focusing the customer web sentiment which will help the company branding. In this article there are few indicators are taken to measure the brand health of the company such as time on site, repeat visitors, social likes, interaction from four social media sites Facebook, twitter, Instagram and Google plus. Using data of two-month interaction under various categories to find the brand health of a company through web analytical tool. The major insights of this research are the before and after comparison of post posted on social media to find the interaction and that leads to engagement towards the company paints value added post which leads to the involvement towards the brand health and the post type, user post, weekday, time, hour to find the interaction in a day to day posts of the company. The Extraction, Transformation and loading techniques have utilized for web data analysis. The text or web content have classified and analyzed through text analytics in machine learning and the data can be grouped by using clustering. The data insight has discussed and how it helps to improve the business performance with better business decision making. This paper discusses the basic concepts of social media analytics, related literature review, business analytics process, data insights and conclusion.
Index Terms: Web Content Analysis, Social Media Analytics, Brand Management, Business Analytics. Machine learning —————————— ——————————
1.
INTRODUCTION
In the present, the social media has become an important link to connect the people all over the world. They use the social media to connect and share something with their friends through the conversation. The main function of social media is to link with others through the internet connection. The evolutions in the business world have manipulated the functions of social media to become as one of the vital tools for marketing strategy especially in brand health and brand development. In the past era, the business practitioners only adopt the traditional marketing method it is difficult for the business practitioners to measure their brand health through the engagement and audience growth. The study is about how Asian paints social media page make customers and other people retain and attract towards Asian paints posts and interaction over the post posted by them. This research helps to find the brand health using those web interactions through machine learning techniques. Brand Health: The organizational vision, mission, and values are clearly and consistently articulated in all company communications, including company website, marketing materials, and the language used by company’s employees.Brand Health Tracking: Brand health tracking is a strategic tool to measure the health of company brand. Identify the key drivers that make a difference on consumers' brand choice and purchase behaviour and develop marketing strategies that lead to brand development. In this research article discuss the following review of literature, business research, business data analysis and major insights with conclusion.
2
REVIEW
OF
LITERATURE
Robert Rose [7], he published article named content marketing and sales alignment: bridging the gap. This article presented The tension created between sales and marketing is one of the most well-documented relationships in the B2B environment. When that tension is healthy, it creates an innovative atmosphere where adaptation is encouraged, and customer value is created. Marketing ensures that sales teams provide consistency and context to the evolution of the customer’s long-term needs. Sales teams push back on content development to ensure that individual customers are treated as partners rather than demographic targets. NurSyakirah Ahmad et.al. [8],The impact of social media can be determined by using interaction of the customers in social media. The author emphasized as interaction towards content leads to engagement and that engagement leads to positioning the brand in the minds of the customers and then it will make them to retain and continue their brand. Joyson Demers [4], this researcher article explained in solving problems, making it easy to access information, showing off how much the companies know about the consumers is a way that helpful and productive as well as the content connects with people in search of the information. In delivering the content marketing, the companies should provide the content that can answer all the consumers’ queries in very attractive and creative ways to avoid the disinterest of consumers in visiting the site regularly which can ruin the brand health performance. Moreover, content marketing also is one of the vital user pons to make sure that the brand health is in top condition. Besides that, by having a high quality of content marketing it also can help the companies to have more repeat visitors thus increase the brand health scores.
Rick Mulready [9], suggested that three things that big brands do very useful to emulate their business is to find where their customers talk and go deep on their talking by create the content that people want to talk about by using social media to listen to customers.Jacqueline Zenn [6], the researcher explained to measure the brand health by using Engagement as Overall no of times a user talks to the brands on Social ————————————————
Associate Professor
media by continuous interaction over the content posted by the company by analysing the comments like share towards the post. There are various metrics to measure to analyse the brand health in social media like social click through rate, platform reach, share of voice.
3 BUSINESS
RESEARCH
3.1 Research Problem
In the past few years, social media influence most of the people in the world as well as in rural areas also people are familiar to use social media to connect with others. Some of the popular and most using social media are Facebook, Twitter, Instagram, Google plus. These social media have an average of 400 million active users using those media platforms to share and connect with others and also companies make use of these social media to build a brand to generate lead for their company growth. It can be said that the content posting by the company in their social media sites to create a brand as well as connect and share their existing products, new products, and to value added posts to create a value to their company using social media they can made the consumers move from seeing the post to brand health. Therefore, social media content and their impact should be analyzed because which will help the business to improve the business performance. The machine learning techniques are used to predict the future trend of the company and text or post of the company are identified, categorized, clustered and analysed using text analytics in machine learning of natural language processing. In this study is to identify the effectiveness of the social media content marketing in the company paints utilization of social media towards brand using machine learning.
3.2 Scope of the Research
1) The social media content can be metrics like active users, engaged users, frequent users of the company paints.
2) Social media is an effective tool to spread the brand name to all over the world in a single click to create the brand health of paints.
3)Frequent content effects to increase brand health score by determining the no of visitors to the companies site.
4) Understanding the important of mixed type of research methodology or machine learning in web content or text analytics in natural language processing and how it can be very useful for data analytics in social science research development in near feature.
5) Understanding and analyzing the implication of machine learning systems of supervised, unsupervised and reinforcement learning in area of classification, clustering, prediction and forecasting in the business data for better decision making for business development.
3.3 Objectives of the Research Study
To identify the effectiveness of Social Media Content Marketing towards Brand Health of a companyTo determine the current scope or awareness of paints in the social media forum with respect to social media contents or posts of the company. To calibrate the relevance of web content and interactions in paints social media pages. To find out the Impact of frequent content posting. To learn machine learning techniques to solve business problem.
3.4 Research Need and Design
The study need is to analyses the target audience and customers in social media towards brand health. Through relevant and needed content to the users or audience in social media sites user can place the brand into the heart of customers. From this study, the company came to know more about their target audience and also make them easy to feed the brand by giving relevant content frequently to the users or audience. At any point of time that lead was changed into consumer or customer. With the help of this study company can ensure the brand health and also to retain their existing customers. The company can have built analytical tool or lab to use the machine and deep learning techniques to find the business insight through their data and it will help them to improve their business performance. In the business research one of the Key Performance Indicators is social media content and their responses. The data extraction or collection is done by a unique form of Social media data or content about Asian paints. The web content is collected from four Social media using a social media analytics tool called Quintly. Mainly the interaction, Fans, Page movement plays an important role. Quintly is social media analytics tools to help the user tract, benchmark and optimize the company social media performance. All the important Interaction towards Brand are collected and then analysed the web content to determine the desired output of company brand health. The data extracted from August to September 2016. Once the entire data is collected after that tools use to analyse and identify the polarity of the text either Positive or Negative. Social media has various platform but this study using four social media platform FACEBOOK, TWITTER, GOOGLE + & INSTAGRAM of the company. The ETL is the process of Extraction, Transformation and Loading. The web mining can be classified into web content, web structure and web usage mining. In this research the web data is form of social media contents is extracted from social media platforms such as Facebook, Twitter, Google plus and Instagram. The web sources are: https://www.facebook.com/, https://plus.google.com/, https://www.instagram.com/?hl=en, https://twitter.com/twitter. The Sample of the study was two-months interaction taken place on four social media site, the daily interaction was extracted using a Social Media quaintly analytics Tools. The web content was extracted from 1/8/2016 to 30/9/2016 in a daily basis interaction for 24 hrs. in four social media platforms.
4.
BUSINESS
ANALYTICS
TABLE 1
THE DIFFERENCE IN THE FANS OF ASIAN PAINTS - PAIRED SAMPLES STATISTICS
Mean N Std.
Devi ation Std. Error Mean Pair 1 se pf b 1554084.9 333
30 1551 1.65 361 2832.0275 3 au gf b 1505684.8 000
30 1569 4.45 791 2865.4028 7 Pair 2 se pg p 337067.20 00
30 444. 4940 1 81.15313 au gg p 333153.86 67
30 1671 .231 38 305.12371 Pair 3 se pt wi 76808.266 7
30 2624 .468 16 479.16014 au gt wi 70434.466 7
30 2373 .640 82 433.36554 Pair 4 se pin s 16880.633 3
30 381. 6885 8 69.68648 au gin s 15984.833 3
30 178. 4514
0
32.58062
Source : Primary
TABLE 2
THE DIFFERENCE IN THE FANS OF ASIAN PAINTS - PAIRED SAMPLES CORRELATIONS
N Correlation Sig. Pair 1 Sepfb & augfb 30 .942 .000
Pair 2 sepgp & auggp
30 .885 .000
Pair 3 septwi & augtwi 30 .991 .000
Pair 4 sepins & augins 30 .993 .000
Source: Primary
Here the table 1 states that paired fans sample statistics with mean and the four social media stand error and table 1.1 states that
Augfb and sepfb user highly and positively correlated (r = 0.942)
Augtwi and septwi user highly and positively correlated (r = 0.885)
Auggoog and sepgoog user highly and positively correlated (r = 0.991)
Auginst and sepinst user highly and positively correlated (r = 0.993)
TABLE 3
THE DIFFERENCE IN THE FANS OF ASIAN PAINTS - PAIRED SAMPLES COMPARISON
Here the table 3 states thatThere was a significant average difference between user Augfb and sepfb (t29 = 50.059 and p <
0.05) There was a significant average difference between user Augtwi and septwi (t29 = 16.558 and p < 0.05) There was a
significant average difference between user Auggoog and sepgoog (t29 = 83.005 and p< 0.05) There was a significant
average difference between user Auginst and sepinst (t29 =
23.850 and p < 0.05) On average, month august user 48400.133 higher than month September (95% CI [49422.69-50377.5683]) On average, month august user 3913.33 higher than month September (95% CI [3429.96-4396.70]) On average, month august user 6373.80 higher than month September (95% CI [6216.74997-6530.8500]) On average, month august user 895.800 higher than month September (95% CI [818.98-972.618]) The current scope of company is determined by using data of august and September using two paired t test. The P value for all media is <0.05. Here, because of the p value is <0.05 null hypothesis is rejected and user can say there is a difference between user the paired population means of month august and month september is not equal there is a significant difference between user September month and august month fans is not equal to zero.
Paired Differences
t Df Sig. (2-taile d) Me an Std. Devi ation Std. Erro r Mea n 95% Confidence Interval of the
Difference Lower Uppe r Pair 1
sepfb - augfb 48 40 0.1 33 33 5295 .668 20 966. 852 31 46422 .6983 3 5037 7.568 34 50 .0 59
29 .00 0
Pair 2
sepgp - auggp 39 13. 33 33 3 1294 .484 14 236. 339 39 3429. 96501 4396. 7016 6 16 .5 58
29 .00 0
Pair 3
septwi - augtwi 63 73. 80 00 0 420. 5877 2 76.7 884 6 6216. 74997 6530. 8500 3 83 .0 05
29 .00 0 Pair 4 sepins – augins 89 5.8 00 00 205. 7240 2 37.5 599* 0 818.9 8139 972.6 1861 23 .8 50
TABLE 4
CLUSTER ANALYSIS FOR SOCIAL MEDIA CONTENTS IN FOUR SOCIAL MEDIA
TABLE 5
AVERAGE LINKAGE (BETWEEN USER GROUPS)
Sta ge
Cluster Combined
Coeffici ents
Stage Cluster First Appears
Next Stage Cluste
r 1
Cluste r 2
Cluster 1
Cluster 2
1 3 4 .000 0 0 2
2 2 3 .002 0 1 3
3 1 2 .137 0 2 0
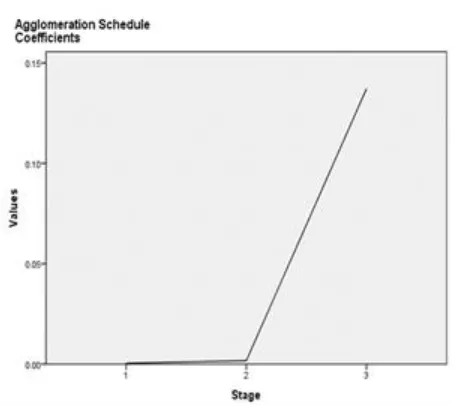
By using Hierarchal cluster analysis, this study is getting the cluster between the content posted in four social media. Here the above Table 4 states that the total summary of four social media page and Table 5 states that by using average linkage agglomeration schedule user can do as in first it forms no coefficient in the value and no cluster was formed in stage two it forms coefficient was 0.002 and in third stage the coefficient was higher as compared to other two stages. On figure 1 shows that the cluster formation happens as that was stated already in the in a diagrammed form as stages of cluster formed in three stages. On that first two stages, there is no much formation but during third stage cluster formation.
Fig.1.0 Agglomeration schedule coefficient
Fig.2.0 Dendrogram
Here the Figure 2.0 shows that dendrogram format by using that the researcher can easily interpret how the cluster formed, here it is clearly stated that link and video forms a cluster as one and text and image forms other and figure states and shows that in hierarchal form text and videos forms higher because of the contents interaction was higher on twitter in a form of text and image in a form of Instagram and google plus took higher interaction post as compare to link and video.
5. BUSINESS INSIGHTS
1) It is found that the month of August and September increase in their fans base in Facebook, Twitter, Instagram and Google plus.
2) It is found that increase in interaction rate on Google plus because of the image and video data posted and got interacted highly in one-month gap and it is not equal to last month.
3) It is clear that interaction takes place by hour was high in google plus and low in the interaction in Facebook, Twitter and Instagram and it goes on with interaction rate high on Google plus.
4) It is clear that interaction takes place was high in google plus and twitter on user week day interaction take place and it shows that a difference in their interaction by the posts posted. Case Processing Summary
Cases
Valid Missing Total
N Percent N Percent N Percent
4 100.0 0 .0 4 100.0
a. Squared Euclidean Distance used b. Average Linkage (Between user Groups)
5) It depicts that current media growth of Asian paints Facebook page as total fans as 1619301 as on September 2016 and average people talking 48256 and fans increase 34030 and Asian paints posts 102 and user posts 77 as average on a month by like, shares, comments as 242496,5414 and 2330 respectively on average.
6) It depicts that current media growth in Asian paints Twitter page as followers 87689, followers difference 7397 and Asian paints own twitter user, retweeted user, Twitter user replies as 398,17,131 and 250 as on November 2016.
7) It depicts that current media growth in Asian paints Google plus page as followers 338218, post posted on average of 62, comments as 6 shares as 10 and plus one difference 829 and circle difference as 762 as on September 2016.
8) It depicts that current media growth in Asian paints Instagram page as followers 18324, likes as 6724 and on image 39, videos as 31 and their followers difference 1177 average of months.
9) It is found that Asian paints post type on Facebook page was high as 62% on status followers by 37 % of link, photos as 28%, videos as 19% with no posts percentage on cover photo, notes and music.
10) It is found that Asian paints post type on Instagram pagewas high as image was fully succeeded as 100% posts and video as 80% as Instagram have two type of posts only. 11) It is clear that people prefer to interact with Asian paints social media page based on the content preferred by them and it states that they like to interacted with images and textual data as a value added to encourage their buying behavior of customers.
12) Research depicts that there is significant difference in two-month data of four social media to put a mark to improve the brand health of Asian paints. They want to concentrate more on Facebook because it has high customer base but this research found that there is no continuous increase in their interaction level to create a brand of Asian paints.
13)By increasing the interaction by the post as not only products and offers encourage them by value added posts like room design, good colour combination to the wall etc.
6 CONCLUSION
This study concludes that the company paints customer response based on the post type, relevant content and suitable timing for posting the content will make the customers to interact in the page of Asian paints. When people interact with the content will lead the engagement over the content and that creates a brand name of the company and also that will increase the customer base expansion. Facebook have high active customer but their interaction with post was low. And Google plus and twitter play a very good part to build brand of the company paints. The active customers prefer and they are attracted to towards the content type mostly they prefer image and videos. Asian paints creating a very good image content and, it is appreciated that to continue like this will create a big customer base and to increase the Brand health of company paints. In this study, the research analyzed the customer’s behavior towards using company paints social media page and how people react the posts posted by them. The social media platform can help the company brand building. The machine and deep learning techniques with R and Pathon tools are playing most important role in business data analysis which will help the company business improvement by the way of prediction and forecasting techniques.
REFERENCES
[1] Asian Paints, ―Asian paints social media-portfolio‖,
available at,
https://www.asianpaints.com/more/about-us/corporate-information.html.2015.
[2] Ashutosh Chauhan,‖Determining the Scope and Relevance of Social Medi‖, available at
http://www.shoutmeloud.com/four-steps-to- determining-the-scope-and-relevance-of-social-media.html. 2016.
[3] T, Dawson, ―The Brand Audit: Key for Determining Brand Health‖, ―Viewed on 5 August 2016‖, available at
http://www.brandingstrategyinsider.com/2011/08/the-
brand-audit-key-for-determining-brand-health.html.2011
[4] J, Joyson Demers, ―5 Steps to Boost Conversion Rates through Your Content Marketing Strategy‖.,
available at
http://www.forbes.com/sites/jaysondemers/2014/10/01 /5-steps-to-boost-conversion-rates-through-your-content.marketing-strategy/2/ 2014.
[5] J. Heaton,‖ Brand Health‖, Viewed on 5 August 2016, available at http://www.tronviggroup.com/brand-health/ 2016.
[6] Jacqueline Zenn, ―Measure Your Brand's Social Media Health‖, Viewed on 17July 2016, available at http://mashable.com/2012/06/11/social-media-brand data/#TKECsKApEmq3,2012.
[7] Robert Rose,‖Content Marketing‖, available at https://
contentmarketinginstitute.com/wp-content/uploads/2018/05/Final_CMI_LinkedIn_Resear ch-March-2018.pdf.2018.
[8] Nur Syakirah Ahmada, Rosidah Musab, and Mior Harris Mior Harun, ―The Impact of Social Media Content Marketing (SMCM) towards Brand Health.‖, Elsevier, Fifth International Conference on Marketing and Retailing, Economics and Finance, Vol.37, 2015. [9] Rick Mulready and Debbie Hemley,―Tips to Create a
Strong Social Media Content Strategy‖, available at http://www.socialmediaexaminer.com/26-tips-to-create-a-strong-social-media-content-strategy. 2013.