IJEDRCP1501027
International Journal of Engineering Development and Research (www.ijedr.org)144
An Efficient Cancer Data Clustering Based On Ant
Colony Optimization
1
P.Lakshmidevi ,
2K.Chinetha
1Student, 2Assistant Professor, Kingston Engineering College, Vellore, IndiaAbstract—Cancer is one of the most dangerous disease types in the world. Early detection can save the life and survivability of the patients. In this paper we want to propose a solution in the direction of identifying the affected genes and severity level of the disease. In the case of different diseases classification is an important aspect so that one can find the infected set efficiently. In this paper different dataset are taken from the NCBI machine learning repository are considered and apply efficient association based ant colony optimization for improving the classification accuracy. In our approach one can select the dataset. The data set has been refined according to the attributes. Then final data set is achieved. Then ACO mechanism has been applied on the final dataset to find the classification accuracy. Ant-based clustering is a biologically inspired data clustering technique. Clustering task aims at the unsupervised classification of patterns in different groups. Clustering problem has been approached from different disciplines during last year’s. In recent years, many algorithms have been developed for solving numerical and combinatorial optimization problems. During the last five years, research on and with the ant-based clustering algorithms has reached a very promising state.
Index terms-- Ant colony optimization, Clustering Analysis, Data mining.
I.INTRODUCTION
DNA, or deoxyribonucleic acid, is the hereditary material in humans and almost all other organisms. Human cells normally contain 23 pairs of chromosomes, for a total of 46 chromosomes in each cell. A change in the number of chromosomes can cause problems with growth, development, and function of the body’s systems. These changes can occur during the formation of reproductive cells. Cancer is a condition in which abnormal cells divide without control. Cancer cells can invade nearby tissues and can spread through the bloodstream and to other parts of the body. The entire genetic makeup of the human cell nucleus. Genes carry the information for making all of the proteins required by the body for growth and maintenance. The genome also encodes rRNA and tRNA which are involved in protein synthesis.
The advent of DNA microarray technologies has enabled the monitoring of expression levels of a large number of genes across different experimental conditions. DNA chips measure the expression level of thousands of genes, perhaps all genes of an organism, within a number of different experimental conditions. The conditions may correspond to different time points, different organs, and different experimental conditions or may have come from cancerous or healthy tissue. Microarrays measure the activity (expression level) of the genes under varying conditions. Expression level is estimated by measuring the amount of mRNA for that particular gene.
II.DNA MICROARRAY
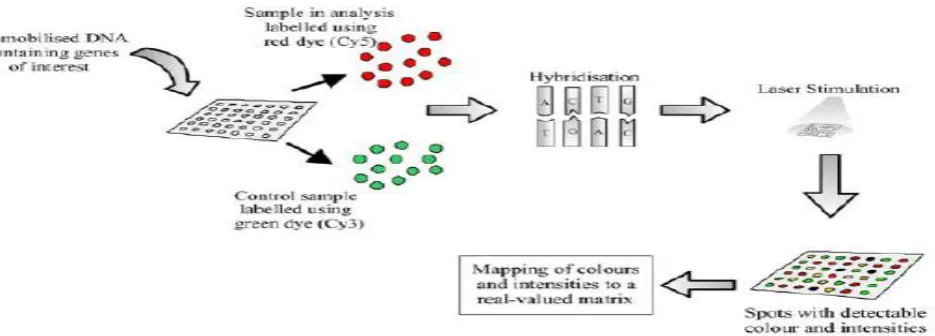
DNA microarray is a set of various types of DNA with differences of base orderly dropped or has been synthesized systematically on the surface of the chip. The DNA microarray can be called “DNA Chip” or “Gene Chip”. The experiment of microarray composes of two samples that are controlled sample and tested sample. For examples, controlled sample is healthy cell and tested sample is sick cell. Complementary DNA or cDNA used for the experiment will be hybridized on a spot of slide surface. The experimental result of microarray composes of many spots of colors as showed in Figure 2.1. Color of each spot occurs from the capturing of cDNA. Red spots will relate to high expression genes. Green spots will relate to low expression genes. Yellow color indicates that the components of both gene samples are equal. Black color indicates that positions have no mixing of both gene samples. The color positions received from array can be converted to real values in the form of matrix. For example, matrix M
IJEDRCP1501027
International Journal of Engineering Development and Research (www.ijedr.org)145
Fig 2.1. Process of Producing DNA Microarray
The disease prediction using DNA microarray is a well-known method because of the advantage technique of DNA microarray that is different from the traditional biological method. With the DNA microarray, a large number of gene expressions will be observed at one time. The clustering technique is also included with the study that contributes to increasing efficiency and reducing cost of disease evaluation.
III.LITERATURE REVIEW
In 2012, M. H. Mehta et al. observed that in engineering field, many problems are hard to solve in some definite interval of time. These problems known as “combinatorial optimization problems” are of the category NP. These problems are easy to solve in some polynomial time when input size is small but as input size grows problems become toughest to solve in some definite interval of time. Long known conventional methods are not able to solve the problems and thus proper heuristics is necessary. Evolutionary algorithms based on behaviors of different animals and species have been invented and studied for this purpose. Particle swarm optimization is a new evolutionary approach that copies behavior of swarm in nature. However, neither traditional genetic algorithms nor particle swarm optimization alone has been completely successful for solving combinatorial optimization problems. So the authors present a hybrid algorithm in which strengths of both algorithms are merged and performance of proposed algorithm is compared with simple genetic algorithm.
In 2012, Priyanka Dhasal et al. Proposed a feature sampling technique of image classification. Their sampling technique optimized the feature selection process and reduced the unclassified region in multi-class classification. For the process of optimization they used ant colony optimization algorithm for the proper selection of feature sub set selection Support Vector Machines are designed for binary classification. When dealing with several classes, as in object recognition and image classification, one needs an appropriate multi class method. They also discuss about the possibilities which include: Modify the design of the SVM, as in order to incorporate the multi-class learning directly in the quadratic solving algorithm. Combine several binary classifiers: “One-against- One” (OAO) applies pair wise comparisons between classes, while “One-against-All” (OAA) compares a given class with all the others put together. OAO and OAA classification based on SVM technique is efficient process, but this SVM based feature selection generate result on the unclassified of data. When the scale of data set increases the complexity of preprocessing is also increases, it is difficult to reduce noise and outlier of data set.
In 2011, Yao Liu et al. implement a classifier using DPSO with new rule pruning procedure for detecting lung cancer and breast cancer, which are the most common cancer for men and women. Experiment shows the new pruning method further improves the classification accuracy, and the new approach is effective in making cancer prediction.
IV.PROPOSED SOLUTION
IJEDRCP1501027
International Journal of Engineering Development and Research (www.ijedr.org)146
Cluster analysis is a tool for exploring the structure of data. Clustering is the process of grouping objects into clusters such that the objects from the same clusters are similar and objects from different clusters are dissimilar. The relationship is often expressed as similarity or dissimilarity measurement and is calculated through distance function. Clustering is useful technique for the discovery of data distribution and patterns in the underlying data. In this mode of learning, there is no training set or prior knowledge of the classes. The system analyses the given set of data to observe similarities emerging out of the subsets of the data. The outcome is a set of class descriptions, one for each class, discovered in the environment. The aim of clustering analysis is to find any interesting groupings of the data. It is possible to define cluster analysis as an optimization problem in which a given function consisting of within cluster similarity and between clusters dissimilarities needs to be optimized.A. Clustering With Ant Colony Optimization
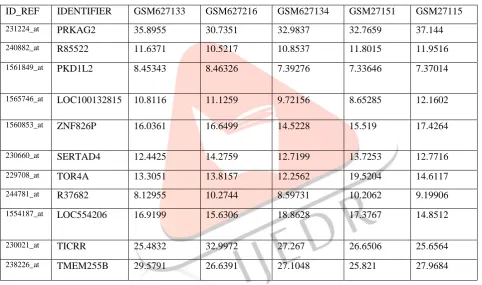
The Ant Colony Optimization (ACO) algorithm is a metaheuristic that has a combination of distributed computation, autocatalysis (positive feedback), and constructive greediness to find an optimal solution for combinatorial optimization problems. This algorithm tries to mimic the ant’s behavior in the real world The aim of data-clustering is to obtain optimal assignment of N objects in one of the K clusters where N is the number of objects and K is the number of clusters. In this approach first select the dataset as shown in Table 4.1.This data set has been mapped with the expert’s documental data or Meta data. Both of these data can be ontologically mapped with ant colony clustering and big o algorithm.
Table 4.1.Dataset
ID_REF IDENTIFIER GSM627133 GSM627216 GSM627134 GSM27151 GSM27115
231224_at PRKAG2 35.8955 30.7351 32.9837 32.7659 37.144 240882_at R85522 11.6371 10.5217 10.8537 11.8015 11.9516 1561849_at PKD1L2 8.45343 8.46326 7.39276 7.33646 7.37014
1565746_at LOC100132815 10.8116 11.1259 9.72156 8.65285 12.1602
1560853_at ZNF826P 16.0361 16.6499 14.5228 15.519 17.4264
230660_at SERTAD4 12.4425 14.2759 12.7199 13.7253 12.7716 229708_at TOR4A 13.3051 13.8157 12.2562 19.5204 14.6117 244781_at R37682 8.12955 10.2744 8.59731 10.2062 9.19906 1554187_at LOC554206 16.9199 15.6306 18.8628 17.3767 14.8512
230021_at TICRR 25.4832 32.9972 27.267 26.6506 25.6564
238226_at TMEM255B 29.5791 26.6391 27.1048 25.821 27.9684
The algorithm presented by Dorigo et al. was given below: Algorithm ACO ( )
Create construction graph Initialize pheromone values While
(Termination criterion not satisfied) Create all ants’ solutions
Perform local search Update pheromone values End while
End algorithm
The main procedure of the ACO metaheurisitc manages the scheduling of the three components of ACO algorithms via the Schedule Activities construct:
management of the ants' activity,
pheromone up dating, and
IJEDRCP1501027
International Journal of Engineering Development and Research (www.ijedr.org)147
The Schedule Activities construct does not specify how these three activities are scheduled and synchronized. The designer is therefore free to specify the way these three procedures should interact, taking in to account the characteristics of the considered problemV.SYSTEM PLAN
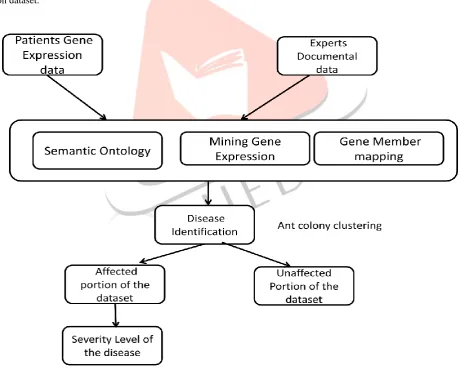
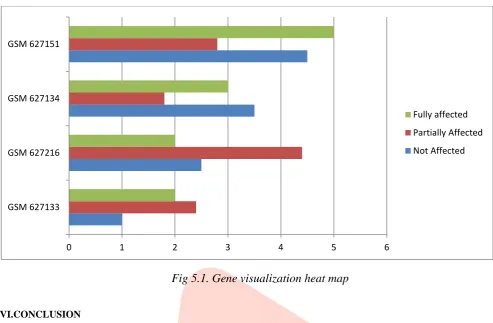
As mentioned in the below Figure 4.1 the gene expression data has been mapped with the NCBI genome dataset and it will identify the location of the affected genes in the sample dataset. An unaffected gene is clustered separately, but the method concentrating on the affected genes and their location. An affected genes location on the map can be counted separately for calculating the severity level of the disease. A Heat map is a 2D Representation of data in which values are represented by colors. Heat maps allow users to understand and analyze complex data sets. This benchmark is used to categorize the affected, not affected and partially affected genes with different colors. The below figure shows the Gene visualization heat map. In the heat map, the expression value of a gene at a specific time point is represented by coloring the corresponding cell of the data matrix with a color similar to the original color of its spot on the microarray. The shades of green represent higher expression levels, the shades of red represent lower expression levels, and the colors toward blue represent absence of differential expression. The genes are ordered before plotting so that the genes that belong to the same cluster are placed one after another. The cluster boundaries are identified by white colored blank rows. It is evident from the figure that the expression profiles of the genes of a cluster are similar to each other and they produce similar color patterns. The heat map for the best clustering produced by algorithm when applied on dataset.
IJEDRCP1501027
International Journal of Engineering Development and Research (www.ijedr.org)148
Fig 5.1. Gene visualization heat map
VI.CONCLUSION
Thus it concludes that a reliable and precise classification of tumors is essential for successful diagnosis and treatment of cancer. By allowing the monitoring of expression levels in cells for thousands of genes simultaneously, microarray experiments may lead to a more complete understanding of the molecular variations among tumors and hence to a finer and more informative classification. The ability to successfully distinguish between tumor classes using gene expression data is an important aspect of this novel approach to cancer classification. Also annotated that comparing the activity of genes in a healthy and cancerous tissue may give some hints about the genes that are involved in cancer.
REFERENCES
[1] M. Dorigo, V. Maniezzo and A. Colorni, “Ant system: optimization by a colony of cooperating agents”, IEEE Transaction on Systems, Man and Cybernetics- Part B, 26(1), 1996, pp. 29-41.
[2] E. Bonabeau, M. Dorigo and G. Theraulaz, “Swarm Intelligence: from natural to artificial systems”, Oxford University Press, Inc., New York,NY, 1999.
[3] A. Abraham, He Guo and Hongbo Liu, “Swarm Intelligence:Foundations, Perspectives and Applications”, Swarm Intelligence in Data Mining, A. Abraham, C. Crosan, V. Ramos (Eds.), Studies in Computational Intelligence (series), Springer, Germany, 2006. J. Handl, J. Knowles and M. Dorigo, “Ant-Based Clustering and Topographic Mapping”, Artificial Life, MIT Press, Vol. 12, No. 1, 2006, pp.35-61.
[4] T. Kohonen, “Self-Organizing Maps”, Springer series in Information Sciences, Vol. 30, Springer, Berlin, Heidelberg, New York, 1995, 1997,2001.
[5] Xiaohua Xu and Ling Chen Chen Y., “A4C: an adaptive artificial ants clustering algorithm”, Proceedings of the 2004 IEEE Symposium on Computational Intelligence in Bioinformatics and Computational Biology, 2004, CIBCB’04, 2004, pp. 268-275.
[6] Yi-Ping Phoebe Chen (Ed), “Bio Informatics Technologies”, First Indian Reprint, Springer Verlag, 2007.
[7] N.J. Chikhale and Virendra Gomase, "Bioinformatics- Theory and Practice", Himalaya Publication House, India, 2007. [8] M. Dorigo, G. Di Caro, and L.M. Gambardella,“Ant algorithm for discrete optimization”, Artificial Life, vol. 5, no. 2, pp.
137-172, 1999.
[9] Yan Yang and Mohamed S. Kamel, “An aggregated clustering approach using multi-ant colonies algorithms”, Pattern Recognition, Vol. 39, Issue 7, July 2006, pp. 1278-1289.
[10]C. Fernandes, A.M. Mora, J.J. Merelo, V. Ramos and J.L.J. Laredo, “KohonAnts: A Self-Organizing Ant Algorithm for Clustering and Pattern Classification”, http://arxiv.org/abs/0803.2695v1, 2008.
0 1 2 3 4 5 6
GSM 627133 GSM 627216 GSM 627134 GSM 627151
Fully affected
Partially Affected