Department of Physics & Astronomy
University College London
Modelling o f Silicon Oxidation
Processes
Marek Artur Szymanski
Thesis submitted for the degree of Doctor of Philosophy
All rights reserved
INFORMATION TO ALL USERS
The quality of this reproduction is dependent upon the quality of the copy submitted.
In the unlikely event that the author did not send a complete manuscript and there are missing pages, these will be noted. Also, if material had to be removed,
a note will indicate the deletion.
uest.
ProQuest U643612
Published by ProQuest LLC(2016). Copyright of the Dissertation is held by the Author.
All rights reserved.
This work is protected against unauthorized copying under Title 17, United States Code. Microform Edition © ProQuest LLC.
ProQuest LLC
789 East Eisenhower Parkway P.O. Box 1346
A bstract
The oxide on silicon is a major factor in silicon’s domination of microelectronics. Yet, there is still no comprehensive vahdated atomistic picture of the oxidation process. This work concentrates on the properties and diffusion mechanisms of different oxygen species (the potential oxidising species in the context of silicon oxidation) in the amorphous oxide. My periodic-boundary DFT calculations for a representative model of amorphous silica em phasise the influence of static disorder on defect properties, the importance of a statistical approach, and the use of appropriate techniques. They show it is important to go beyond models based on a — quartz.
The calculations include atomic and molecular oxygen, in neutral and negative charge states, and ozone. The comparison of defect properties in a — quartz and a — Si02 shows three types of difference: different average energetics, a big spread of values in the amor phous sample for some of the species, and the possibility of different stable conflgurations in the amorphous and crystalline host materials. I conclude that a — quartz can be a poor mimic of amorphous sihca for some of the properties. For example, the signiflcant site-to-site variations in incorporation energies of atomic oxygen originate mostly from the intrinsic medium-range strain fields of amorphous structure, and to a lesser extent from the different structures of the defect local environments. Neither of the factors can be simulated using a — quartz.
C ontents
List of Figures... 7
List of T a b le s ... 11
Acknowledgements... 14
Notation and conventions ... 15
1 Introduction 16 1.1 Basic processes of silicon o x id a tio n ...18
1.2 Kinetics of silicon o x id a tio n ...21
1.3 Experimental r e s u l t s ... 24
1.4 Alternatives to reaction-diffusion m o d el... 24
1.5 Existing results on oxygen species in silicon d io x id e ... 27
2 Techniques 30 2.1 The Density Functional periodic-boundary m e t h o d ...30
2.2 Atomic relaxation and transition-state search m e t h o d s ...32
2.4 Atomic and molecular oxygen as reference s ta te s ... 34
2.5 Accuracy of the DFT m e t h o d ... 35
2.6 Definition of incorporation energy and electron a f f in ity ... 36
2.7 Practical modelling of the Si02 system in contact with oxygen gas and reservoir of electrons... 38
3 S tru ctu re of Si02. Models of non-defective reference stru ctu res 42 3.1 General properties of Si02 n e tw o rk ...42
3.2 The model of a; — q u a r tz... 44
3.3 Generation of amorphous m o d e l s ...46
3.4 Results for the model amorphous system s... 49
4 Properties of th e oxygen species in a - quartz 59 4.1 Neutral interstitial oxygen molecule in a — q u a r t z...62
4.2 Negative interstitial molecular oxygen in o: — q u a r tz... 63
4.3 Double-negative interstitial oxygen molecule in a — q u a r t z... 65
4.4 Neutral interstitial atomic oxygen in a — q u a r t z...66
4.5 Negative interstitial atomic oxygen on a — q u a r t z...68
4.6 Double-negative interstitial atomic oxygen in a — q u a r t z...71
4.7 Neutral interstitial ozone in o: — q u a r t z...72
4.8 Localisation of charge and spin ... 73
Contents
5 Oxygen species in am orphous Si02 80
5.1 Neutral interstitial molecular oxygen in a — Si02 ; • • • 81
5.2 Negative interstitial molecular oxygen in a — S i 0 2... 83
5.3 Double-negative interstitial molecular oxygen in a — S i 0 2...84
5.4 Neutral interstitial atomic oxygen in a — SiÛ2 ... 85
5.5 Negative interstitial atomic oxygen in a — Si02 ; . . . 86
5.6 Double-negative interstitial atomic oxygen in a — S i 0 2 ...87
5.7 Interstitial ozone in a — Si02 ...; . . . 88
6 Role of disorder in incorporation energies of oxygen atom s in am or
phous silica 90
6.1 In tro d u ctio n...91
6.2 Energetics of Peroxy Linkage (PL) d e f e c t s ... 93
6.3 Structure of the peroxy linkage and its relation to the strain energy
of the surrounding netw ork...i . . . 97
6.4 Pair potentials as a tool for partitioning the e n e r g y ... , . . . 99
6.5 The choice of the local cluster and analysis of the energy contributions 100
6.6 Summary and c o n c lu sio n s... 106
7 T he details o f O^i energetics and diffusion in am orphous Si02 108
7.1 Factors influencing the incorporation energy of Og* ...; . . . 109
7.2 Pair-potential partition of the incorporation e n e r g y ...112
8 Discussion and conclusions 122
8.1 Summary of results in the amorphous model and comparison with
a — q u a r tz...124
8.2 Distribution functions and the interpretation of a v e ra g e s ... 128
8.3 Conclusions: silicon o x id a tio n ... I . . 130
8.4 Experimental observation of charged oxygen sp e c ie s... 137
8.5 Implications and future developm ents : . . 138
9 Appendix 141
9.1 Topology of the sample amorphous 5 ... 141
List o f Figures
0.1 Ball-and-stick representation of an interstitial oxygen molecule incor
porated into a model of amorphous silica and a — quartz... 3
1.1 Four potentially rate-limiting processes of silicon oxidation on the
example of oxygen molecule being the oxidising species...19
1.2 Typical oxidation kinetics data in dry oxygen...22 1.3 Charging transfer from silicon to the incorporated oxidising species
close to the Si/oxide interface...26
2.1 Example of a transition-state search with the use of the Ascending and Descending Valley Points Method on a two-dimensional potential
energy surface... 33
2.2 The use of experimental information and the DFT results on the Si02
valence band to estimate the chemical potential of electron reservoir
at the bottom of S i conduction band . 40
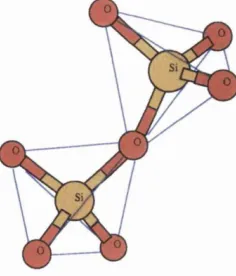
3.1 Ball-and-stick model of two interconnected tetrahedra... 43
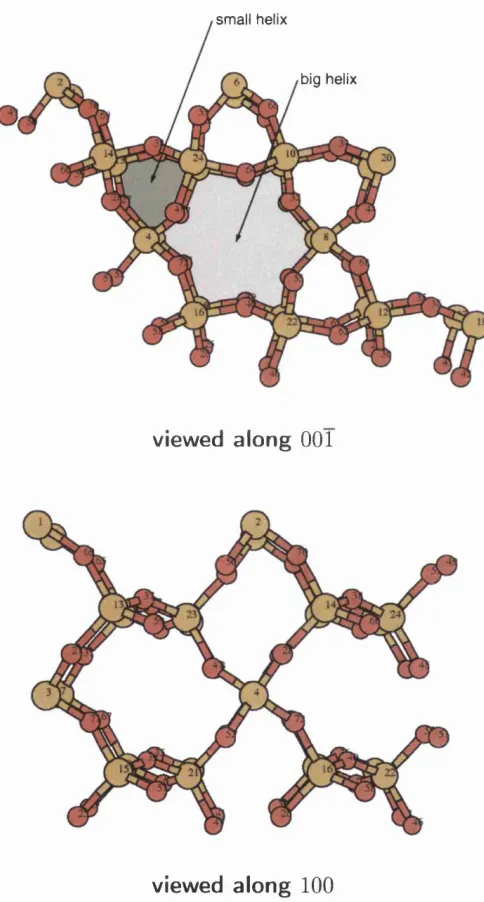
3.2 Ball-and-stick model of a — quartz. The highlighted areas indicate
small and big helixes along the c axis of the crystal... . 45
3.4 Comparison of the DFT and empirical-potential energies for a number of structures taken from the molecular dynamics quenching procedure. 48
3.5 Energetics of amorphous phases ; . 50
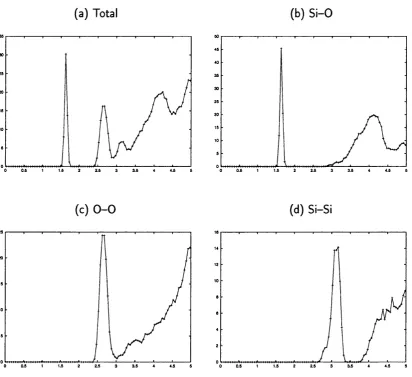
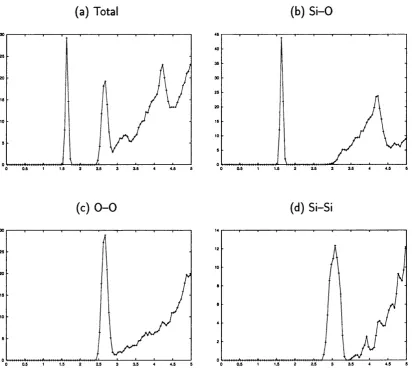
3.6 Total and partial radial distribution functions for the sample
amor-phous_4 : . 54
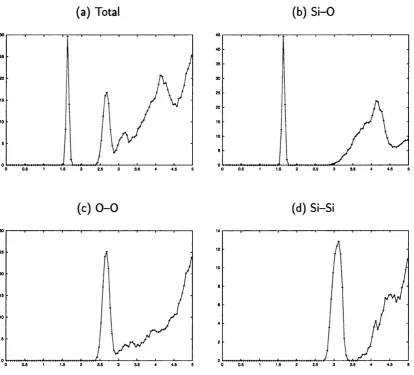
3.7 Total and partial radial distribution functions for the sample
amor-phous_5 ; . 55
3.8 Total and partial radial distribution functions for the sample amor
phous _ 6... . 56 3.9 Distribution oi S i — O — Si and O — Si — O angles for the three
amorphous models ; . 57
4.1 Schematic representation of a — quartz structure ; . 61
4.2 The lowest-energy configuration for an interstitial oxygen molecule in
a — quartz ■ . 62
4.3 Stable types of configuration for negative interstitial molecule in a ^
quartz ■ . 64
4.4 Stable types of configuration for double-negative interstitial oxygen
molecule in o: — quartz i . 65
4.5 Typical geometry of a transition state involved in 0 \~ diffusion along
c axis of d — quartz > . 66
4.6 Two stable configurations of interstitial atomic oxygen in o: — quartz. 67
4.7 Processes involved in diffusion of peroxy linkage along c axis of o;
quartz ; . 69
4.8 Typical transition state for diffusion of Of in a — quartz ; . 69
4.9 Schematic adiabatic potential for interstitial atomic oxygen diffusion
List o f Figures
4.10 Types of stable configurations for O f in o; — quartz...70
4.11 Stable configuration of double-negative interstitial atomic oxygen in
a — quartz... 72
4.12 The stable configuration of interstitial ozone molecule in a — quartz. 72
4.13 The charge localisation for oxidising species in A — quartz... 75
4.14 The energetics of oxidising species in a — quartz... 76
6.1 Stable configurations of peroxy-linkage defect in S i0 2... 93
6.2 Histogram of the probability density distribution of peroxy-linkage
incorporation energies...94
6.3 Incorporation energy of the peroxy-linkage into the amorphous sample
as a function of initial S i — O — S i angle... 95
6.4 The relation between the initial Si — O — Si angle of the non-defective
site and the S i — O — O — Si torsion angle of relaxed peroxy-linkage
defect incorporated into amorphous sample... 96
6.5 Schematic diagram of the a — Si02 network... 101
6.6 Correlation plot for fitting a minimal set of harmonic potentials for
the strain energy of the non-defective amorphous network...101
6.7 Change of the medium-range strain energy as a function of
peroxy-linkage incorporation energy... 104
6.8 Histograms showing the probability density distribution for the two contributions to the peroxy-linkage incorporation e n e rg y ... 105
6.9 The combined probability density distribution of embedding network
(change of strain energy) and local cluster energy components... 106
7.1 Ogi incorporation energy as a function of the distance between the centre of the molecule and the closest atom of the non-defective a —
7.2 Fitting of the total energy of free oxygen molecule in a triplet state
to the DFT results for a range of oxygen-oxygen distances... 113
7.3 Correlation plot of the DFT and pair-potential (eq. 7.2) incorpora
tion energies for a set of 951 geometry configurations of O^i in the amorphous sample...115
7.4 Molecule-network interaction energy as a function of change of strain
energy in the Si0 2 network for the relaxed stable configurations and
converged transition states...116
7.5 Transition states for 02t^ diffusion in a — Si02 in 7- and 6-membered rings... 118
7.6 Transition states for Û2i^ diffusion in a — SiÛ2 in 5- and 4-membered
rings... 119
8.1 Average energetics of oxygen species in a — S i0 2... 131
List o f Tables
3.1 The structure of fully relaxed a — quartz ' 46
3.2 Calculated properties of amorphous models - 51
3.3 Calculated and experimental peak positions in radial distribution
functions for the amorphous models... ■ 52
3.4 Calculated properties oî Si — O — S i and O — Si — O angles in the
amorphous models ' 52
3.5 Minimum-size ring statistics for the model amorphous systems of this
work compared with published data for simulations of bigger systems, 58
4.1 The summary of properties of oxidising species in a — quartz. . . . * 77
5.1 Energetics and geometry of stable configuration for Og* the amor
phous sample...• 82
5.2 Energetics and geometry of stable configuration for O^i in the amor
phous sample...- 83
5.3 Energetics and geometries of stable configurations for in the
amorphous sample... ' 85
5.4 Energetics and geometry of stable configurations for 0 ° in the amor
5.5 Energetics and geometry of stable configurations for in the amor
phous sample... 87
5.6 Energetics and geometry of stable configurations for Oi~ in the amor
phous sample...88
5.7 Properties of ozone molecules in a — S i0 2... ... . . . 89
6.1 The distribution of selected interatomic distances before and after
incorporating a peroxy linkage into the amorphous sample. . . . 97
6.2 The minimal set of harmonic potentials of the general form c{d — do)^ for representing the energy of S i 0 2 defect-free amorphous network. . 100 6.3 Characteristic parameters of the distribution of peroxy-linkage in
corporation energy and its partition into local part and change of
medium-range strain energy... 103
8.1 Average energetics of oxygen species in a — S i0 2... 125
9.1 Description of the sites for atomic species in the sample amorphous_5.144
9.2 The stable sites for interstitial oxygen molecules in the sample
A cknow ledgem ents
I would genuinely like to thank my supervisors: Professor Marshall Stoneham for being so accommodating and for his much appreciated very inspiring 'spiritual
guidance’-like style of supervision, Dr. Alexander Shluger for his attention to de
tails and structuring of arguments. His always critical comments and his ’touch of
realism’ contributed importantly to this work.
This project was sponsored by the Fujitsu European Centre For Information Tech
nology (FECIT). I would like to express my particular gratitude to Dr. Ross Nobes
for his continuous support and the generous allocation of FECIT’s excellent com
puter resources.
The assistance of Professor Leszek Adamowicz and the Faculty of Physics at Warsaw
University of Technology is gratefully acknowledged.
I would like to thank Dr. Jacob Gavartin, Dr. Lev Kantorovitch, Dr. Peter Sushko, and Professor Igor Abarenkov for helpful and sometimes heated discussions. Dr.
Anthony Harker for reading parts of the manuscript. Dr. John Harding for his patience with my questions about chemical aspects of solid-state processes, and all
others who contributed with their knowledge and experience.
Finally, very special thanks to Mette for sharing with me a part of the other side of
Throughout this thesis, I use the standard conventions and notation which are listed below. The units for lengths are Angstroms (Â) and nanometers(nm), for eiiergy
- electronvolts (eV). Special attention needs to be drawn to the term ’stable con
figuration’, which I use consistently in the meaning of ’locally-stable configurdtion’.
The lowest-energy configuration for a given defect is referred to as ’the most stable configuration’. This nomenclature facilitates the discussion of defect properties in
the amorphous systems.
O2 - oxygen molecule
0 2g - neutral oxygen molecule in the gas phase
Ogi - neutral interstitial oxygen molecule
- negative interstitial oxygen molecule
Oli^ - double-negative interstitial oxygen molecule
0° - neutral interstitial oxygen atom - negative interstitial oxygen atom
Oi~ - double-negative interstitial oxygen atom
O^g - ozone molecule in the gas phase
1 Introduction
The oxide on silicon is a major factor in silicon’s domination of microelectronics: it
is an outstanding gate dielectric, it passivates the Si surface, and can be exploited
in processing. Oxidation technology has been improved over years of research and
development, yet there is no comprehensive validated atomistic picture of the oxi dation process.
The early models of oxidation were devised to explain the kinetics of the oxide
growth. The kinetics itself, however, does not allow one to distinguish between
different models. A range of experimental techniques has been used since to obtain more information on the atomic structure of S i / S i0 2 systems and the oxidation
process itself. A successful model of oxidation should be consistent with all of the
experimental data, and in particular with the newer experimental findings: the
layer-by-layer growth resulting in an abrupt interface, the roughness of the interface
oscillating with the oxide thickness, the distribution of oxygen isotope incorporation
during sequential oxidation with different oxygen isotopes, effects of excitation and
of electron injection. None of the existing models can explain all of these features.
The atomistic processes of silicon oxidation are still elusive. The most basic and
important ingredients of silicon oxidation theory, like the nature of oxidising species
and the processes at the interface, continue to be discussed. With the experiments
providing only indirect and partial information, the discrimination between different
models requires additional atomic-level information. This can be aided by the state-
of-the-art modelling.
This work concentrates on properties and transport of oxygen species in amorphous
charge states, and ozone in o; — quartz and a representative model of a — SiÛ2^ I
establish, in agreement with the accepted picture for the thick oxides, that the
neutral oxygen molecule is the species responsible for oxygen transport from the gas
phase to Si/oxide interface. The results imply, however, a new picture of silicon
oxidation arising from charge transfer from silicon to the diffusing molecular oxygen with its possible dissociation into atomic species near the Si/oxide interface. For
very thin oxides a similar mechanism can exist, with the electrons tunneling directly
to the oxygen species adsorbed at the gas/oxide interface. The model is consistent with a wide range of experimental data. Based on these concepts and the results
of my calculations, new approaches to oxidation control and optimisation of oxide properties are suggested.
The results of this work have implications not only for understanding of oxidation
in dry oxygen. Establishing of diffusion mechanisms for oxygen species is impor
tant for the analysis of isotope exchange and tracer experiments. Other oxidation
processes may have different dominating oxidising species and hence the properties of the oxides can be different. For example, oxidation in ozone should proceed in
parallel by molecular and some form of atomic oxygen since ozone will dissociate once incorporated into the oxide or even before the incorporation step. For plasma
oxidation, ultra-violet-assisted oxidation and low-energy-electron-assisted oxidation,
it is most likely that oxygen ions are responsible at least partially for the transport.
My results are useful for analysis of these processes.
There are more general consequences of the findings of this work. I have shown
that a — quartz can be a bad mimic of amorphous silica. The calculations in the
amorphous sample yielded a big spread of values for some of the defect properties
and big differences with a — quartz. I investigated the origins of this difference.
The intrinsic medium-range strain fields of the amorphous structure are the main
origin of the big spread in energies of atomic species. The amorphous topology of
the S i0 2 network, which determines the void structures, is crucial for the properties
of the interstitial molecule. I have found that static disorder can strongly affect
defect properties and lead to their significant site-to-site variations. Calculations of distributions for these properties in a representative amorphous model and the use
of appropriate statistical methods are therefore crucial.
1 Introduction
species in amorphous silica in context of silicon oxidation, the results can be consid
ered as a part of broader classes of problems. The oxygen species can be viewed as
defects, and silicon dioxide is a member of a bigger family of network formers and
ionic-covalent materials. Silicon oxidation involves creating an interface between the
oxide and silicon. The methodology of this work and the calculations of different
defect charge states close to an interface with another material can be very relevant
to a broader class of metal/oxide systems. Further, the conclusions of this work
about the influence of disorder on defect properties will apply to other amorphous
materials.
The structure of the thesis is as follows. The sections of chapter 1 give a general introduction to silicon oxidation and a survey of existing results on oxygen species
in crystalline and amorphous Chapter 2 describes the methods. In chapter 3, I discuss the general properties of Si02 networks and the generation of defect-free
reference structures for a — quartz and amorphous silica. Chapter 4 describes the properties of oxygen species in a — quartz and formulates the initial conclusions for
silicon oxidation. In chapter 5, the properties of oxygen species in the amorphous
sample are calculated. In chapter 6, I investigate the origins of the big spread of energies for the interstitial oxygen atom in silica. In chapter 7, I analyse the
mechanism of oxygen molecular diffusion in a —S i0 2 and its link with the amorphous
topology. Chapter 8 compares the results obtained in o; — quartz and a — SiÛ2 and
combines them together to reach the conclusions for silicon oxidation.
1.1
Basic processes o f silicon oxidation
The semiconductor industry is still dominated by silicon technology and relies on
oxidation to produce the gate dielectric [1]. Yet, the understanding of atomic-level
process of silicon oxidation is by no means complete. The different aspects of silicon
oxidation are discussed in comprehensive recent reviews [2, 3, 4] and ref. [5]. The
following sections will concentrate on the most important issues related to the nature
of oxidising species.
It is established by isotope substitution experiments, both indirectly during sequen
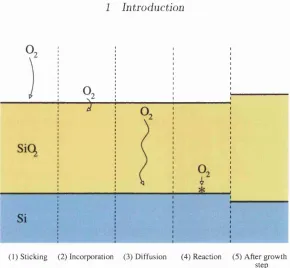
(1) Sticking (2) Incorporation (3) D iffusion (4) Reaction (5) After growth step
Figure 1.1: Four potentially rate-limiting processes of silicon oxidation on the ex ample of oxygen molecule being the oxidising species: (1) sticking of the molecule to the surface, (2) incorporation, (3) diffusion through the silica film, (4) reaction with silicon. Processes may be more complicated than shown, for instance, the diffusion may involve change of charge state or/and dissociation of the molecule. At the right of the figure, an overall result of the growth process is shown; the Si/oxide oxide interface has moved and the oxide has thickened.
substitution [10], that the diffusing species during silicon oxidation is oxygen. Sili con is shown to be immobile, in the sense that it does not diffuse across the growing oxide to react with oxygen at the gas/oxide. A small-distance diffusion of some
silicon atoms (no more than 1 nm) into the oxide cannot be ruled out on the basis of the present experimental data.
Knowing that it is oxygen which diffuses through silica to react with silicon at the
Si/oxide interface, it is possible to analyse silicon oxidation in terms of independent processes, which are distinguished due to their potential to influence the oxidation rate. Figure 1.1 shows four basic and potentially rate-limiting processes of oxidation
on the example of the oxygen molecule being the oxidising species. The processes can be more complicated than shown. For example, the molecule can change its charge state or/and dissociate into atomic species.
1 Introduction
diffusing through the oxide due to lack of significant isotope exchange in the bulk
of silica film during oxidation; see for instance Lamkin et al [11] who provide an
in-depth review and discussion of the oxygen transport processes in silica materials.
However, in the sequential oxidation experiments, using for example a sequence
of ^®0 2, and ^®0 2, significant isotope exchange is observed in the regions of gas/oxide and Si/oxide interfaces.
The exchange at the gas/oxide interface is deduced from the following observations.
In a sequential oxidation experiments (oxidation in ^®Ü2 followed by oxidation in ^^0 2), there are high concentrations of ^®02 at the gas/oxide interface. After a reoxidation in ^®0 2, the concentrations of ^®02 decrease. This can be explained if it is assumed that exchange occurs more readily where there are broken S i — 0 bonds and
regions of non-ideal stoichiometry. Oxidation is a dynamic process and the resulting
structure is not an equilibrium one, as proved by the observed structural relaxation during annealing [12]. Therefore, it is most likely that the surface layers do not have the ideal stoichiometry, which is difficult to obtain due to the constraints imposed by
the topology of silicon substrate and the four-fold tetrahedral coordination of silicon atoms in silica required for the ideal stoichiometry.^ Indeed, recent experiments
discovered paramagnetic point defects close to the gas/oxide interfaces, called EX
centres, which have not been observed in vitreous silica and do not have a clear
atomistic model yet. Their concentration can be as high as 3 * 10^® cm“^ close to the interface and extends up to 4 nm into the oxide decreasing with the depth (for
20 nm thick thermal oxide) [14].
The interpretation of the observed isotope exchange close to Si/oxide interface is
more problematic. In sequential oxidation experiments (oxidation in ^^6)2 followed by oxidation in ^^0 2), the oxide closer to the silicon substrate is made of ^*0 2.
However, there is a transition layer up to 2 nm in width with a mixed isotope
content. Moreover, after the third oxidation step in ^^02 there is a net loss of total
content of ^®02 in the bulk of the SiÛ2 film. This behaviour is observed for both
thin and thick oxides.
It is believed and will be confirmed by the calculations of this work, that the in
terstitial mechanism of oxygen molecular diffusion in silica makes the exchange of
oxygen atoms between the molecule and the non-defective S i0 2 network unlikely,
except for defect sites or substoichiometric regions. Therefore, the simple picture of
silicon oxidation in which molecules diffuse through to react at the interface, shown
in Fig. 1.1, cannot fully account for the findings of isotope exchange experiments.
1.2
Kinetics o f silicon oxidation
In the previous section, I presented the basic oxidation steps (Fig. 1.1). The oxi
dation rate can be limited by one or more of the steps. The most used theoretical
framework for analysis of silicon oxidation kinetics is the reaction-diffusion model.
The model assumes two types of rate-limiting processes: the diffusion of the oxidant
through the silicon dioxide film from the gas/oxide interface towards the Si/oxide interface without reacting with the silica network, and a first-order reaction of the
oxidant with silicon at the interface.^
The original solution of Deal and Grove [15] was obtained for the molecular oxygen
as the oxidising species with the assumptions of constant diffusivity of the oxidant,
constant reaction rate at the interface, sharp Si/oxide interface and a steady-state
process. The result is a linear parabolic law of the oxide thickness time evolution
where X is the thickness of the oxide film, t is time, and kp, kp and r are constants.
The parabolic constant kp is proportional to the diffusion constant of the oxidant
and the linear constant kp is proportional to the reaction rate at the interface. The
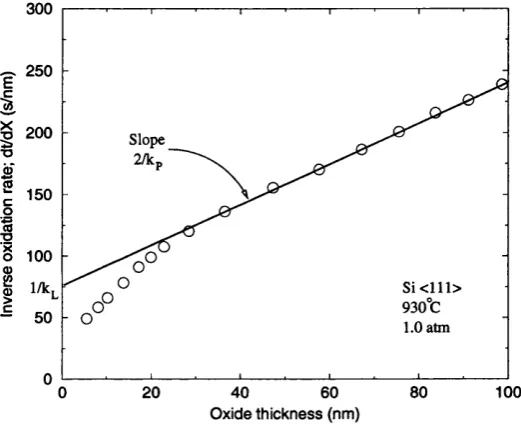
comparison between the experimental data and the model is facilitated by the inverse
growth rate ^ as a function of the oxide thickness X . Typical experimental data
are shown in Fig. 1.2. The deviations of the experimental data from the relationship
predicted by the Deal-Grove model for the thinner oxide film are typical for oxidation
in dry oxygen. Equation 1.1 is capable of describing the kinetics of thermal oxidation
1 Introduction
300
^ 250
â
^ 200
I 150
I
0 1001 i/k,
- 50
S i < l l l > 930°C 1.0 atm
100
20 40 60
Oxide thickness (nm)
for thicker oxides (> 30 nm) for a range of higher oxygen partial pressures (> 10^
Torr) and higher temperatures (> 800°C). The original assumptions of Deal and
Grove are not fully consistent with the results of isotope exchange experiments,
discussed in the previous section. The model can still properly describe the kinetics
of oxidation phenomenologically, though, if the right rate-determining process for the
given thickness regime is included. The analysis of the solution, eq. 1.1, shows that the kinetics in thick regime is determined by the diffusion of the oxidant. Indeed, the
parabolic constant rates obtained during fitting of eq. 1.1 to experimental data are consistent with the solubility and diffusivity of molecular oxygen in vitreous silica
(as quoted in ref. [3, 11]). The kinetics for thin oxides within the reaction-diffusion model is limited by the interfacial reaction rate.
It is apparent that in the different thickness regimes different processes can con
trol the oxidation kinetics. The regimes of oxidation can be divided (somewhat arbitrarily) into:
• very early stages (0-1 layers); surface chemistry plays an important role • ultra thin oxide (up to 10 atomic layers); diffusion is not rate-limiting • thin oxide (< 30 nm); diffusion becomes increasingly important
• thick oxide (> 30 nm); kinetics is diffusion-limited
The deviations in the thin regime can be modelled in many ways. Within the
diffusion-reaction picture, for instance, they can be interpreted as a decrease in dif
fusion rate and an increase in the interfacial reaction rate. Many models attem pt to
reproduce the experimental kinetics for the whole range of thicknesses by relaxing
one or more of the original assumptions of Deal and Grove. Others consider addi
tional processes like injection of S i interstitials from the substrate into the growing
oxide, postulate different oxidising species, invoke strain, etc. (see for example ref.
[17] and the references therein). Kinetics data alone do not suffice to discriminate
between different models. A successful model of oxidation has to be consistent with
a range experimental results in the different regimes. The next section will con
I Introduction
1.3
Experimental results
Experimental results on isotope exchange at the gas/oxide and Si/oxide interfaces
have been already discussed in sec. 1.1. They are crucial for understanding of silicon
oxidation.
The growth in the thin regime shows very characteristic features: the growth pro
ceeds layer-by-layer [18] and the steps of initial silicon surface do not move during
oxidation [19]. This implies that the reaction between the oxidant and silicon takes
place on the terraces rather than steps. The roughness of the interface is reported to
oscillate with the thickness [20], consistent with the layer-by-layer mode of growth. The most recent works show also that the resulting interface is atomically abrupt
[21], (earlier works yielded results from atomically abrupt to 7 Â in width depending
on the experimental technique used and interpretation [22]).
For thicker oxides, interfaces with different roughness have been observed. The final
roughness of the interface is sensitive to the oxidation conditions and surface prepa ration. But most importantly, there have been reports of atomically flat interfaces
or interfaces with very small roughness, for example, ref. [23] quotes a root mean
square (RMS) roughness of 1.6 Â for 50 nm thick oxide; see also ref. [2] for a review of roughness measurements.
1.4
Alternatives to reaction-difFusion model
The reactive layer model was proposed by Stoneham et al [24] to explain trends
observed in the isotope substitution experiments (see sec. 1.1). The model pos
tulates a reactive layer which is developed at the early stages of oxidation and is
opaque to interstitial O2 due to its different structure related to the constraints of
the Si/oxide interface. Once the layer is formed, the reaction of oxygen molecules
would take place outside this layer rather than at the Si/oxide interface. For this
to happen. Si atoms might diffuse through the reactive layer to react with oxygen.
The new oxide layer would be non-reactive because it would be normal silica. The
data [3]. The width of that layer was estimated between 1.5 and 2.0 nm. Experi
ments performed later to test the model [6] concluded, however, that transport in the reactive layer must consist predominantly of oxygen diffusion. Such a possibil
ity was taken into account in the original formulation. An alternative mechanism
could consist of an interstitial diffusion until the molecule reaches the reactive layer;
in the layer, the transport needs to proceed by a vacancy-assisted or an exchange
mechanism. The reaction now takes place at the Si/oxide interface and the function
of the layer is to force the change of transport mechanism, quite different from the
original formulation. The predictions of the model in this version are not the same
as that of reactive layer in the original formulation, though they are also consistent
with the experimental data on which the model was based. Interestingly, the pre
dictions of the new model are consistent with an even wider range of experimental
data, including recent high-resolution isotope substitution studies of thin-oxides [7]. There is little doubt that there is a compositional and structural transition layer
between silicon and bulk Si02- The features of this layer include some level of sub
stoichiometry, deviations of the Si — O — S i angle from that of bulk SiÛ2, different
oxide density, and roughness. The estimates of the transition layer thickness vary
between 0.2 and 1.6 nm (it should be noted that roughness, which is included in these estimates, is strongly dependent on processing conditions).
Alternatively, substoichiometric layers at the Si/oxide interface extending up to 2.0
nm into the oxide have been proposed to explain the isotope exchange trends close to this interface. Recent works, though, support rather flat interfaces, small rough
ness and thin transition layers with non-ideal stoichiometry [21, 1]. It has been
experimentally estimated that the limit for thinnest gate thickness of MOSFET
(metal-oxide-semiconductor field-effect) transistor is about 1.2 nm [1]. This would
not be possible if the substoichiometric regions in the oxide were thicker than one
monolayer of SiÜ2 in this thin oxide regime. Hence, the existence of substoichio
metric layers cannot fully explain the isotope exchange observed during the growth
of thin S i/S i0 2 structures.
It is difficult to accept that truly random processes (sticking, incorporation, diffu
sion) can result in an atomically flat interface. Some mechanisms are needed to promote selective or preferential growth at certain sites, resulting in a flat interface
or at least low roughness. In the thin-oxide regime, it was proposed [25] that charged
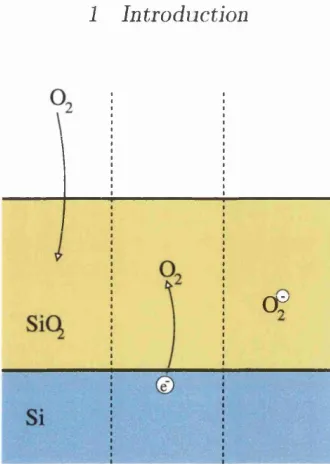
1 Introduction
œ
Figure 1.3: Charging transfer from silicon to the incorporated oxidising species close to the Sijoxide interface. These mechanism leads to a change in the transport mechanism within the tunneling range from the interface.
boundary between two dielectric materials can bias sticking and/or incorporation probabilities. Monte-Carlo calculations have shown for the first few layers of oxide that the assumption of charged oxidising species with the image interactions taken into account lead to layer-by-layer growth, roughness oscillating with the oxide film thickness and character of the kinetics consistent with experiment [26]. The model does not specify how exactly the charged species are formed. During thermal ox idation, electron tunneling from silicon is a likely possibility. Experimentally, the tunneling across oxide starts becoming important for thicknesses below about 3 nm
[27]. The tunneling rate has been shown to increase by by 6-7 orders of magnitude when the thickness of oxide layer is decreased from about 2 to 1 nm [1].
In the thick-oxide regime, the idea of charge transfer can naturally lead to agree ment with the observed features. If an interstitial oxygen species (for instance a
neutral molecule) can capture a charge close to the Sijoxide interface, the change of the diffusion mechanism will naturally occur within the tunneling range (1-2 nm) from the interface, as postulated by the modified reactive layer model. This situ ation is shown in Fig. 1.3. Moreover, the molecular species could dissociate upon
the electron capture. The detailed knowledge of diffusion mechanism with the em phasis on the tendency to exchange atoms with S i0 2 network is necessary to make
ative energetics of potential oxidising species, their electron affinities and diffusion
mechanisms in a — S i0 2^
1.5
Existing results on oxygen species in silicon
dioxide
Most of the as-manufactured silicas are either oxygen-deficient or contain negligible
concentrations of interstitial oxygen species (< 5*10^^ cm~^) [28]. Hence, the exper
imental information on the oxygen-excess defects in S i0 2 materials is quite limited
compared with the amount of data on oxygen-deficient centres [29]. For instance,
methods of identification of interstitial molecular oxygen has been only recently
developed, whereas oxygen interstitial atoms remain still elusive and there is only
indirect experimental evidence of their presence [28]. Some of the spectroscopic
features of laser-irradiated oxygen-rich a — SiÛ2 were associated with interstitial
ozone molecules [30] but this interpretation is still disputable. An important feature
of oxygen in silicon dioxide is that interstitial species can be formed in radiation processes by ejecting the S i0 2 network oxygen atoms from their normal sites, and
hence much of the experimental work concentrates on neutron- or proton-irradiated
samples.
The concentrations of oxygen molecules in the natural and synthetic a — quartz
are undetectable by present experimental methods (< 5 * 10^^ cm~^). Interstitial
molecules in a —quartz were observed only after neutron-irradiation. In contrast, in oxygen-rich silica material Suprasil W, the natural concentrations of the interstitial
molecules reach 10^® 0 2i per cubic centimeter, which corresponds to the average dis
tance of 100 Â between the incorporated molecules. In the other types of amorphous silicas, interstitial molecules are observed after neutron [31] or proton irradiation [32].
Interstitial molecules are believed to be the dominant species diffusing through silica
materials up to the temperature of about 1300°C, at which appreciable exchange of oxygen between the molecules and the Si02 network is observed [11]. The reported
activation energies for molecular diffusion are centred at about 1.1-1.2 eV with a significant spread of values.
1 Introduction
in a — quartz. In particular, Hagon et al [33] calculated the diffusion path of
02i in a cluster of a — quartz structure within CNDO approximation neglecting
the relaxation effects. Heggie et al. [34, 35] calculated the incorporation energies
and diffusion barriers for an interstitial oxygen molecule in a cluster model using
empirical potentials and LDA calculations with minimal basis set. Again in the
ab-initio part of their work, the relaxation of the crystal structure was not fully
included. These works show that the stable sites for the molecule are in the middle
of structural channels of a — quartz. The latter work yielded a diffusion barrier of
0.1 eV, an order of magnitude smaller than the experimental activation energies for
diffusion in amorphous silica.
The basic properties of interstitial oxygen atoms have been investigated theoretically
by Hamman [36] who obtained one stable configuration of Of and the diffusion
barrier in a — quartz using DFT GGA technique and a small 27-atom periodic unit
cell. Pacchioni et al. [37] calculated the incorporation energy of atomic oxygen into a small Si02 clusters at HF/MP2 level. The feature common for all these
works is a not fully satisfactory treatment of relaxation effects (either by use of
a small cluster or a small supercell). The results of these calculations show that the interstitial oxygen is not stable in the voids of the crystal structure and forms
exothermically a peroxy linkage [Si — O — O — Si complex). Direct experimental
confirmation of the presence of interstitial atomic oxygen in silica materials is still
absent. The existing experimental evidence is only indirect [28]; peroxy linkages are
believed to be responsible for exclusive generation of Si — OH groups (without the accompanying Si — H groups) during Tfg-treatment of oxygen-rich silicas through
the reaction S i — O — O — Si H2 — ^ Si — O — H -I- H — O — Si.
Some of the spectroscopic features of laser-irradiated oxygen-rich Si02 were associ
ated with interstitial ozone molecules. The production process of ozone suggested in
[30] consist of photodissociation of interstitial oxygen molecules to form a compara
ble concentration of ozone molecules.^ I have found no previous theoretical results
for interstitial ozone in either a — quartz or amorphous silica.
To best of my knowledge, no results have been reported for oxygen species which
address the site-to-site-variations of defect properties in amorphous S i0 2 at this level
of theory. There has been an attempt to calculate an interstitial atom geometry in
a — Si02 [38], though only a very limited number of configurations was calculated.
Previous work usually concentrated on one form of oxygen and did not compare
different interstitial species within one theoretical framework. The exception is ref.
[39] which concluded th at transport mechanism in silica should proceed through
ozonyl linkages [Si — O — 0 — 0 — Si complexes). This mechanism would lead to an
extensive exchange of oxygen between the diflFusing species and the silica network,
which is in complete disagreement with experimental isotope results. The reason
for the discrepancy between theoretical predictions and experimental results is the
combination of the use of a — quartz to mimic silica and calculations in a small cluster model which neglects the longer-range strain effects (see chapters 6 and 7 for more details).
It is apparent that the existing theoretical results are fragmented and often incom
plete. There are no reliable comparisons of properties of different species within one
theoretical framework. Neither the properties of interstitial ozone nor of charged species have been calculated previously. Most work assumes that a — quartz is a
good mimic of amorphous silica and none of the existing work addresses the influ
ence of static disorder on the defect properties in a — Si02- This is despite the
obvious observed differences in solubility and diffusivity of oxygen in a — quartz and
amorphous silica. Hence in this thesis, I will focus on all potential oxygen species
and comparison of their properties within one theoretical framework. I will generate
a representative model of amorphous silica and investigate the differences in defect
properties between a — quartz and a — Si02- The origins of these differences will
2 Techniques
In this chapter, I describe the theoretical methods and the technical details of the
calculations. The different aspects influencing the accuracy of the Density Func
tional Theory (DFT) plane-wave method and its overall accuracy are discussed. I deflne the incorporation energies and electron affinities for neutral and charged po
tential oxidising species within the grand canonical ensemble formulation. I combine
the experimental data on the band structure of an interface (in context of silicon oxidation, the Si/oxide interface) with the periodic-boundary DFT calculations of
bulk processes (here in bulk S i0 2) to include charge transfer across the interface.
This makes possible practical calculations of charging of oxygen species during sil
icon oxidation, where the process takes place in the bulk S i0 2 but the electrons
come, for instance, from the conduction band of silicon at the Si/oxide interface.
2.1
T he Density Functional periodic-boundary
m ethod
The electronic structure method used in this work is based on standard Density
Functional Theory (DFT) [40] in Kohn-Sham formulation [41]. I use the VASP
code (Vienna Ab-initio Simulation Package) [42, 43] with plane-wave basis set for
representation of the wave functions. It has been shown for the Si02 systems that
Generalised Gradient Approximation (GGA) to the exchange-correlation functional is necessary to reproduce the experimental stability of different phases, including
differently-coordinated phases [44]. The change of coordination is important for the
order of ionic-covalent materials, attributed to the delicate balance between the
ionic and covalent character of bonding [45]. Silicon dioxide falls into this category
of materials. Therefore, I use the gradient-corrected Perdew-Wang 91 (PW91-II)
exchange-correlation functional [46, 47] that is recommended by ref. [44, 45]. The
calculations include valence electrons only and the atomic core regions are repre
sented by untrasoft pseudopotentials [48] for oxygen atoms, and norm-conserving
ones [49] for silicon atoms, as supplied by Kresse and Hafner [50].
For charged systems a uniform neutralising background is employed. In this case,
the total energy convergence with the size of supercell is slower than for neutral
systems due to the interaction of the neutralising charge with the lattice of charges
localised on the defects. The energy of this interaction (Ecorr) can be approximated
assuming that the defect charges are point-like, as discussed in ref. [51]. Its value
depends on the Madelung constant a, the size of the system L and the dielectric constant e of the host material. The total energy of the system is than corrected
by subtracting Ecorr from the DFT periodic unit cell result. For calculations in
a — quartz^ I take e to be 4.56 which is a geometrical average of the experimental
dielectric constants along different axes of the crystal [52]. For amorphous material, I use the experimental value of 3.9 [53]. Studies of energy convergence with the
size of the supercell for 27-, 36-, 54-, and 72-atom a — quartz cells with different
defects incorporated show that the energies corrected by Ecorr, eq. 2.1, approach the limiting value from above when increasing the size of the system.
The calculations in the 72-atom supercell are made with F —point Brillouin zone
sampling. For a — quartz this suffices to converge the total energy of the system
within 0.02 eV per supercell with respect to the k-point set. The same accuracy was
chosen for the convergence of the total energy with the plane-wave cutoff energy for
the expansion of wave functions. In all the calculations with fixed supercell vectors,
the cutoff of 400 eV was used. For the volume and lattice vectors relaxations, I use
2 Techniques
2.2
Atomic relaxation and transition-state search
m ethods
The Conjugate Gradient (CG) energy minimisation procedure is employed for the
atomic relaxations. For the transition state search, I use two methods. In simple
cases, I reverse the force along the direction in the multi-dimensional configuration
space joining the two minimum energy geometries on both sides of the saddle point,
and drive the trial geometry towards the transition state using a semi-Newtonian
relaxation algorithm implemented in VASP. This method relies on good approxima
tion to the transition state direction and has to be used with care. For complicated cases, I use the Ascending and Descending Valley Points Method [54]. This method
requires finding a local energy minimum on a hyper-sphere in a multi-dimensional
configuration space. I combined the original algorithm with a Conjugate-Gradient-
style energy minimisation, which utilises not only the energy but also its gradients, to perform efficiently the constrained search for the minimum energy configuration (on
a hyper-sphere). The knowledge of the two minimum-energy geometries is required
to find the transition state. A trial geometry is chosen in between the two minima
but closer to one of them. The distance between this trial geometry and the other minimum geometry (a centre geometry) is constrained in the multi-dimensional con
figuration space and the energy minimisation (on a hyper-sphere) is performed to
yield a point along the valley ascending to the transition state, as shown on Fig. 2.1.
It is possible, in this way, to approach the transition state from both sides by moving
the centre geometry to the new point in the valley and choosing a trial geometry
on the other side of the transition state. The method gives approximations to the
transition state geometry on both sides of the saddle point. The vector connecting
the two geometries gives a good approximation to the transition state direction and
the first algorithm can be used to obtain the accurate geometry of the transition
state. All relaxation procedures were terminated when forces on atoms were smaller
2 Techniques
2.3
Molecular Dynam ics
All molecular dynamics (MD) calculations are performed with the Verlet algorithm,
which conserves total energy during the simulations. The shape and volume of the
supercell are kept fixed. The initial velocities are chosen randomly according to the
Maxwell statistics for a given initial temperature of the system. The time step of 0.5
fs ensures good total energy conservation. For some of the DFT molecular dynamics
runs at 300 K a time step of 1.0 fs is also used. In the empirical-potential molecular
dynamics calculations of chapter 3, the equilibration of the system is achieved by
keeping the temperature approximately constant. This is done by rescaling the ve^»
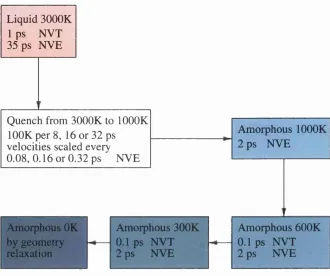
locities at constant time intervals. Also, during the quench procedures, the velocities
are rescaled at given intervals to decrease the temperature.
2.4
A tom ic and molecular oxygen as reference
sta tes
Oxygen is one of the most difficult atoms to treat within Density Functional Theory. Fortunately, the problems arise mostly for the ground state of the free oxygen atom.
Its DFT lowest energy solution is a triplet state, with highly non-spherical charge
density. The solution is very sensitive to the details of calculation. Paradoxically,
chemically-bonded oxygen is much more symmetrical and the DFT solutions for
molecules, solid-state and defects are much more accurate than that for the free
oxygen atom [55]. In calculating total energy of the neutral oxygen atom, care must
be taken for the symmetry of the solution; for instance, the energy difference between
an atom in a cubic and an orthorhombic unit cells (both results converged with the
size of the cell) is 0.34 eV. The calculated electron affinity of an oxygen atom in
a broken-symmetry triplet spin-state is 13.35 eV, as compared with experimental
value of 13.61 eV. The electron affinity of an oxygen atom is 1.69 eV, whereas the
experimental value is 1.46 eV. The calculated figures depend on energies of both
the charged configuration and neutral atom and, as such, also reflect the error of neutral atom energy. They are in agreement with results of previous calculations
molecule in a triplet state is 5.88 eV (with respect to two free atoms in a broken
symmetry triplet state). The 15% overestimation of the binding energy for the
oxygen molecule is a well-documented feature of the PW 92-11 functional [56], and
is usually attributed to the its tendency to overestimate binding energies for small
molecules. However, it can be also interpreted as the result of overestimation of the
total energy of the neutral oxygen atom. In fact, assuming the energy of oxygen
atom to be lower by 0.23 eV brings the electron affinity and the ionisation potential
to excellent agreement with experimental results, and leads to an improvement of the binding energies for a range of molecules involving silicon and oxygen. From
this perspective, it is advantageous to use the free oxygen molecule for reference energies rather than an oxygen atom. Indeed, the incorporation energies of defects
calculated with respect to oxygen molecule will be free from the DFT problems with
the ground state of oxygen atom and they were shown to be much less sensitive to
a particular choice of exchange-correlation functional [57].
2.5
Accuracy o f the DFT m ethod
There are many factors influencing the accuracy of DFT energies. The precision
of calculations and the errors associated with the the cutoff energy for the plane-
wave expansion of the wave functions are small, less than a few hundredths of an electronvolt. The error due to the Brillouin zone sampling was shown to be
of similar order for a — quartz. The most important factors are the size of the supercell, especially for the charged systems, and the accuracy of the functional
itself. Therefore, it is difficult to give the precise accuracy of the method. The energies for neutral system will be more accurate than for charged systems and the
accuracy decreases with the square of excess charge in the system (due to the use
total of energy correction, eq. 2.1). A safe assumption would be that errors of the ’absolute’ DFT energies could be as big as a few tenths of an eV for neutral systems,
and bigger for charged systems. However, the relative energies should be more
accurate with a partial cancellation of errors taking place due to the well-deflned
trend to overestimate the energies for charged species (see sec. 2.1). Therefore, the overall accuracy is fully satisfactory, as this work is mainly concerned with
2 Techniques
of an eV alter neither the trends, nor the final conclusions.
2.6
Definition o f incorporation energy and
electron affinity
In this work, I will not model the S i/S i0 2 interface explicitly. I will use a peri
odic model of Si02 to simulate the amorphous layer on silicon. The excess oxygen
molecules will be incorporated from a reservoir of molecular gas. The transfer of
the electrons from the interface will be modelled by a reservoir of electrons with a
given energy. The periodic model of Si02 without or with incorporated species in
a given charge state will be referred to as the S i0 2 system.
The physical system considered in this thesis requires the formalism of the grand canonical ensemble. During dry oxidation (by molecular oxygen gas) the Si02 layer
is in contact with the gas and therefore the oxide layer can be considered as being
in contact with a reservoir of molecular oxygen gas with chemical potential fi[0 2g\.
By analogy, the electrons which can charge the oxidising species are assumed to
come from the bottom of the silicon conduction band at the S i / S i0 2 interface and
hence the S i0 2 system is considered as being in contact with reservoir of electrons
with chemical potential corresponding to the conduction band of silicon. The
grand canonical ensemble formalism for defect formation energies is well established and particularly widely used for defects in semiconductors. The approach defined
below is similar in spirit to references [58, 59]. However, since silicon oxidation is
not an equilibrium process, a slightly modified approach is more convenient. The
total energy, Etot{f,n), of the S i0 2 network with incorporated excess of / oxygen
molecules and n electrons can be defined as
Etotif^n) = Es y s ( f , n) - f fi[02g] - n/z[e"j, (2.2)
where Esys (/, n) is the internal energy of the system calculated with the periodic
boundary DFT approach. The energy defined in such a way has a particular zero
reference level which depends on the reference level of the DFT method and the
is necessary to define the initial state of the S i0 2 system, or in other words, the
reference system. It is natural to choose the ideal non-defective Si02 network at
minimum of its internal energy, i.e., in the fully relaxed geometry (atomic positions
and supercell vectors). In the notation of eq. 2.2, the total energy of the reference
system is
Eref = Etot{0, 0) = Eays{0, 0). (2.3) The incorporation energy is the difference in total energy between the system con
sidered (with incorporated species in a given charge-state) and that of the reference
system
Eincifif^) = E t o t { f , n ) — Eref = Esys(f ,Tl) — {Esys{0, 0 ) -h f fl[0 2g] + n fi[e ]}. (2.4)
For incorporation of a molecule, / takes the value of 1; n is equal to the negative
charge localised on the molecule. The interpretation of the incorporation energy is clear. This is the change in total energy of the system when first the molecule is
incorporated from the gas phase to the bulk of S i0 2 and secondly n electrons are
transfered from the reservoir and localised on the species. For incorporation of a atomic oxygen, / takes the value of | and n is equal to the negative charge. The pro
cess behind the definition of incorporation energy involves transfer of the molecule
from the gas phase, its dissociation into two atomic species and a transfer of the
required negative charge to each of the atomic species. Note that the incorporation energy describes the change in total energy of the system during this process per
one atomic species. A positive incorporation energy means an endothermie process,
whereas a negative incorporation energy indicates an exothermic one. Note also
that the thermodynamic meaning of incorporation energy is the internal energy of
formation (constant V, S) at temperature of absolute zero. At this temperature,
it is equal, however, to enthalpy of formation (constant P, S), Gibbs free energy of
formation (constant T, P), and Helmholz free energy of formation (constant V, T)
[60).
I shall use the vertical electron affinity of a system with f excess oxygen molecules
and n electrons, Eaf f ( f , n) , as a change in the total energy upon electron capture
with the atomic positions constant
2 Techniques
where the superscript UnRel indicates that the atomic positions were not relaxed
after the electron localisation. Equation 2.5 can be rewritten as
Ea f f i f , n) = E, y , i f , n) + n[e-] - E%^‘^ ( f , n + 1). (2 .6 )
A positive electron affinity means a lowering of total energy upon electron capture,
whereas a negative electron affinity means that after electron transfer from the
reservoir to the species, the total energy of the system is increased. If an electron
cannot be localised on the species the system has no electron affinity. The values for
incorporation energies and electron affinities can be readily adjusted to any other source of electrons.
2.7
Practical modelling o f th e
Si02
system in
con ta ct with oxygen gas and reservoir of
electrons
To calculate the incorporation energies and the electron affinities, it is necessary to
know the chemical potentials of oxygen gas and of electron source. The chemical
potential for oxygen in the gas phase affects the absolute values of incorporation
energies, but not the relative stabilities of different species incorporated into the bulk of the host material. The energetics of processes which preserve the amount
of excess oxygen in the system (i.e., dissociation) do not depend on this chemical
potential. Electron affinities are also insensitive to its value. Additionally, the
chemical potential for oxygen molecules in the gas phase is not known exactly.
Therefore, in this work, I will approximate the chemical potential of oxygen molecule
in the gas phase by the energy of a free oxygen molecule in its lowest-energy triplet
spin-state, E[02g]. This energy can be evaluated accurately within the periodic
boundary DFT method.
The accurate estimation of the chemical potential for the electron source is more
important in this work. Again, the energetics of any process preserving the charge
will not depend on this chemical potential. However, charging of the species, which
system. Hence, both comparison of energies of species in different charge states and
the electron affinities are sensitive to the chemical potential of the electron source.
The energy of an electron at the bottom of silicon conduction band can be esti
mated with respect to the S i0 2 valence band using the experimental valence band
offset at the S i/S i0 2 interface (4.6 eV) and the bandgap of silicon (1.1 eV) [61, 62]. The experimental information about the interface can be combined with the DFT
calculations to yield the chemical potential for the source of electrons in the com
putational scheme used here.
The zero of the chemical potential scale is determined by the periodic boundary DFT
method used (it depends on pseudopotentials, Ewald summation for the electrostatic interactions, etc.). In the VASP code the electrons in the reservoir have an energy
corresponding to zero on the Kohn-Sham eigenvalue scale (similarly, for instance, to
methods used in ref. [59]). This zero is a good reference level since it stays pinned
in the same position with respect to the S i0 2 valence band in all the calculations,
regardless of the defect and charge state considered (as a bonus, it shows that the system corresponds effectively to a point defect embedded in a non-defective S i0 2
network; a shift of the levels upon incorporation of a defect would indicate that
properties of the whole system are affected by the defect incorporation). I combine the experimental information with the DFT results on the valence band of Si02 to
yield the chemical potential of electrons in the reservoir {/i[e~]), as outlined in Fig.
2.2.
It should be noted that the model is approximate. The periodic boundary calcula
tions of this work include the oxide only. The interface is not modelled directly and
the image-charge interactions due to localised charges near the boundary between
two dielectrics [25] are not present in the model. Full treatment of this interactions
would lower the energy of charged species near the interface. The supercell calcu
lations do not include all of the long-range polarisation energy of an extended di
electric system.^ A model accounting for all of polarisation would favour the charged
![Figure 2.2: The use of experimental information [61, 62] and the DFT results on the Si0 2 valence band to estimate the chemical potential of electron reservoir at the bottom of Si conduction band](https://thumb-us.123doks.com/thumbv2/123dok_us/8610033.1399741/41.596.158.460.261.496/experimental-information-estimate-chemical-potential-electron-reservoir-conduction.webp)