• No results found

On Stock Market Dynamics through Ultrametricity of Minimum Spanning Tree

N/A
N/A
Protected

Academic year: 2020

Share "On Stock Market Dynamics through Ultrametricity of Minimum Spanning Tree"

Copied!
18
0
0

Loading.... (view fulltext now)

Full text

Loading

Figure

Figure 1: The distribution of correlation coefficients of traded stock price return in JSX2000-2004 (left) and the distribution of distances among stocks in the same period (right).
Figure 2:The moments of correlation coefficients ((left) and distances among stocksright) over time.
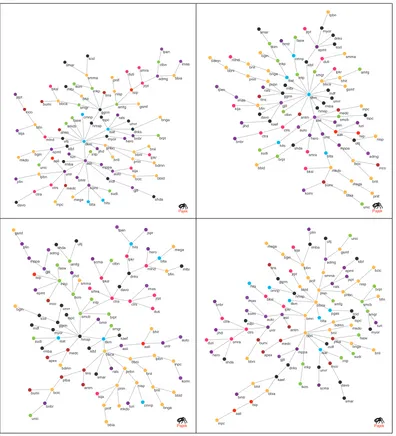
Figure 3: The minimum spanning tree of traded stocks in JSX in trading period 2001vertex represents the business sectors: agriculture ((top-left), 2002 (top-right), 2003 (bottom-left), and 2004 (bottom-right).The colors ofred), mining (maroon), basic industry(green), miscellaneous industry (purple), consumer goods industry (black), property andbuilding construction (pink), infrastructure and transportation (cyan), finance (orange),trade and investment (blue).
Figure 4: The hierarchical tree of clustered traded stocks in JSX in 2001-2004. The lettersin axis of each graph represents the respective business sector: ((a) agriculture sector,b) miscellaneous industry, (c) basic industry and chemicals, (d) mining, (e) financialsector, (f ) property, real estate, and building construction, (g) infrastructure, utilities,and transportation, (h) trade, services, and investment, and (i) consumer goods industry.Purple lines indicate basic industry and chemicals, black ones indicate consumer goodsindustry, and red ones financial and investment sector.
+4

References

Related documents

I used a series of count regression models to address the null hypotheses that overall bat activity (counts of bat echolocation sequences), bat feeding activity (counts of

107 However, in light of the fact that (1) anti-fraud provisions apply to publicly and privately traded companies, (2) Dodd-Frank allows private company whistleblowers to

Finally, we distinguish between different measures of local charging infrastructure (the effects of visibility , capacity and abundance of local chargers) to understand the

Title Aftershock activity of the 2015 Gorkha, Nepal, earthquake determined using the Kathmandu strong motion seismographic array.. Author(s) Ichiyanagi, Masayoshi; Takai,

Based in the examples of 19 th century French demography and British vital statistics, Schweber affirms “Henrietta Kuklick’s observation that disciplinary claims tended to be

valves in the Salvador record (Figure 4.1 0), absence of Cythridella boldii valves in Castilla (Figure 4.9), and the sharp decline in herbaceous pollen types in both

In each period, a firm chooses its quality-upgrade level to increase its product quality for the next period.. The firm also decides each period whether or not

Head of the Management and Strategy Department (Lille, Nice) (2005-2006) Deputy Head of the Management and Strategy Department (Nice) (2002-2005) Programme coordinator of the MSc