to phase contrast applications in the medical field
A. Olivo,a)F. Arfelli, G. Cantatore, and R. Longo
Dipartimento di Fisica, Universita` di Trieste e INFN, Sezione di Trieste, Via Valerio 2, 34100 Trieste, Italy
R. H. Menk
Sincrotrone Trieste ScPA, Strada Statale 14 Km 163.5, 34100 Trieste, Italy
S. Pani, M. Prest, P. Poropat, and L. Rigon
Dipartimento di Fisica, Universita` di Trieste e INFN, Sezione di Trieste, Via Valerio 2, 34100 Trieste, Italy
G. Tromba
Sincrotrone Trieste ScPA, Strada Statale 14 Km 163.5, 34100 Trieste, Italy
E. Vallazza and E. Castelli
Dipartimento di Fisica, Universita` di Trieste e INFN, Sezione di Trieste, Via Valerio 2, 34100 Trieste, Italy 共Received 20 November 2000; accepted for publication 30 May 2001兲
Recently, new imaging modalities based on the detection of weak phase perturbations effects, among which are phase contrast and diffraction imaging, have been developed by several research-ers. Due to their high sensitivity to weakly absorbing details, these techniques seem to be very promising for applications in the medical field. On the other hand, digital radiology is undergoing a wide diffusion, and its benefits are presently very well understood. Up to now, however, the strong pixel size constraints associated with phase contrast pattern detection limited the possibility of exploiting the advantages of phase contrast in digital radiology applications. In this paper, an innovative setup capable of removing the pixel size constraints, and thus opening the way to low dose digital phase contrast imaging, is described. Furthermore, we introduce an imaging technique based on the detection of radiation scattered at small angles: the information extracted from the sample is increased at no dose expense. We believe that several radiological fields, mammography being the first important example, may benefit from the herein described innovative imaging tech-niques. © 2001 American Association of Physicists in Medicine. 关DOI: 10.1118/1.1388219兴
Key words: phase contrast, diffraction, digital radiology, synchrotron radiation, image enhancement
I. INTRODUCTION
One of the main problems in diagnostic radiology is the low image contrast due to poor x-ray absorption differences. This limitation is particularly relevant in the field of mammogra-phy, where low contrast masses and small size microcalcifi-cations have to be detected. In the first case, relatively large objects having an x-ray absorption coefficient very close to normal tissue are studied; in the second case, the absorption coefficient difference is high共calcium versus soft tissue兲, but the extremely small dimensions of the calcified structures 共hundreds of microns or less兲 result in very poor intensity differences in the x-ray beam transmitted through the detail and immediately outside it.1–5In some cases, these obstacles result in limitations in terms of sensitivity as well as speci-ficity of the mammographic examinations.6
A solution to this problem consists in developing new detectors with extremely high contrast resolution. In this framework, very promising results have been obtained by means of single photon counting detector devices, like the SYRMEP/FRONTRAD 共SYnchrotron Radiation for MEdical Physics/FRONTier RADiology兲 detector prototype,7–10 or other similar devices.11 The ability of counting every single photon clearly maximizes the contrast
resolution in the images, since the only noise source lays in the intrinsic statistic nature of x-ray emission and absorption 共quantum noise兲.12–14This approach, however, while pushing further down the minimum detectable contrast threshold, still relies only on the absorption properties of the imaged object, and thus to some extent it is still subject to the limitations mentioned above.
nar-row angular region共10–100rad兲, and inside this region an interference pattern can be detected. An exhaustive descrip-tion of the interference pattern formadescrip-tion can be found in Refs. 25–26. The aspect that we want to stress here is the possibility of obtaining a very high image contrast also when imaging extremely low absorbing details, since the involved physical process is completely different and does not rely on x-ray absorption. Ideally, completely nonabsorbing details 共i.e., with exactly the same value ofas the background in which they are embedded兲may also be detected by means of this technique, if their␦value differs to some extent from the background value.
In order to apply the technique to diagnostic radiology, however, a few relevant problems have to be solved. First of all, since the interference angle is very small, it is impossible to place the detector device immediately behind the imaged sample: the sample-to-detector distance has to be increased in order to convert the small angular interference region into linear dimensions compatible with the detector spatial reso-lution. On the other hand, the finite source size results in excessive blurring effects 共which could smear the interfer-ence peaks兲 if this distance is made too large; thus, a com-promise between these counteracting effects has to be found according to the specific imaging requirements 共imaged sample characteristics, detector spatial resolution, radiation source dimensions, and so on兲. An example of sample-to-detector distance optimization, based on Fresnel–Kirchoff diffraction integrals evaluation, can be found in Ref. 22. The same reference demonstrates that, if the source size is too large, the phase contrast technique provides very poor image quality. Thus, extremely high spatial coherence sources are required for phase contrast imaging: namely, synchrotron ra-diation sources or microfocus x-ray tubes. Chromatic coher-ence is much less critical, and, in fact, phase contrast images have also been obtained by means of polychromatic sources.27Most of the works reported in the references, how-ever, are concerned with synchrotron radiation experiments, since with microfocus x-ray tubes phase contrast imaging requires extremely long exposure times共⬃ 2 h27兲due to the low emitted flux.
Even when high coherence sources are used, the detection of secondary interference peaks requires detectors with ex-tremely high spatial resolution: due to this fact, the first phase contrast experiments were carried out utilizing high resolution x-ray films or high resolution CCD cameras 共see, for instance, Refs. 15–16兲. The low detection efficiency of these devices, however, prevented clinical applications of the technique, due to the high radiation dose consequently deliv-ered to the samples. More recently, low dose phase contrast images were obtained by means of conventional film-screen systems:21–22 it was, in fact, observed that the convolution between the phase contrast patterns and the film-screen sys-tem point spread function preserves relevant improvements in the detected signal, especially in terms of edge enhance-ment. In this framework, effort is now directed toward a digital approach to low dose phase contrast imaging, since it would result in combining the well-known advantages of both phase contrast and digital imaging. In principle, this
would require a high efficiency, high spatial resolution 共tenths of m兲 detector device; but in most cases detection efficiency and spatial resolution are counteracting issues. Even though some other possibilities might have been inves-tigated共based, for instance, on the optimization of the scin-tillator coating and of the pixel size of a CCD camera, or on the development of appropriate flat panel devices兲, our expe-rience with the SYRMEP/FRONTRAD detector prototype encouraged us to search for a possible application of this device in the phase contrast field. Following this strategy, a relevant dose reduction can be provided by the very high detection efficiency 共⬎80% at 20 keV兲of the device, while at the same time the single photon counting capability of the readout electronics allows the detection of very small sig-nals. In order to check the feasibility of this approach, we first reduced the detector pixel size by means of a narrow, fully absorbing slit placed in front of the detector sensitive area. Then, a detailed analysis of the basic physical prin-ciples of phase contrast image formation enabled us to de-velop an innovative setup, which gives the possibility of removing—at least in one dimension—the pixel size con-straints, thus achieving low dose, single photon counting, digital phase contrast images.
Finally, it is important to underline that all the images that will be presented below have been obtained at relatively low 共17–22 keV兲photon energies. In this way, the phase contrast signal共due to␦兲is superimposed to the conventional absorp-tion signal共due to兲, and both contrast sources are exploited at the same time.
Another possibility might consist in highly increasing the beam energy. This would result in a strong reduction of the dose delivered to the sample, but also in an excessive de-crease of the absorption contrast with respect to the phase contrast signal共in other words, only the edges of the details would be detected兲. Our approach thus preserves all the fea-tures of conventional absorption imaging, while at the same time the visibility of all details is dramatically enhanced by the phase effects.
II. MATERIALS AND METHODS
A. The beamline
experimental room, a tungsten slit system, moved by micro-metric precision stepper motors, allows a precise definition of the beam cross section; the maximum available cross sec-tion is 100 共width兲 ⫻ 4 共height, FWHM兲 mm2. A larger monocromator crystal is currently under development: this device will provide us in the near future a wider beam cross section (150⫻4 mm2兲. The experimental room is equipped with a large area ionization chamber, which allows beam monitoring and thus delivered dose evaluation, a sample movement stage, and the detector prototype, which is de-scribed in the next section.
B. The detector
The SYRMEP/FRONTRAD detector prototype is a sili-con microstrip detector used in edge-on geometry, i.e., with radiation impinging on the side rather than on the surface of the wafer共see diagram 1兲. The dimensions of the wafer are
equal to 51.2共width兲⫻0.3共height兲⫻10共depth兲mm3. On one of the large surfaces of the device 256 parallel strips are implanted, and thus the device is subdivided into 256 inde-pendent cells, each one having dimensions equal to 0.2 共width兲⫻ 0.3共height兲⫻10共depth兲mm3. Therefore, in the edge-on geometry, the incoming photons impinge on an ar-ray of 256 pixels, the dimensions of which are determined by the strip pitch 共200 m兲in the horizontal direction and by the wafer thickness共300m兲in the vertical direction. Since the depth of the single detector cell is 1 cm, photons in the considered energy range共15–35 keV兲are nearly completely absorbed within the detector volume. Thus, an absorption efficiency practically of 100% is obtained. On the other hand, a thin undepleted entrance window is strictly necessary in order to preserve the detector noise performances; the depth of this ‘‘dead volume’’ is of the order of 150–200m. As a result, the overall detection efficiency of the device is of the order of 80% at mammographic energies.
The electronic chain reading out the signal, completely realized in VLSI 共Very Large Scale Integration兲technology, operates in a single photon counting mode. After a charge-sensitive preamplifier and several amplifying and shaping stages, a variable threshold discriminator and a scaler enable us to completely cut off the noise and count every single signal higher than the threshold for photon energies higher than 15 keV. Thus, only quantum noise is present in the acquired images, and image contrast is consequently maxi-mized.
A more detailed description of the detector prototype and readout electronics can be found in Refs. 7–10.
C. The imaging setup
As described in Sec. II, a highly collimated, 100⫻4 mm2 laminar monochromatic beam is available in the experimen-tal room: this beam is usually reduced down to ⬃512
⫻0.3 mm2 by means of the tungsten slits and kept station-ary during image acquisition. The detector prototype dis-cussed in the previous section is mounted on a two-axis mi-crometric precision positioning stage. In this way, the detector active surface can be carefully matched to the lami-nar beam cross section. Once this alignment is obtained, the detector is kept stationary with respect to the beam and the two-dimensional images are acquired by vertically scanning the sample through the beam by means of a micrometric precision scanning stage. Further details on the SYRMEP/ FRONTRAD imaging acquisition technique can be found in Refs. 28 –30. In order to perform phase contrast imaging it is not possible to place the sample in contact with the detector, but it is rather necessary to optimize the sample-to-detector distance. Following previous calculations22 and the simula-tions described in the next section, the sample scanning stage has been placed at a distance of approximately 1.8 m from the detector. Since the source-to-detector distance is slightly lower than 25 m, we obtain in this way a source-to-sample distance of approximately 23 m. This distance results in a high spatial coherence in the vertical direction 共 correspond-ing to the source dimension equal to 140m FWHM兲and in a lower coherence in the horizontal direction, where the source size is larger. In this paper we basically deal with optimizing the phase contrast image quality in the vertical direction, i.e., the direction along which the sample is scanned through the beam.
Nevertheless, as will be shown in the next section, very high overall image quality has been achieved with the de-scribed technique.
D. The simulations
Before the experiment was carried out, most of the ex-pected results have been simulated by means of routines spe-cifically developed for the purposes of the present work. In the next section nearly all the experimental results will be presented together with the simulated ones, and, as it will be seen, in all such cases a good agreement between simulation and experiment is obtained.
A precise evaluation of a phase contrast pattern can be made by means of Fresnel–Kirchoff integrals.25–26 In this way, the ideal image that would be obtained by illuminating the sample with a point source and by means of an ‘‘infinite’’ spatial resolution detector can be evaluated. Then, the use of a finite size source and of a finite resolution detector has to be taken into account: this can be done by means of convo-lution integrals. This approach has already been described in Ref. 22.
equations 共basically, the deflection angle is proportional to the gradient of ␦; see the quoted references for full formu-las兲.
In this way, the path of each photon emitted by the source and crossing the sample can be followed, similarly to what is done in ray tracing. This simulation receives in input the dimensions of the region from which photons are emitted 共the source size兲 and the area they must reach after having crossed the sample in order to be detected共the detector pixel size兲; thus, it is not required any convolution on the output signal.
Results obtained with this approximated technique have been compared to the ones provided by the more rigorous Fresnel–Kirchoff approach, and a good agreement was found.31 This is due to the fact that when Fresnel–Kirchoff patterns are convolved with a source size and a detector pixel that are not very small, all the fine features of the pattern, which constitute the main difference between the two ap-proaches, are lost. Thus, in most practical cases the two tech-niques give nearly the same results. This aspect will be made clearer when the first simulated patterns will be presented, at the beginning of the following section. As a last remark, it should be noted that by introducing the refractive index as a complex number (n⫽1⫺␦⫹i) in the simulations, both ab-sorption and phase contrast effects are taken into account in the patterns.
III. RESULTS AND DISCUSSION
A. Pixel size constraints
By means of the simulations described above, we first evaluated the effect of the detector pixel size on the phase contrast signal: the result is shown in Fig. 1. Figure 1共a兲 shows the ‘‘pure’’ interference pattern that would be obtained by illuminating a 100m diam nylon wire with a monochro-matic 共17 keV兲 point source. Figures 1共b兲, 1共c兲, 1共d兲, and 1共e兲show the same pattern acquired by means of a detector pixel having dimensions equal to 25, 50, 100, and 300m, respectively. The source-to-sample distance was 23 m and the sample-to-detector distance was 1.8 m, as occurs in the experimental conditions. As it can be seen, the convolution with the pixel size smears out the phase contrast pattern, and the larger the pixel the smaller the acquired signal. All the patterns presented in Fig. 1 have been obtained by means of the Fresnel–Kirchoff integral technique described above. Nevertheless, the paraxial approximation would have given almost the same results for Figs. 1共c兲–1共e兲 and would have reproduced to a very good approximation also Fig. 1共b兲. Only the pattern shown in Fig. 1共a兲would not be obtainable by means of the paraxial approximation; however, this kind of fine pattern cannot be acquired with our experimental setup.
As it can be seen from Fig. 1共e兲, very poor phase contrast images would be collected with the SYRMEP/FRONTRAD detector共pixel height⫽300m兲without applying the tech-niques described in the next sections. The signal in Fig. 1共e兲 is of the order of 1%, and thus it would not contribute sig-nificantly to the detection of details within a sample. Some
phase contrast images of nylon wires have been acquired with the 300m detector, and the detected signal was of the order of 1%, in agreement with the predictions of the simu-lation.
B. Pixel size reduction
In order to increase the phase contrast signal, it is thus necessary to reduce the pixel dimensions. The first attempt at pixel size reduction consisted in placing a copper mask in front of the detector device. The mask was obtained by carv-ing a 100m high, 5 cm long slit into a 0.7 mm thick copper foil. The thickness of the copper foil is large enough to guar-antee full absorption of photons in the considered energy range. Thus, when the slit is perfectly aligned with the center of the active surface of the detector device, the pixel size is effectively reduced from 300 共height兲 ⫻ 200 共width兲 m2 down to 100 共height兲⫻ 200 共width兲 m2. This fine align-ment was obtained by mounting the copper mask on a mi-crometric precision movement stage. The beam height was, of course, reduced accordingly, in order to avoid useless dose delivery to the samples.
With this set-up, i.e., with a pixel size equal to 100m in the scanning direction, a signal comparable to the one shown
in Fig. 1共d兲is expected. This signal is of the order of 10%: a relevant gain should thus be achieved with respect to con-ventional absorption imaging, which would give for the same object (a⬃100 m thick nylon wire兲a signal much lower than 1% in the energy range of mammography.
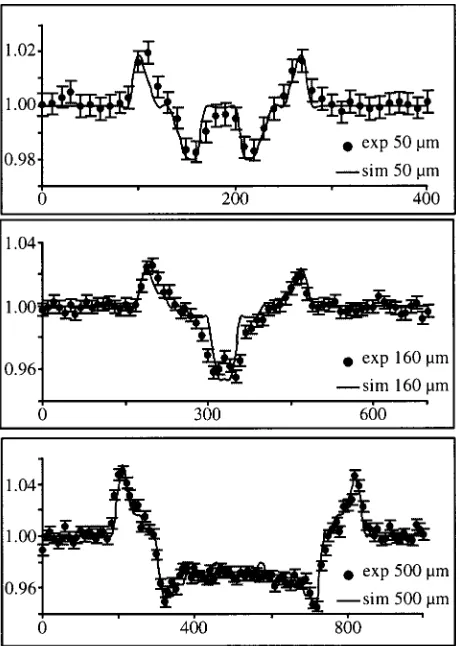
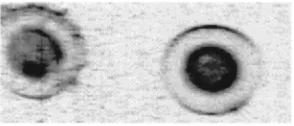
A demonstration of this fact is given in Fig. 2, which shows images of three nylon wires 共diameters equal to 50, 160, and 500 m兲 obtained at 20 keV with this setup: all wires are perfectly detected. In this case, a 10 m scanning step was applied. Figure 3 shows the experimentally mea-sured signal 共dots with error bars representing the quantum noise兲 together with the simulated one 共solid line兲 for all three wires.
In these plots, the relative intensity共i.e., intensity normal-ized to the background兲is reported as a function of distance along the scanning direction; and the signal, i.e., the contrast, can be directly read out on the vertical axis. This signal 共measured from peak to peak兲is equal to about 4%, 8%, and 11.5% for the 50, 160, and 500m wire, respectively. Note that the same wires at the same energy would result in a signal of 0.1%, 0.3%, and 1%共respectively兲in conventional absorption imaging: thus, a contrast increase of more than one order of magnitude is obtained in all cases by means of the proposed technique.
It should be noted that in this framework the contrast is more significant than the SNR共signal to noise ratio兲. In fact, since the detector operates in the single photon counting mode, the uncertainty on the number of counts is equal to the square root of the number of counts itself 共in all images of Fig. 2, the number of counts per pixel in the background
region was approximately 10 000, and thus in Fig. 3 the error bars are of the order of 1% for all wires兲.
This means that, given the contrast value, the SNR can be readily evaluated for any photon fluence. Generally speak-ing, the relevant aspect is the fact that here we are dealing with a physical process that provides increased detail trast, which is completely different from enhancing the con-trast by means of post-processing procedures共unsharp mask-ing, etc.兲. A low contrast results in a low SNR, unless the delivered dose is dramatically increased, and below some thresholds 共Rose criterion, for instance兲 no post-processing procedure can restore the detail visibility. The possibility of obtaining higher detail contrast in the original images means higher SNR at the same dose or the same SNR at a lower dose, despite any image processing. On the other hand, post-processing procedures might be applied to phase contrast images to further enhance the detail visibility.
C. The development of a new setup capable of removing the pixel size constraints
Even though the image quality that can be seen in Fig. 2 is impressive, this result just demonstrates that phase contrast imaging is feasible if the sample-to-detector distance is op-FIG. 2. Phase contrast images of nylon wires of different diameters obtained
by reducing the pixel size from 300 to 100m by means of a slit共see the text兲.
timized, if the source is sufficiently coherent and if the de-tector pixel is made small enough. Based on these prelimi-nary results, an innovative setup, capable of eliminating the pixel size constraints, has been devised.
First of all, we discuss in deeper detail the setup described in the previous section. It should be noted that, in this con-figuration, the photons impinging immediately outside the active surface of the pixel when the sample is not present 共see the arrow labeled 1 in Fig. 4兲, although responsible of a slight dose increase with respect to absorption imaging, where sample and detector can be perfectly matched, are of primary importance. When the sample is scanned through the beam, a fraction of those photons is deflected within the active surface of the pixel: this gives rise to the positive peaks in the phase contrast signal. Photons that impinge im-mediately within the active surface 共the arrow labeled 2, which refers to a portion of the beam height approximately comparable to the one falling outside the active surface兲have similar importance: when the object passes through the beam, a part of them will be deflected outside the active surface. In this way, the negative peaks in the phase contrast signal are originated. The same situation occurs on the other side of the pixel active area. This somehow implies that pho-tons impinging on the center of the detector active surface are useless: the deviation angle of the photons is, in general, so small共⬃10rad, as quoted above兲that those photons will impinge on the detector active surface also after their inter-action with the sample. That is to say, those photons just increase the background without a significant contribution to the signal.
This discussion is summarized in Fig. 5, where the dashed line represents the trajectory of the photon without the sample, while the solid line shows the photon deflection共not to scale兲due to the passage of the object. On the right-hand side, the resulting共simulated兲signal is shown. Three crucial sample positions are shown, and connected by arrows to the corresponding points in the signal; only one-half of the sample scan is schematized, since the situation is symmetric for the remaining part of the scan.
This analysis led us to the development of the second step of the new setup, shown in Fig. 6共a兲: in this configuration photons in the center of the beam have been eliminated. In this case, the original beam is split in two narrow beams by
a collimator: each narrow beam impinges on one of the de-tector active area edges. The collimator is placed upstream the sample, in order to avoid unnecessary dose delivery. Comparing the simulated signal shown on the right-hand side of Fig. 6共a兲with the one shown in Fig. 5, it is apparent that a relevant gain is acquired by means of this slight change in the set-up. Note that here we are referring to the relative intensity, i.e., the contrast: the discussion is thus in-dependent from dose and/or flux considerations, as discussed in the previous section.
But, apart from the signal increase, it is extremely impor-tant to notice that in this configuration the detector pixel size has lost any influence on the intensity of the detected signal: in other words, the extremely stringent共see Fig. 1兲pixel size constraints have been eliminated. If the detector pixel now becomes larger, one has to adjust the relative distance be-tween the two beams in such a fashion that they still impinge on the edges of the pixel active area, without changing the height of the beams themselves. In this way, the only change in the signal would be an expansion of the flat region in the middle of the signal. The intensity and the shape of the peaks, however, remain unchanged. Notice that at this point FIG. 4. Schematic of the setup used to acquire the images shown in Fig. 2.
FIG. 5. Schematic of the image formation principle for the images shown in Fig. 2共see the text兲, and simulated signal共right兲for a 50m nylon wire placed at 1.8 m from the detector and illuminated by 20 keV radiation.
the copper slit is completely unessential, and could thus be removed provided that the distance between the center of the two beams is increased from 100 to 300m.
The third and last step of the setup development arises from the fact that in most cases, while one of the narrow beams is impinging on a detail, the other one just increases the background, and vice versa. It follows then that even higher signals can be achieved by eliminating one of the two beams, and utilizing a single narrow beam impinging on one of the pixel edges 关see Fig. 6共b兲兴. In this case the symmetry of the signal is clearly broken, but two intense peaks, one positive and one negative, still reveal the presence of a detail within the imaged sample. As it can be seen from the right-hand side of Fig. 6共b兲, in this way a further gain in the signal is achieved, and the fact that the detector pixel dimension has no influence on the acquired signal is even more evident.
Another interesting aspect of this last setup lies in the fact that the narrower the incoming beam, the more intense the acquired signal. In fact, by narrowing the beam, the remain-ing photons are more easily deviated inside/outside the de-tector active surface when the sample is scanned through the beam. Thus, their contribution to the signal is much more relevant. Of course the beam intensity is increased accord-ingly, in order to preserve the number of detected photons per acquisition step avoiding an increase of the quantum noise. In a scanning acquisition modality, this results in a dose increase with respect to absorption imaging propor-tional to the fraction of the beam impinging outside the de-tector active surface 共this aspect will be discussed in more detail below, when images of the Ackermann phantom will be presented兲.
Figure 7 shows an experimental demonstration of the sig-nal increase due to beam height reduction. The same object 共a 160m diameter nylon wire兲has been imaged at 20 keV with a scanning step of 10 m utilizing a single narrow
beam, illuminating 80% 关Fig. 7共a兲兴, 60% 关Fig. 7共b兲兴, and only 15%关Fig. 7共c兲兴of the pixel. In all cases, 20m of the beam thickness fell outside the active surface of the detector 共i.e., on the copper mask, since for practical reasons we al-ways left the mask in its position after the careful alignment兲. The geometrical configuration is thus very similar to the one shown in Fig. 6共b兲, the only difference being the beam height 关which in this case is equal to 100, 80, and 35m for Figs. 7共a兲, 7共b兲, and 7共c兲, respectively兴. From these images the image formation mechanism is immediately apparent: one narrow white line 共the positive peak兲 and a black one 共the negative peak兲 underline the presence of the wire, and the contrast increases as the beam is made narrower.
This is more evident in Fig. 8, where the experimental points共dots with error bars兲are superimposed on the simu-lated signal共solid line兲. The relative intensity is plotted as a function of the spatial displacement in the scanning direc-tion, and the signal can be directly read out on the vertical axis. From top to bottom, plots correspond to Figs. 7共a兲, 7共b兲, and 7共c兲, and the acquired signal is of the order of 9%, 11%, FIG. 7. Images of a 160m nylon wire obtained at 20 keV with the
experi-mental setup shown in Fig. 6共b兲. By reducing the beam height from 100m 共a兲to 80 and 35m关共b兲and共c兲, respectively兴, the contrast increases共see the text兲.
and 40%, respectively. It should be noted once again that with pure absorption effects, a 160m nylon wire at 20 keV would result in a⬃0.3% signal共practically undetectable: for this reason the absorption image is not shown here兲. This means that with this setup we have obtained a gain in the intensity of the signal 共i.e., in the contrast兲higher than two orders of magnitude.
It is important to notice that the portion of the beam that impinges within the detector active surface is responsible for all the absorption signal as well as for the negative peaks in the phase contrast signal, while the part of the beam falling outside the detector provides the positive peaks in the phase contrast signal but does not contribute to the absorption sig-nal. Furthermore, as mentioned above, this part of the beam results also in a dose increase. Nevertheless, exploiting also the positive and not only the negative phase contrast peaks practically means doubling the signal in all those cases where absorption is negligible with respect to phase contrast, as clearly visible in Fig. 8.
D. Application of the technique to a standard mammographic phantom
The same technique was then applied to a conventional mammographic phantom 共Ackermann Phantom, RMI 160, Gammex, Middleton, WI兲. Figure 9 shows three details ex-tracted from the phantom images: simulated lymphonodes 共top兲, simulated tissue samples共middle兲, and simulated fibers 共bottom, within the ring兲. A complete description of the phantom can be found in Ref. 32. Figure 9共a兲 shows the absorption image of the phantom 共sample-to-detector dis-tance⬃ 0兲 and Fig. 9共b兲 the phase contrast image共 sample-to-detector distance⬃1.8 m兲obtained with the setup of Fig. 6共b兲 共but different beam height兲. The improvement in image
quality obtainable with the proposed setup is apparent. It is important to notice that the ‘‘noisy’’ appearance of Fig. 9共b兲 is not due to the proposed technique, but to the inner struc-ture of the phantom, which is granular. In other words, the proposed technique depicts correctly the structure in which the details are embedded, and thus this ‘‘granularity’’ should not be interpreted as image noise. This effect was already observed and discussed in Ref. 33.
As already pointed out in a previous work,30 the image quality visible in Fig. 9共a兲is higher than that one provided by conventional mammographic equipment 共images of the same phantom obtained on a conventional equipment can be found in the same reference, as well as in Refs. 10,33兲. Thus, Fig. 9共b兲 demonstrates the further improvements in image quality that can be achieved by means of the phase contrast technique and the proposed setup.
Figure 9共a兲and Fig. 9共b兲were obtained at 22 keV in the same conditions, except for the sample-to-detector distance and beam intensity. In particular, the number of detected photons per detector pixel per acquisition step共i.e., the num-ber of counts per image pixel兲 was held constant at about 10 000. For Fig. 9共b兲 共phase contrast兲, the beam height was equal to 100m, half impinging on the detector active sur-face and half immediately outside it. For Fig. 9共a兲 共 absorp-tion兲, the beam height was also equal to 100m, but per-fectly matching the detector active surface. For the phase contrast image, only 50 m of the beam were impinging on the detector. Thus, in order to preserve the same overall ac-quisition time, the beam was made two times more intense 共by removing an appropriate absorber兲when the phase con-trast image was acquired. In this way, by scanning the samples through the beam with exactly the same speed, the same number of photons per detector pixel per unit time is detected. It is thus clear that, when the phase contrast image is acquired, a dose increase of a factor 2 is necessary with respect to the absorption image. In fact, in both cases the sample is scanned through a 100 m high beam with the same speed, but the beam intensity is increased by a factor 2 for the phase contrast image. However, a few things should be noticed at this point.
共1兲In Ref. 30, it was demonstrated that absorption imag-ing with synchrotron radiation and the SYRMEP/ FRONTRAD detector device can be performed while deliv-ering to the sample a Mean Glandular Dose共MGD兲of about 0.3 mGy, thus reduced by a factor 4 –5 with respect to con-ventional mammography: this reduction is due to the mono-chromaticity of the synchrotron beam and to the high effi-ciency of the detector device. Thus, phase contrast imaging with the proposed setup would be feasible at a dose level reduced by at least a factor of 2 with respect to conventional mammographic equipments.
共2兲The dose is increased by a factor of 2 with respect to the absorption image because for practical reasons 50m of the beam were left outside the detector active surface. One can expect, however, that it would be sufficient to leave a smaller portion of the beam outside the active surface with-out compromising image quality, thus reducing the delivered FIG. 9. Images of details from a conventional mammographic test object.共a兲
dose. Investigations are on the way to prove this fact on a wider range of samples.
共3兲As indicated by the results shown in Fig. 7 and 8, a further narrowing of the beam would result in higher image contrast. Higher contrast means a higher signal to noise ratio 共SNR兲at the same dose, or, alternatively, the same SNR at a lower dose. This aspect is also currently under study on a wide range of samples; in this first study the beam was set to 100m to facilitate the comparison between the two images. Figure 9 already proves the fact that high gains in image quality can be achieved when typical mammographic objects are imaged, at dose levels lower or comparable to conven-tional mammographic ones.
E. A comparison with diffraction imaging results
It should be noted that the results obtained by means of the herein described single narrow beam setup have a strong similitude with another approach to the detection of phase effects, called diffraction 共or diffraction enhanced兲 imaging20,33 共compare, for instance, the images of Figs. 7 and 9共b兲with diffraction images in Refs. 20 and 33兴. In this approach, an analyzer crystal is placed between sample and detector, and the narrow reflectivity curve of the crystal is used to discriminate diffracted from undiffracted photons. In the setup proposed here, by narrowing the beam and shifting it with respect to the center of the pixel, something very similar is realized: one can, in fact, imagine a ‘‘box func-tion’’ that discriminates the photons that are detected from the ones that are not detected共since they do not impinge on the active surface of the detector兲according to the diffraction angle they have when they come out of the sample. The relative shift between narrow beam and pixel center deter-mines the position of this ‘‘box function’’ along the angle axis, while the sample-to-detector distance and the pixel height determine its width共the higher the sample-to-detector distance and the smaller the pixel, the narrower the box func-tion兲. The relevant aspect here lays in the fact that in our case the width of this ‘‘box function,’’ to some extent equivalent to the ‘‘rocking curve’’ in diffraction imaging, can be easily tuned by changing the pixel dimensions or, even more easily, the sample-to-detector distance.
F. Scatter imaging
The final step of the herein described feasibility study consisted in shifting the narrow beam completely out of the detector active surface by very small amounts. In this way, scatter imaging becomes feasible. The setup is very similar to the one shown in Fig. 6共b兲, with the narrow beam shifted upwards by approximately 15–20m. It is important to no-tice that, since the sample-to-detector distance is equal to 1.8 m, in this way extremely small scattering angles 共a few tenths of microradians兲 are taken into account. Thus, ex-tremely small angle scatter images are acquired in this way. Considering the fact that we are using monochromatic radiation, and that only elastic forward scattering is taken into account, the large dimensions of the pixel are an
advan-tage rather than a disadvanadvan-tage in this case: by increasing the pixel vertical dimension, one collects more scattered pho-tons, thus increasing the acquired signal.
In Fig. 10, simulated plots show the behavior of the signal as a function of the pixel size; the simulated sample was a 100 m nylon wire, radiation energy was equal to 20 keV. As it can be seen, the scattering peak 共that will result in a strong dark halo in the image when the beam impinges on a detail兲 increases as the pixel size is made larger, until at a certain point nearly all the scattered photons are collected, and the signal is consequently maximized. Since here we are dealing with photons that deviated by a very small amount from their original propagation direction, the shape of the details is somehow preserved in the images, even though only scattered—and not direct—radiation is detected. This fact is demonstrated by Fig. 11, which shows an image of one of the details of the Ackermann phantom共the simulated lymphonodes兲 obtained only with scattered radiation. As it can be seen, since now scattered photons are added to the background, instead of subtracted as it occurs in conven-tional absorption imaging, the contrast of the details is re-versed with respect to Fig. 9共a兲.
The last important remark regards the fact that the detec-tion of scattered photons can be achieved at no dose expense by simply adding a further detector layer above共or below, or both above and below兲 the layer that is acquiring the con-ventional absorption 共or phase contrast, according to the pixel dimensions兲 image. Investigations are thus now di-rected toward the optimization of such a multilayer detector
FIG. 10. Influence of the pixel size on extremely small angle scatter imag-ing. As the pixel size is enlarged, the signal increases until nearly all the scattered photons are collected. The simulated scattered intensity共in arbi-trary units兲is given as a function of the displacement in microns.
device: a first three-layer prototype has already been built and successfully tested by our collaboration.13,34
IV. CONCLUSIONS
A research and development study on novel techniques in the field of medical imaging carried out by the SYRMEP/ FRONTRAD collaboration, which involves the use of syn-chrotron radiation and a novel silicon pixel detector proto-type, has been described. The phase contrast imaging technique has been discussed, and its possible implementa-tion in our experimental setup has been described in detail.
In particular, innovative setups based on narrow beams shifted with respect to the center of the detector active sur-face have been studied, and it has been shown that they allow the possibility of removing the pixel size constraints, thus providing low dose, high quality digital phase contrast images of several samples, also with a relatively large共 hun-dreds of microns兲pixel size. Furthermore, the possibility of extremely small angle scatter imaging, and its possible ap-plication at no dose expense to diagnostic radiology with synchrotron radiation, has been briefly discussed. Effort is now directed toward the possibility of exploiting all these techniques simultaneously by means of an optimized multilayer detector, thus maximizing the amount of informa-tion extracted from the sample in a single acquisiinforma-tion without increasing the delivered dose.
a兲
Corresponding author共olivo@trieste.infn.it兲
1Mammography - A User’s Guide, NCRP Report 85, 1986.
2
H. E. Johns and J. R. Cunningham, The Physics of Radiology, 4th ed. 共Thomas, Springfield, IL, 1983兲.
3H. E. Johns and M. J. Yaffe, ‘‘X-ray characterization of normal and
neoplastic breast tissues,’’ Phys. Med. Biol. 32, 675– 695共1987兲. 4X. Zhou and R. Gordon, ‘‘Detection of early breast cancer: an overview
and future prospects,’’ Crit. Rev. Biomed. Eng. 17, 203–255共1989兲. 5L. W. Basset, ‘‘Mammographic analysis of calcifications,’’ Radiol. Clin.
North Am. 30, 93–105共1992兲.
6M. Sabel and H. Aichinger, ‘‘Recent developments in breast imaging,’’
Phys. Med. Biol. 41, 315–368共1996兲. 7
F. Arfelli et al., ‘‘SYRMEP共SYnchrotron Radiation for MEdical Phys-ics兲. Performance of the digital detector system,’’ Phys. Medica IX, 229– 233共1993兲.
8F. Arfelli et al., ‘‘Silicon x-ray detectors for synchrotron radiation digital
radiology,’’ Nucl. Instrum. Methods Phys. Res. A 353, 366 –370共1994兲. 9
F. Arfelli et al., ‘‘An edge-on silicon strip detector for x-ray imaging,’’ IEEE Trans. Nucl. Sci. 44, 874 – 880共1997兲.
10F. Arfelli et al., ‘‘A linear array silicon pixel detector: images of a
mam-mographic test object and evaluation of the delivered doses,’’ Phys. Med. Biol. 42, 1565–1573共1997兲.
11E. Beuville et al., ‘‘An application specific integrated circuit and data
acquisition system for digital X-ray imaging,’’ Nucl. Instrum. Methods Phys. Res. A 406, 337–342共1998兲.
12F. Arfelli et al., ‘‘Silicon detectors for digital radiography,’’ Nucl.
In-strum. Methods Phys. Res. A 367, 48 –53共1995兲.
13F. Arfelli et al., ‘‘A multi-layer silicon microstrip detector for single
pho-ton counting digital mammography,’’ Informacije MIDEM 29, 26 –31 共1999兲.
14
F. Arfelli et al., ‘‘Improvements in the field of radiological imaging at the SYRMEP beamline,’’ SPIE Vol. 3770, 1999.
15
A. Snigirev, I. Snigireva, V. Kohn, S. Kuznetsov, and I. Scelokov, ‘‘On the possibilities of X-ray phase contrast microimaging by coherent high-energy synchrotron radiation,’’ Rev. Sci. Instrum. 66, 5486 –5492共1995兲. 16T. J. Davis, D. Gao, T. E. Gureyev, A. W. Stevenson, and S. W. Wilkins,
‘‘Phase-contrast imaging of weakly absorbing materials using hard X-rays,’’ Nature共London兲373, 595–598共1995兲.
17
P. Cloetens, R. Barrett, J. Baruchel, J. P. Guigay, and M. Schlenker, ‘‘Phase objects in synchrotron radiation hard X-ray imaging,’’ J. Phys. D
29, 133–146共1996兲.
18T. Takeda, A. Momose, Y. Itai, J. Wu, and K. Hirano, ‘‘Phase contrast
imaging with synchrotron radiation X-rays for detecting cancer lesions,’’ Acad. Radiol. 2, 799– 803共1995兲.
19
V. S. Gerasimov et al., ‘‘Search for biological objects by refraction radi-ography using synchrotron radiation of VEPP-3 storage ring,’’ Nucl. In-strum. Methods Phys. Res. A 405, 525–531共1998兲.
20D. Chapman et al., ‘‘Diffraction enhanced X-ray imaging,’’ Phys. Med.
Biol. 42, 2015–2025共1997兲.
21M. DiMichiel et al., ‘‘Phase contrast imaging in the field of
mammogra-phy,’’ in Medical Applications of Synchrotron Radiation, edited by M. Ando and C. Uyama共Springer-Verlag Tokyo, 1998兲, pp. 78 – 82. 22F. Arfelli et al., ‘‘Low-dose phase contrast X-ray medical imaging,’’
Phys. Med. Biol. 43, 2845–2852共1998兲.
23E. A. Beliaevskaya et al., ‘‘X-ray imaging of a synthetic mammography
structure,’’ Phys. Medica XIV, 19–23共1988兲.
24V. N. Ingal, E. A. Beliaevskaya, A. P. Brianskaya, and R. D. Merkurieva,
‘‘Phase mammography—a new technique for breast investigation,’’ Phys. Med. Biol. 43, 2555–2567共1988兲.
25M. Born and E. Wolf, Principles of Optics共Pergamon, Oxford, 1975兲. 26J. Cowley, Diffraction Physics共North Holland, Amsterdam, 1975兲. 27S. W. Wilkins, T. E. Gurejev, D. Gao, A. Pogany, and A. W. Stevenson,
‘‘Phase contrast imaging using polychromatic hard X-rays,’’ Nature共
Lon-don兲384, 335–338共1996兲.
28F. Arfelli et al., ‘‘Digital mammography with synchrotron radiation,’’
Rev. Sci. Instrum. 66, 1325–1328共1995兲. 29
F. Arfelli et al., ‘‘The mammography project at Elettra,’’ Phys. Medica
XIII, 7–12共1997兲.
30F. Arfelli et al., ‘‘Mammography of a phantom and breast tissue with
synchrotron radiation and a linear-array silicon detector,’’ Radiology 208, 709–715共1998兲.
31A. Olivo, ‘‘Un metodo innovativo per produrre radiografie digitali in
contrasto di fase con luce di sincrotrone,’’ Ph.D. dissertation, University of Trieste, 1999, unpublished.
32
J. Law, ‘‘A new phantom for mammography,’’ Br. J. Radiol. 64, 116 –120 共1991兲.
33F. Arfelli et al., ‘‘Mammography with synchrotron radiation:
phase-detection techniques,’’ Radiology 215, 286 –293共2000兲.
34F. Arfelli et al., ‘‘A multilayer edge-on silicon microstrip single photon