Article
1
IgG Charge
2
Danlin Yang1, Rachel Kroe-Barrett1, Sanjaya Singh2, and Thomas Laue3,*
3
1 Biotherapeutics Discovery Research, Boehringer Ingelheim Pharmaceuticals, Inc., Ridgefield, Connecticut
4
06877, USA. Present address: Janssen BioTherapeutics, Janssen Research & Development, LLC, Spring
5
House, Pennsylvania 19477, USA
6
2 Janssen BioTherapeutics, Janssen Research & Development, LLC, Spring House, Pennsylvania 19477, USA
7
3 Department of Molecular, Cellular and Biomedical Sciences, University of New Hampshire, Durham,
8
New Hampshire, 03861, USA; [email protected]
9
* Correspondence: [email protected]; Tel.: +01-603-978-5579
10
11
Abstract: It has been known since the 1930’s that all immunoglobulins carry a weak negative
12
charge in physiological solvents. However, there has been no systematic exploration of this
13
fundamental property. Accurate charge measurements have been made using membrane
14
confined electrophoresis in two solvents (pH 5.0 and pH 7.4) on a panel of twelve mAb IgGs, as
15
well as their F(ab’)2 and Fc fragments. The following observations were made at pH 5.0: 1) the
16
measured charge differs from the calculated charge by ~40 for the intact IgGs, and by ~20 for the
17
Fcs; 2) the intact IgG charge depends on both Fv and Fc sequences, but does not equal the sum of
18
the F(ab)’2 and Fc charge; 3) the Fc charge is consistent within a class. In phosphate buffered
19
saline, pH 7.4: 1) the intact IgG charges ranged from 0 to -13; 2) the F(ab’)2 fragments are nearly
20
neutral for IgG1s and IgG2s, and about -5 for some of the IgG4s; 3) all Fc fragments are weakly
21
anionic, with IgG1 < IgG2 < IgG4; 4) the charge on the intact IgGs does not equal the sum of the
22
F(ab’)2 and Fc charge. In no case is the calculated charge, based on H+ binding, remotely close to
23
the measured charge. The charge on IgGs in physiological solvent is sufficiently small to
24
minimize its contribution to thermodynamic nonideality. Some of the mAbs carried a charge in
25
physiological salt that was outside the range observed for serum-purified human poly IgG. To
26
best match physiological properties, a therapeutic mAb should have a measured charge that falls
27
within the range observed for serum-derived human IgGs.
28
Keywords: Analytical electrophoresis; IgG subclasses; monoclonal IgG, Protein charge
29
30
1. Introduction
31
It has been known for over 80 years that all serum proteins, including the immunoglobulins,
32
carry a net negative charge under physiological conditions [1]. More recently, it was shown that
33
freshly prepared human polyclonal IgGs have a Debye-Hückel-Henry charge, ZDHH [2], between -3
34
and -9 [3]. The narrow range of charge is somewhat surprising since isoelectric focusing analysis of
35
the same sample yielded isoelectric points (pIs) covering the pH range from less than 4 to greater
36
than 10 [3]. Charge is a system property that depends on temperature and solvent composition, and
37
it is believed that the narrow range of ZDHH under physiological conditions is a consequence of anion
38
binding.
39
It is known that charge and charge distribution are important contributors to protein solubility
40
and solution viscosity [4–7]. The majority of biotherapeutic mAbs exhibit pIs >= 8, and carry a positive
41
charge in the pH 5 – 6 range where they are formulated [5–7]. However, there is no published charge
42
data for these mAbs in physiological solvents, and it is not known whether their charge falls into the
43
range observed for normal human IgGs. It is apparent that a systematic analysis of the charge on
44
mAbs would be useful.
45
Presented here is an analysis of the charge on twelve anti IL-13 IgGs. Using membrane confined
46
electrophoresis, MCE, charge data have been acquired for three IgGs, mAb1, mAb2 and mAb3, that
47
bind to different IL-13 epitopes [3]. For each mAb, ZDHH has been measured for four subclasses, IgG1,
48
IgG2, IgG4 and IgG4Pro. Furthermore, the charge on the Fc and F(ab’)2 fragments was measured to
49
determine whether the intact IgG charge is the sum of the Fc and F(ab’)2 fragment charges, and to
50
assess how the charge is distributed over the IgG structure. Finally, the charge on the IgGs and their
51
fragments were measured at both pH 5.0 and pH 7.4 to determine how the charge varies between
52
formulation and physiological conditions. The results illustrate how little is known about protein
53
charge and demonstrates the power of analytical electrophoresis in assessing this property.
54
1.1 Background
55
Protein charge is significant to a variety of biochemical, biophysical and biological phenomena
56
[8]. Thermodynamically, charge is a system property that depends on temperature, pressure, salt
57
concentration, salt type and pH [9]. At present there is no way to calculate protein charge accurately.
58
However, charge may be measured with both precision and accuracy [2,10,11]. Of the measurement
59
methods, membrane confined electrophoresis [12,13] is the most accurate and flexible [2,14].
60
There are a variety of charge descriptions (e.g. ζ potential, Zeffective, ZDHH) [2]. While each
61
description is useful, here we will use ZDHH, which is the unitless valence resulting from the ratio of
62
the protein charge (in coulombs) to the proton unit charge (e.g. Ca2+ has a valence of +2, Cl-1 has a
63
valence of -1). Calculation of ZDHH from the free-boundary electrophoretic mobility removes the
64
effects of electrophoresis and the solvent ion cloud [2,12,15]. Thus, ZDHH reflects any changes in
65
protein charge that accompany changes in solvent pH, salt type or salt concentration [2].
66
Though pH may contribute to protein charge, ZDHH reflects binding by all solvent ions (e.g. Na+,
67
PO42-, Cl-) and not just H+. It has been known for over 60 years that proteins bind anions to a greater
68
extent than cations [16–18]. Two non-exclusive models have emerged for the mechanism of anion
69
binding. One model focuses on the tendency for anions to accumulate preferentially at hydrophobic
70
surfaces [17]. Based on NMR data, the other model suggests that anion binding may involve amide
71
protons [18].
72
Because ion binding and dissociation occur rapidly, ZDHH values are time averages. The extent
73
of fluctuation about the mean value is proportional to the change in charge with ion chemical
74
potential (i.e. the slope of the curve of Z versus log[X]) [19]. If the titration curve is flat (i.e. dZ/dlog[X]
75
~0), there will be very little charge variation, and the charge distribution about the average value will
76
be narrow. A steep titration curve, however, indicates large charge variations which, particularly if
77
they swing around neutrality, result in the inter-molecular attractions that reduce solubility and
78
cause higher viscosities. Thus, measurement of ZDHH as a function of solvent ion concentration
79
(including pH) may be helpful in finding solvent conditions that optimize solubility and viscosity.
80
2. Materials and Methods
81
2.1. Monoclonal and human serum IgGs
82
Twelve anti-IL13 IgGs comprising three unique variable regions, each constructed as four
83
human IgG subclasses, IgG1, IgG2, wild-type IgG4(Ser222), and a hinge mutant IgG4(Pro222), were
84
made from stable NS0 cell clone at Boehringer Ingelheim. Human serum derived from male AB
85
plasma was purchased from Sigma (cat# H4522). The IgGs were purified by ÄKTA affinity
86
chromatography system and MabSelect Sure resin (GE Healthcare) following standard methods
87
[20]. The quality of the purified mAb IgGs and their fragments generated by subsequent enzymatic
88
digestion was evaluated by analytical size-exclusion ultra-performance liquid chromatography
(SE-89
UPLC) using a BEH200 column on the Waters Acquity UPLC system (Waters Corporation). The
90
mobile phase buffer consisted of 50 mM sodium phosphate (pH 6.8), 200 mM arginine, and 0.05%
91
sodium azide. For each sample run, 10 µg of material was injected onto the column with the
92
running flow rate at 0.5 mL/min for 5 min.
93
2.2. IgG fragmentation
96
A FragIT kit with individual spin columns containing the active IdeS, a cycstein protease
97
secreted by Streptococcus pyogenes covalently coupled to agarose beads was used (Genovis, cat#
A2-98
FR2-025). After the IgG sample was buffer exchanged into the cleavage buffer (10 mM sodium
99
phosphate, 150 mM NaCl) and the column was equilibrated with the cleavage buffer, the
IgG-100
enzyme mixture was incubated at 37 oC for an hour on an orbital shaker. The digested fragments
101
were separated from the immobilized enzyme, followed by the purification of F(ab’)2 using a
102
supplied CaptureSelect column containing Fc affinity matrix (Thermo Fisher). Upon the collection
103
of the F(ab’)2 in the flow-through, the Fc was eluted using the 0.1 M glycine (pH 3.0) elution buffer
104
and immediately neutralized by adding 10% v/v of 1 M Tris (pH 8.0).
105
2.3. Sample preparation
106
Each sample was dialyzed into desired buffers at 4-10 oC overnight using Zeba desalting
107
columns (Thermo Fischer), after which the concentration was determined using appropriate
108
extinction coefficients in NanoDrop™ 8000 Spectrophotometer (Thermo Fischer). Two solvents
109
were used: 10 mM sodium acetate, 50 mM NaCl, pH 5.0; and Dulbecco's PBS (pH 7.4) containing 8
110
mM sodium phosphate dibasic, 1.5 mM potassium phosphate monobasic, 2.7 mM KCl, and 138 mM
111
NaCl. The acetate buffer was prepared by diluting chemicals purchased from Sigma into distilled
112
deionized water from a Milli-Q Plus filtration system (Millipore) and titrating to the desired pH 5.0
113
with 10 N NaOH solution. For all measurements, the sample solutions were used within a week of
114
preparation and stored at 4 oC between measurements.
115
2.4 Liquid Chromatography Mass Spectrometry (LC-MS)
116
The sequences of the purified mAbs and respective F(ab’)2 and Fc fragments were evaluated by
117
LC-MS using a PoroShell 300SB-C8 column (5 µm, 75 x1.0 mm) on the Agilent HPLC system
118
followed by analysis in the Agilent 6210 time-of-flight mass spectrometer (Agilent Technologies).
119
The composition of the mobile phase A was 99% water, 1% acetonitrile, and 0.1% formic acid, and
120
that of mobile phase B was 95% acetonitrile, 5% water, and 0.1% formic acid. The gradient started
121
with 20% B at 0 min and increased to 85% B at 10 min with the constant flow rate of 50 µl/min. Each
122
sample was subjected to a native run, a reduced run after incubation with TCEP (Sigma), and a
123
deglycosylated run after incubation with TCEP and PNGase F (New England Biolabs). The
124
MassHunter Qualitative Analysis program (version B.06.00) was used to deconvolute the raw data.
125
126
2.5 Analytical Ultracentrifugation (AUC)
127
128
The solution properties of the purified mAbs and cleaved F(ab’)2 and Fc were evaluated by
129
sedimentation velocity experiments in an Optima XL-I AUC equipped with absorbance optics
130
(Beckman Coulter). Each sample was prepared in three concentrations with 1:3 serial dilutions
131
starting from 0.5 mg/mL in the correponding buffer, and 400 µl of the prepared solution was loaded
132
into the sample chamber, whereas buffer was loaded into the reference chamber of an AUC cell
133
assembled with standard double-sector centerpieces and quartz windows. The experiments were
134
conducted at 20 °C using an An60Ti 4-hole rotor spinning at 40,000 rpm. The sedimentation process
135
was monitored by collecting absorbance data at 280 nm wavelength and 30-µm radial increments.
136
The collected data was analyzed using the SEDANAL software by which the apparent
137
sedimentation coefficient distribution g(s*) was derived [21]. The resulting analysis was initially
138
plotted as g(s*) vs. s* in which the areas under the peaks provided the concentration for the
139
boundary corresponding to each peak in the distribution. The weight average sedimentation
140
coefficient (sw) was computed by selecting a range over which to do the average on the plots. The
141
plots were concentration-normalized to enable the inspection for reversible interactions. The Stokes
142
= (1 − ῡ )
6 (1)
where M is the molar mass, ῡ is the partial specific volume, ρ is the solvent density, s is the
144
sedimentation coefficient, NA is the Avogadro’s number, and η is the viscosity of the solvent.
145
2.6. Imaged capillary isoelectric focusing (icIEF)
146
The pI and charge heterogeneity of the IgG samples were determined on an iCE3 system
147
(Protein Simple) [22,23]. Briefly, the pH gradient was created by an ampholyte mixture consisted of
148
44% (v/v) of 1% methylcellulose, 1.25% (v/v) of pharmalyte 3-10 solution, 3.75% (v/v) µl of
149
pharmalyte 5-8 solution, 1.25% (v/v) of servalyte 9-11 solution, 0.63% (v/v) of pI marker pH 6.14,
150
0.63% (v/v) of pI marker pH 8.79, 6.3% (v/v) of 200 mM iminodiacetic acid, and 43% (v/v) of water.
151
After sample preparation at 1 mg/mL in DI water, 40 µl of the diluted sample was mixed with 160
152
µl of ampholyte mixture and centrifuged for 5 min. The operating protocol used an initial potential
153
of 1500 volts for 1 min, followed by a potential of 3000 volts for 20 min. For samples containing
154
highly basic species, pI markers at pH 7.55 and pH 9.77 (0.63% v/v) and a focus period of 10 min at
155
3000 volts was used. Separation was monitored at 280 nm, and the data analyzed using the iCE CFR
156
software to calibrate the pI values and to select the markers. Subsequetly, the data files were
157
exported to Empower for analysis using the cIEF processing method.
158
2.7. Membrane-confined electrophoresis (MCE) and ZDHH determinations
159
Protein valence was measured in the MCE instrument (Spin Analytical), which provides a
160
direct measurement of the electrophoretic mobility (µ) to derive the Zeff and the ZDHH [12,13]. In each
161
experiment, 20 µl of sample at 1 mg/mL was loaded into a 2 x 2 x 4 mm quartz cuvette whose ends
162
were sealed with semipermeable membranes (MWCO 3 kDa, Spectra/Por Biotech grade). An
163
electric field was applied (4.3 V/cm for IgG, 8.5 V/cm for F(ab’)2 and Fc, and 19.8 V/cm for serum
164
IgGs) longitudinally across the cell. The applied electric field, E, is a function of the applied current,
165
i, the buffer conductivity (κ, 5.8 mS for 10 mM acetate, 50 mM NaCl [pH 5.0] and 16.8 mS for PBS
166
[pH 7.4]), and the cross-sectional area of the cuvette, A, as = . Image scans of the cuvette were
167
acquired with 25 μm resolution at 280 nm every 10-20 seconds. Time difference analysis provided
168
an apparent electrophoretic mobility distribution, g(μ) versus μ, uncorrected for diffusion. Values of
169
μ were converted to charge using the Spin Analytical software:
170
= (2)
= 1 +
( )
(3)
where µ is the electrophoretic mobility, f is the translational frictional coefficient, e is the elementary
171
proton charge , ĸD is the inverse Debye length, a is the sum of the Stokes radius of the
172
macromolecule and its counterion (0.18 nm for Cl-1 and 0.122 nm for Na+), and H(κD a) is Henry’s
173
function that accounts for electrophoretic effects. For reference, under the experimental conditions
174
used here, κD a ~ 2 and H(κD a) ~1.1, though exact values are calculated for each experiment.
175
176
2.8 Calculated charge, ZCal, and calculated isoelectric pH, pICal
177
178
Sednterp was used to calculate pI values, pICal, as well as the H+ titration curve from which ZCal
179
was determined [24]. These calculations are based on the amino acid composition and use pKa
180
values from Edsall and Wyman [25]. It was assumed that the N-terminal amino groups were not
181
blocked.
182
2.9 Dynamic light scattering (DLS) and kD determinations
186
A DynaPro Plate Reader (Wyatt) running Dynamics (version 7.4.0.72) was used to determine
187
the diffusion interaction parameter, kD. Each sample was prepared at 5 concentrations ranging from
188
10 mg/mL to 0.625 mg/mL in 2-fold serial dilutions. 35 µl of each solution was added to a 384-well
189
UV-Star Clear Microplate (Greiner Bio-One), spun in a centrifuge for 2 mins to remove air bubbles
190
and then placed into the plate reader. The experiment was started after the temperature inside the
191
reader reached 20 oC. A total of 10 acquisitions at 20 s per acquisition were obtained for each
192
sample. A well image was acquired after the last acquisition measurement to look for bubbles or
193
deposited aggregates. The mutual diffusion coefficient (Dm) was plotted against the sample
194
concentration = 0(1+ ), with D0 and kD determined by linear regression analysis using
195
GraphPad Prism (version 7.03). The error for kD was determined by calculating the propagation of
196
the standard error of the coefficients from the linear regression.
197
3. Results
198
All purified IgGs contain > 99% monomer content as assessed by analytical SE-UPLC and are
199
sequence confirmed by LC-MS. These twelve mAbs also displayed homogeneous solution
200
properties within each mAb group in both pH 5.0 acetate and pH 7.4 PBS buffer conditions as
201
illustrated in Figure 1. Overlaps between the IgG subclasses within each mAb group are observed,
202
in which the weight-average sedimentation coefficients (sw) are 6.37 ± 0.06, 6.37 ± 0.05, and 6.43 ±
203
0.09 in pH 5.0 acetate, and 6.28 ± 0.04, 6.27 ± 0.07, and 6.31 ± 0.06 in pH 7.4 PBS for mAb 1, mAb 2,
204
and mAb 3, respectively. These sw values are consistent with the molecular weight of ~150 kDa IgG
205
antibodies.
206
207
Figure 1. Sedimentation velocity analysis of IgG subclasses from mAb1, mAb2, and mAb3 in pH 5.0
208
acetate (red) and pH 7.4 PBS (blue) solutions. Normalized g(s*) sedimentation distributions are obtained from
209
IgG1 (solid line), IgG2 (dotted line), IgG4 (dashed line), and IgG4Pro (dot-dashed line) in both buffers. The
purity assessed by SE-UPLC and cleavage sites between F(ab’)2 and Fc identified by LC-MS are summarized in
211
Table 1.
212
Table 1. Quality of IgG fragments from IdeS digestion.
213
Subclass V region Cleaved Site F(ab’)2 purity (%)
Fc purity (%)
IgG1 mAb 1 …CPPCPAPELLG
/ GPSVF…
95
100
mAb 2 100
mAb 3 100
IgG2 mAb 1 …CPPCPAPPVA
/ GPSVF…
100
98
mAb 2 100
mAb 3 100
IgG4 mAb 1 …CPSCPAPELLG
/ GPSVF…
95
97
mAb 2 95
mAb 3 97
IgG4Pro mAb 1 …CPPCPAPELLG
/ GPSVF…
97
mAb 2 100
mAb 3 100
The solution homogeneity of each cleaved fragment was assessed by SV-AUC. All IgG
214
fragments showed sedimentation distribution profiles like that in Figure 2 for mAb 1, where the
215
superposition of the three concentrations of F(ab’)2 and Fc samples indicate homogeneity and the
216
absence of self-association. The weight-average sedimentation coefficients (sw) from the Fc
217
evaluations are 3.45 ± 0.02, 3.46 ± 0.02, and 3.38 ± 0.18 for IgG1, IgG2, and IgG4, respectively. These
218
values are consistent with the molecular weight of ~50 kDa, which indicates Fc homodimer in
219
solution despite cleavage below the hinge region. The sw from the F(ab’)2 evaluations are 4.86 ± 0.01,
220
5.14 ± 0.06, 4.90 ± 0.02, and 4.95 ± 0.01 for IgG1, IgG2, IgG4, and IgG4Pro, respectively. These values
221
are consistent with the molecular weight of ~100 kDa, which is expected for a bivalent Fab linked by
222
hinge.
223
224
IgG1
IgG4
(a) (b)
Figure 2. Sedimentation velocity analysis of IgG1, IgG2, and IgG4 cleaved (a) Fc and (b) F(ab’)2 from
225
mAb1 in pH 5.0 acetate. Normalized g(s*) sedimentation distributions obtained with the concentration of
226
0.5 mg/mL (red), 0.167 mg/mL (blue), and 0.056 mg/mL (green).
227
All IgGs exhibited pI profiles like that in Figure 3 for mAb1 IgG1. Three-peaks are observed,
228
acidic, main and basic. The pI values for each IgG are presented in Table 2, along with the calculated
229
pI. For each mAb, the subclass pIs followed the trend: IgG1 > IgG2 > IgG4, with those of IgG4 and
230
IgG4Pro being identical. The measured main species pI and the calculated pI are correlated (Figure
231
4), though the intercept (-1) suggests that pICal corresponds to the more acidic species.
232
233
Figure 3. Electrophoretogram image of mAb1 IgG1. The peaks to the left and to the right of the main peak
234
indicates acidic and basic charge variant, respectively.
235
Table 2. Measured and calculated pI values of IgG.
236
ID Subclass pIcal*
pIicIEF
Acidic peak Main peak Basic peak
mAb1
IgG1 7.7 7.9 8.1 8.2
IgG2 6.9 6.9 7.0 7.3
IgG4 6.6 6.2 6.3 6.5
IgG4Pro 6.6 6.2 6.3 6.5
mAb2
IgG1 8.2 8.2 8.4 8.6
IgG2 7.3 7.9 8.0 8.2
IgG4 7.0 7.4 7.6 7.7
IgG4Pro 7.0 7.4 7.6 7.7
mAb3
IgG1 8.2 8.2 8.4 8.6
IgG2 7.4 7.2 8.0 8.1
IgG4 7.1 7.5 7.7 7.8
IgG4Pro 7.1 7.5 7.7 7.8
237
6
.1
3
6
7
.9
1
7
8
.0
6
5
8
.2
3
5
8
.7
9
1
A
b
s
o
rb
a
n
c
e
0.00 0.02 0.04 0.06 0.08 0.10 0.12 0.14 0.16 0.18 0.20 0.22 0.24 0.26 0.28
Minutes
6.00 6.20 6.40 6.60 6.80 7.00 7.20 7.40 7.60 7.80 8.00 8.20 8.40 8.60 8.80 9.00
Low pI marker High pI marker
Acidic pI Main pI
Figure 4. Linear regression analysis and correlation between experimental pI as measured by icIEF and
238
theoretical pI calculated from the IgG sequence. Dotted lines indicate the 95% confidence interval.
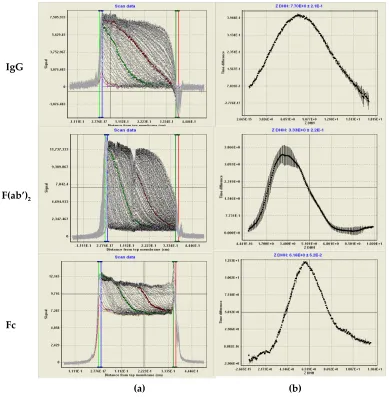
239
Using MCE, the electrophoretic mobility was determined for each IgG and its cleaved F(ab’)2
240
and Fc in pH 5.0 acetate and pH 7.4 PBS as illustrated in Figure 5. By applying the Debye-Hückel
241
approximation to correct for the solvent shielding effects, Henry’s function to correct for
242
electrophoretic effects, and using the sum of the measured protein Stokes radius and its counterion,
243
the ZDHH distribution may be calculated from the electrophoretic mobility (Figure 5, right-hand
244
panels).
245
246
Figure 5. ZDHH determination of IgG, F(ab’)2, and Fc by MCE in pH 5.0 acetate. (a) Raw MCE scans
247
over time during electrophoresis. The data (left panel) shows the light intensity (I, vertical axis) as a
248
function of the distance moved from the membrane (cm, horizontal). Time difference curves (ΔI/Δt)
249
are calculated from data between the green and red highlighted scans. The electrophoretic mobility
250
distribution is calculated from distance moved from the membrane, x, divided by the product of the
251
electric field, E, and average elapsed time for the middle scan ̅, =
∙ ̅. (b) The vertical axis shows
252
the time derivative (ΔI/Δt) of the intensity data in panel (a) as a function of ZDHH (horizontal axis).
253
ZDHH was calculated from the mobility using T = 20 oC; viscosity = 0.98 cp; conductance = 16.8 mS;
254
E = -19.8 V/cm, D = 78; counterion radius, 0.18 nm; Stokes radius, 5.5 nm. The peak ZDHH position is
255
displayed above the curve.
256
Table 3 and Table 4 summarize the ZDHH measurements, as well as the calculated charge, ZCal,
257
in pH 5.0 acetate and pH 7.4 PBS, respectively. A 0 charge was assigned if no boundary formed
258
IgG
F(ab’)2
Fc
during electrophoresis regardless of the E field direction or magnitude. In acetate pH 5.0 all IgGs
259
and their fragments are cationic (Table 3). However, in all cases the measured ZDHH is substantially
260
lower than Zcal. In PBS pH 7.4 (Table 4), all intact IgGs are neutral (Mab2/IgG1) or anionic, despite
261
the fact the Zcal is cationic in some cases. For all mAbs, ZDHH decreases with subclass in the rank
262
order of IgG1 > IgG2 > IgG4.
263
Table 3. Measured and calculated Z values of IgG, F(ab’)2, and Fc in pH 5.0 acetate.
264
ID Subclass IgG F(ab')2 Fc
ZDHH Zcal ZDHH Zcal ZDHH Zcal
mAb 1
IgG1 7.7 ± 0.2 57.3 3.3 ± 0.2 31.2 6.2 ± 0.1a 26.30
IgG2 3.9 ± 0.1 50.0 0 25.9 4.9 ± 0.1b 24.30
IgG4 1.4 ± 0.2 46.7 1.3 ± 0.1 27.9 0.45 ± 0.1c 18.98
IgG4Pro 1.4 ± 0.8 46.7 1.5 ± 0.2 27.9 c
mAb 2
IgG1 10.6 ± 0.1 61.0 8.6 ± 0.2 34.9 a
IgG2 10.1 ± 0.2 53.7 4.7 ± 0.1 29.6 b
IgG4 5.6 ± 0.2 50.4 6.2 ± 0.1 31.6 c
IgG4Pro 5.6 ± 0.2 50.4 6.2 ± 0.1 31.6 c
mAb 3
IgG1 12.5 ± 0.1 65.8 9.4 ± 0.1 39.6 a
IgG2 10.3 ± 0.2 58.5 5.3 ± 0.2 34.3 b
IgG4 7.7 ± 0.2 55.1 7.1 ± 0.1 36.3 c
IgG4Pro 7.8 ± 0.2 55.1 7.3 ± 0.1 36.3 c
apooled IgG1-Fc dialyzed into acetate from mAb1, mAb2, and mAb3 digestions
265
bpooled IgG2-Fc dialyzed into acetate from mAb1, mAb2, and mAb3 digestions
266
cpooled IgG4-Fc dialyzed into acetate from mAb1, mAb2, and mAb3 digestions
267
Table 4. Measured and calculated Z values of IgG, F(ab’)2, and Fc in pH 7.4 PBS.
268
ID Subclass IgG F(ab')2 Fc
ZDHH Zcal ZDHH Zcal ZDHH Zcal
mAb 1
IgG1 -5.6 ± 0.1 1.8 0 -0.48 -2.8 ± 0.1d 1.50
IgG2 -7.7 ± 0.6 -4.4 0 -4.59 -6.0 ± 0.6e -0.48
IgG4 -10.6 ± 0.5 -6.5 -4.3 ± 0.8 -2.61 -10.4 ± 0.3f -4.60
IgG4Pro -13 ± 0.3 -6.5 -5.05 ± 0.5 -2.61 f
mAb 2
IgG1 0 5.8 0 3.5 d
IgG2 -3.2 ± 0.2 -0.4 0 -0.61 e
IgG4 -7.4 ± 0.2 -2.5 0 1.38 f
IgG4Pro -9.6 ± 0.4 -2.5 0 1.38 f
mAb 3
IgG1 -5.3 ± 0.5 6.0 0 3.45 d
IgG2 -6.1 ± 0.3 -0.1 0 -0.36 e
IgG4 -6.1 ± 0.2 -2.2 0 1.63 f
IgG4Pro -10.7 ± 0.4 -2.2 0 1.63 f
dpooled IgG1-Fc dialyzed into PBS from mAb1, mAb2, and mAb3 digestions
269
epooled IgG2-Fc dialyzed into PBS from mAb1, mAb2, and mAb3 digestions
270
fpooled IgG4-Fc dialyzed into PBS from mAb1, mAb2, and mAb3 digestions
271
While ZDHH and Zcal are correlated in either solvent (Figure 6), the slope is about ½ - ¾ of what
272
would be expected if there were a 1:1 correspondence between the expected H+ uptake/release and
273
ZDHH. These data are consistent with a model in which an anion is bound for every 1.3 – 2 H+ bound.
274
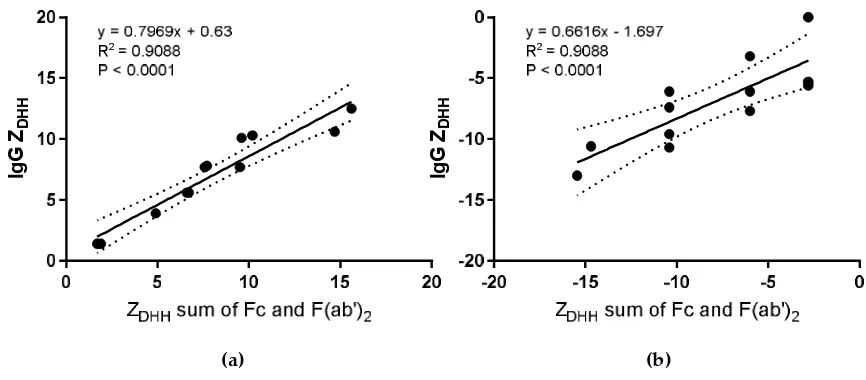
Similarly, ZDHH for the intact IgGs correlates with the sum of ZDHH from fragments (Figure 7), albeit
275
have no mechanism or explanation for the data in Figure 7 and present them here in the hope that
277
they will encourage future work.
278
279
Figure 6. Linear regression analysis and correlation between experimental ZDHH measured by MCE and
280
theoretical Z calculated from the IgG sequence. (a) pH 5.0 acetate. (b) pH 7.4 PBS. Dotted lines indicate
281
the 95% confidence interval.
282
283
284
Figure 7. Linear regression analysis and correlation between ZDHH measured from intact IgG and the sum
285
of ZDHH from the fragments. (a) pH 5.0 acetate. (b) pH 7.4 PBS. Dotted lines indicate the 95% confidence
286
interval.
287
4. Discussion
288
Protein charge directly influences the structure, stability, solubility, and ability to interact with
289
other macromolecules [26]. Charge-charge repulsion is important for overcoming the attractive
290
forces that lead to high viscosities in high-concentration protein solutions [27]. Because protein
291
charge can vary with solvent conditions, it is a system property rather than a property of the protein.
292
The systematic analysis of twelve mAbs and their F(ab’)2 and Fc fragments provides several insights
293
into IgG charge and raises several important questions about our understanding of protein charge.
294
Charge-charge repulsion contributes to thermodynamic nonideality and, consequently, the
295
colloidal stability of protein solutions [9]. It is clear from the data in Tables 3 and 4 that charge
296
M
e
a
s
u
re
d
ZD
H
H
M
e
a
su
re
d
ZD
H
H
(a) (b)
Ig
G
ZD
H
H
Ig
G
ZD
H
H
calculations based solely on H+ binding lead to highly inaccurate estimates of IgG charge. Thus,
297
even though there is a correlation between the measured and calculated charge (Figure 6), charge
298
calculations should not be considered reliable. Given its potential importance to colloidal stability,
299
it is important to determine the impact of charge on nonideality.
300
At low to moderate protein concentrations (< ~15 mg/mL), the net sum of all repulsive and
301
attractive interactions is described by the second virial coefficient, B22 or A2. The diffusion
302
interaction parameter, kD, is related to and often used as a stand-in for these quantities [28], with
303
more positive values of kD correlating with more positive values of B22, i.e. greater repulsive
304
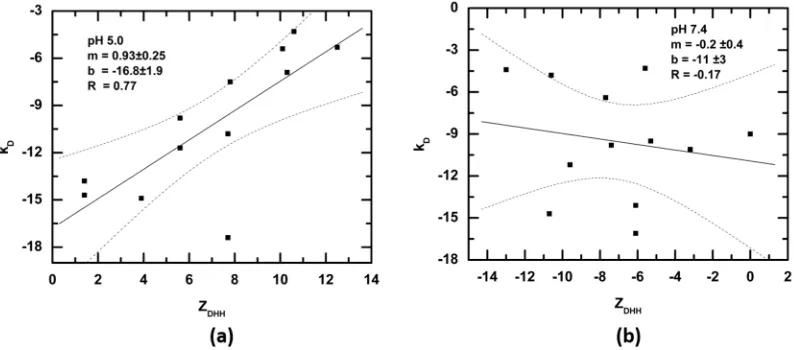
interactions. If charge-charge repulsion contributes significantly to nonideality, there should be a
305
positive correlation of charge with kD. Figure 8 shows the correlation of ZDHH with the diffusion
306
interaction parameter, kD. Under formulation conditions (Figure 6, panel a) increasing ZDHH
307
correlates with increased repulsive interaction (i.e. kD becomes more positive). This suggests that
308
charge measurements may be a useful parameter for selecting candidate mAbs for development.
309
It should be noted that it is the effective charge, Zeff, rather than ZDHH, that impacts thermodynamic
310
nonideality [2]. This distinction is important because Zeff includes the contribution of the solvent
311
ions, with Zeff decreasing (i.e. repulsive interactions decreasing) as salt concentration is increased
312
[9]. Because salt diminishes charge-charge interactions, thus reducing colloidal stability, it should
313
be no surprise that most mAbs are manufactured and formulated in low-salt solvents.
314
While charge does contribute to nonideality under formulation conditions, there is no
315
correlation between ZDHH and kD under physiological conditions (Figure 8, panel b). This result
316
means that it is unfavorable solvent displacement energies that keep mAbs in solution, for all other
317
protein-protein interactions are attractive [29]. Similarly, it is likely that it is the protein solvation
318
shell that dominates the solubility of serum IgG.
319
320
Figure 8. Linear regression analysis and correlation between ZDHH measured for intact IgG and the
321
concentration-dependence of the diffusion coefficient, kD. (b) pH 7.4 PBS. Dotted lines indicate the 95%
322
confidence interval.
323
One surprising result of our work is that freshly prepared human IgG exhibits a rather narrow
324
ZDHH distribution in physiological solvent (from approximately -10 to -2, Figure 9), even though
325
isoelectric focusing shows that the same sample has species ranging from pI < 4 to pI > 10. [30] This
326
exact same ZDHH range may be calculated from electrophoretic mobility measurements published 80
327
in the range for human serum poly IgG. It is not clear whether there are any physiological or
329
medical consequences associated with a mAb ZDHH that falls outside the normal physiological
330
range. Thus, these results are presented in the hopes of stimulating further research.
331
332
Figure 9. ZDHH distribution for freshly prepared human IgG in DPBS. ZDHH was calculated for T = 20 oC,
333
viscosity = 0.98 cp, electric field = -14.88 V/cm, ionic strength = 0.167 M, conductivity = 16.6 ms, protein
334
radius = 5.5 nm, counterion radius = 0.18 nm, D = 78. The ZDHH for the twelve intact IgGs in this study are noted
335
(inverted triangles) along with bars indicating the measurement uncertainty.
336
5. Conclusions
337
Protein charge contributes to producing the colloidally stable mAb solutions needed during
338
development, manufacture and formulation. At this time, protein charge cannot be calculated with
339
any accuracy by even the most detailed structural information using the most sophisticated
340
algorithms. Protein charge, however, is readily measured with accuracy and precision. In this first
341
systematic and comprehensive examination of the charge on IgGs it is clear that: 1) IgGs bind
342
significant quantities of anions, 2) anion binding will contribute to the desolvation energy, thus
343
preventing IgG aggregation, 3) mAb charge measurements may be useful in selecting candidate
344
molecules for development and 4) mAb charge measurements under physiological conditions may
345
be useful in determining whether a candidate molecule falls within the normal range for human
346
IgGs.
347
Author Contributions: Conceptualization, D.Y., T.L., S.S., and R.K-B.; Methodology, T.L and D.Y.; Analysis,
348
D.Y. T.L.; Investigation, D.Y.; Resources, R.K-B.; Original Draft Preparation, D.Y and T.L.;
Writing-349
Review & Editing, R.K-B. and S.S.; Supervision, R.K-B. and T.L.; Project Administration, R.K-B. and T.L.;
350
Funding Acquisition, R.K-B and S.S..
351
Funding: Boehringer-Ingelheim
352
Acknowledgments: The authors wish to thank Boehringer-Ingelheim for supporting the doctorate research of
353
Danlin Yang, a portion of which is published here. Special thanks to her Ph.D. committee members, David Hayes
354
and Christopher Roberts, who encouraged this work and offered helpful advice. We also are thankful for the
355
encouragement and interest expressed by the members of the Biomolecular Interactions Technology Center
356
(BITC). This paper is dedicated to the memory of Eric and Betty Laue.
Conflicts of Interest: The authors declare no conflict of interest.
358
References
359
1. Tiselius, A.; Kabat, E. A. An electrophoretic study of immune sera and purified antibody
360
preparations. J. Exp. Med. 1939, 69, 119–131.
361
2. Filoti, D. I.; Shire, S. J.; Yadav, S.; Laue, T. M. Comparative study of analytical techniques for
362
determining protein charge. J. Pharm. Sci. 2015, 104, 2123–2131, doi:10.1002/jps.24454.
363
3. Yang, D.; Correia, J. J.; Iii, W. F. S.; Roberts, C. J.; Singh, S.; Hayes, D.; Kroe-Barrett, R.; Nixon,
364
A.; Laue, T. M. Weak IgG self- and hetero-association characterized by fluorescence analytical
365
ultracentrifugation. Protein Sci. 2018, 27, 1334–1348, doi:10.1002/pro.3422.
366
4. Cohn, E. J. Studies in the physical chemistry of the proteins: I. the solubility of certain proteins
367
at their isoelectric points. J. Gen. Physiol. 1922, 4, 697–722, doi:10.1085/jgp.4.6.697.
368
5. Raut, A. S.; Kalonia, D. S. Opalescence in Monoclonal Antibody Solutions and Its Correlation
369
with Intermolecular Interactions in Dilute and Concentrated Solutions. J. Pharm. Sci. 2015, 104,
370
1263–1274, doi:10.1002/jps.24326.
371
6. Shire, S. J.; Shahrokh, Z.; Liu, J. Challenges in the development of high protein concentration
372
formulations. J. Pharm. Sci. 2004, 93, 1390–1402, doi:10.1002/jps.20079.
373
7. Li, L.; Kumar, S.; Buck, P. M.; Burns, C.; Lavoie, J.; Singh, S. K.; Warne, N. W.; Nichols, P.;
374
Luksha, N.; Boardman, D. Concentration dependent viscosity of monoclonal antibody
375
solutions: explaining experimental behavior in terms of molecular properties. Pharm. Res.
376
2014, 31, 3161–3178, doi:10.1007/s11095-014-1409-0.
377
8. Mathews, C. K.; Holde, K. E. van; Appling, D. R.; Anthony-Cahill, S. J. Biochemistry; 4 edition.;
378
Pearson: Toronto, 2012; ISBN 978-0-13-800464-4.
379
9. Tanford, C. Physical Chemistry of Macromolecules; First Edition edition.; John Wiley & Sons Inc:
380
New York, 1961; ISBN 978-0-471-84447-1.
381
10. Moody, T. P.; Kingsbury, J. S.; Durant, J. A.; Wilson, T. J.; Chase, S. F.; Laue, T. M. Valence and
382
anion binding of bovine ribonuclease A between pH 6 and 8. Anal. Biochem. 2005, 336, 243–
383
252, doi:10.1016/j.ab.2004.09.009.
384
11. Her, C.; Filoti, D. I.; McLean, M. A.; Sligar, S. G.; Alexander Ross, J. B.; Steele, H.; Laue, T. M.
385
The Charge Properties of Phospholipid Nanodiscs. Biophys. J. 2016, 111, 989–998,
386
doi:10.1016/j.bpj.2016.06.041.
387
12. Ridgeway, T. M.; Hayes, D. B.; Moody, T. P.; Wilson, T. J.; Anderson, A. L.; Levasseur, J. H.;
388
Demaine, P. D.; Kenty, B. E.; Laue, T. M. An apparatus for membrane-confined analytical
389
electrophoresis. Electrophoresis 1998, 19, 1611–1619, doi:10.1002/elps.1150191016.
390
13. Laue, T. M.; Shepard, H. K.; Ridgeway, T. M.; Moody, T. P.; Wilson, T. J. Membrane-confined
391
analytical electrophoresis. Methods Enzymol. 1998, 295, 494–518.
392
14. Kyne, C.; Jordon, K.; Filoti, D. I.; Laue, T. M.; Crowley, P. B. Protein charge determination and
393
implications for interactions in cell extracts. Protein Sci. Publ. Protein Soc. 2017, 26, 258–267,
394
doi:10.1002/pro.3077.
395
15. Moody, T. P.; Shepard, H. K. Nonequilibrium thermodynamics of membrane-confined
396
electrophoresis. Biophys. Chem. 2004, 108, 51–76, doi:10.1016/j.bpc.2003.10.009.
397
16. Scatchard George The attractions of proteins for small molecules and ions. Ann. N. Y. Acad.
398
17. Gokarn, Y. R.; Fesinmeyer, R. M.; Saluja, A.; Razinkov, V.; Chase, S. F.; Laue, T. M.; Brems, D.
400
N. Effective charge measurements reveal selective and preferential accumulation of anions,
401
but not cations, at the protein surface in dilute salt solutions. Protein Sci. Publ. Protein Soc.
402
2011, 20, 580–587, doi:10.1002/pro.591.
403
18. Miao, L.; Qin, H.; Koehl, P.; Song, J. Selective and specific ion binding on proteins at
404
physiologically-relevant concentrations. FEBS Lett. 2011, 585, 3126–3132,
405
doi:10.1016/j.febslet.2011.08.048.
406
19. Edsall, J. T.; Wyman, J. Chapter 9 - Polybasic Acids, Bases, and Ampholytes, Including
407
Proteins. In Biophysical Chemistry; Edsall, J. T., Wyman, J., Eds.; Academic Press, 1958; pp. 477–
408
549 ISBN 978-1-4832-2946-1.
409
20. Harlow, E.; Lane, D. P. Antibodies: A Laboratory Manual; 1 edition.; Cold Spring Harbor
410
Laboratory Press, 1988; ISBN 978-0-87969-314-5.
411
21. Stafford, W. F.; Braswell, E. H. Sedimentation velocity, multi-speed method for analyzing
412
polydisperse solutions. Biophys. Chem. 2004, 108, 273–279, doi:10.1016/j.bpc.2003.10.027.
413
22. Bjellqvist, B.; Ek, K.; Giorgio Righetti, P.; Gianazza, E.; Görg, A.; Westermeier, R.; Postel, W.
414
Isoelectric focusing in immobilized pH gradients: Principle, methodology and some
415
applications. J. Biochem. Biophys. Methods 1982, 6, 317–339, doi:10.1016/0165-022X(82)90013-6.
416
23. Mao, Q.; Pawliszyn, J. Capillary isoelectric focusing with whole column imaging detection for
417
analysis of proteins and peptides. J. Biochem. Biophys. Methods 1999, 39, 93–110,
418
doi:10.1016/S0165-022X(99)00006-8.
419
24. Hayes, D.; Laue, T.; Philo, J. Program Sednterp: Sedimentation Interpretation Program version 1.09.;
420
Alliance Protein Laboratories: Thousand Oaks, CA, USA, 1995;
421
25. Edsall, J. T.; Wyman, J. Biophysical chemistry; Academic Press: New York, 1958; ISBN
978-0-12-422
232201-3.
423
26. Laue, T. Charge matters. Biophys. Rev. 2016, 8, 287–289, doi:10.1007/s12551-016-0229-3.
424
27. Tomar, D. S.; Kumar, S.; Singh, S. K.; Goswami, S.; Li, L. Molecular basis of high viscosity in
425
concentrated antibody solutions: Strategies for high concentration drug product development.
426
mAbs 2016, 8, 216–228, doi:10.1080/19420862.2015.1128606.
427
28. Saluja, A.; Fesinmeyer, R. M.; Hogan, S.; Brems, D. N.; Gokarn, Y. R. Diffusion and
428
sedimentation interaction parameters for measuring the second virial coefficient and their
429
utility as predictors of protein aggregation. Biophys. J. 2010, 99, 2657–2665,
430
doi:10.1016/j.bpj.2010.08.020.
431
29. Laue, T. Proximity energies: a framework for understanding concentrated solutions. J. Mol.
432
Recognit. JMR 2012, 25, 165–173, doi:10.1002/jmr.2179.