ISSN(Online): 2319-8753 ISSN (Print): 2347-6710
I
nternational
J
ournal of
I
nnovative
R
esearch in
S
cience,
E
ngineering and
T
echnology
(A High Impact Factor, Monthly, Peer Reviewed Journal)
Visit: www.ijirset.com
Vol. 8, Issue 11, November 2019
Study Measurements MTF, LSF and ESF for
the Imaging System Quality Analysis
Doha Adel Abbass
1, Ruaa Adel Abaas
2, Amal Mohammed Qnewie
3,Marwa Kamal Mustafa
4Associate Professor, Department of Mathematics, College of Sciences, University of Mustansiriyah, Iraq1
Researcher, Ministry of Science and Technology, Iraq2,3,4
ABSTRACT:Atest system based on high resolution was developed and a systematic theoretical modulation transfer function MTF, LSF, ESF measurements approach is introduced to measure the quality of imaging systems. The test system is composed of 6 different targets; results are presented using Quick MTF2 software.
KEYWORDS: Imaging system, modulation transfer function (MTF), Quick MTF2 software.
I. INTRODUCTION
The resolution and performance of an optical system can be characterized by a quantity known as the modulation transfer function (MTF), which is a measurement of the microscope's ability to transfer contrast from the specimen to the intermediate image plane at a specific resolution. Computation of the modulation transfer function is a mechanism that is often utilized by optical manufacturers to incorporate resolution and contrast data into a single specification [1] and given by and showed in figure (1)
Modulation (MTF) = (I (max) - I(min))/(I(max) + I(min)) [2] …….(1)
Where
ISSN(Online): 2319-8753 ISSN (Print): 2347-6710
I
nternational
J
ournal of
I
nnovative
R
esearch in
S
cience,
E
ngineering and
T
echnology
(A High Impact Factor, Monthly, Peer Reviewed Journal)
Visit: www.ijirset.com
Vol. 8, Issue 11, November 2019
The modulation transfer function (MTF) is used to approximate the position of best focus of an infrared imaging system. In an imaging system, best focus is typically achieved when the MTF is between 0.4 and 0.6; most often at 0.5 (50% cutoff frequency of the MTF) MTF is inversely related to the minimum resolvable temperature difference (MRTD), which is a measure of an infrared sensor's ability to resolve temperature difference. MTF is defined as the discrete Fourier transform of the line spread function (LSF) can be define as a measure of the ability of a system to form sharp images; in radiology, determined by measuring the spatial density distribution on film of the x-ray image of a narrow slit in a dense metal, such as uranium; from this can be calculated the modulation transfer function. And can be calculated by two different methods. One includes measuring the LSF directly from an idealized line approximation provided by an image of a slit target and given by equation (2).
LSF= (d/dx ) ESF(X) [4]…………(2)
The other involves differentiating the edge spread function (ESF) which is the system response to the input of an ideal edge [5]. As the output of the system is a sampled image, the fidelity of the edge spread function using a single line of image data is insufficient for MTF analysis. Aliasing due to under sampling in the camera, along with phase effects and the angle of the actual edge with respect to the sampling grid will cause variable results for a single line. The phase effects and edge angle may be exploited, however to provide a high fidelity measurement of the ESF. Small changes in the edge angle used during construction of the super-sampled edge affect the quality of the resulting ESF and given by equation (3).
ESF=X-µ/σ [4] ……. (3)
X= the input array of pixel intensity data µ =the average value of the pixel intensity data σ = the standard deviation of the pixel intensity data
ISSN(Online): 2319-8753 ISSN (Print): 2347-6710
I
nternational
J
ournal of
I
nnovative
R
esearch in
S
cience,
E
ngineering and
T
echnology
(A High Impact Factor, Monthly, Peer Reviewed Journal)
Visit: www.ijirset.com
Vol. 8, Issue 11, November 2019
II. OBJECTIVES
To examine the related between MRTD and MTF.
To determine the MTF,LSF,ESF.
To show the resolution and performance of an optical system .
III. MATERIAL AND METHODS
Multiple methods have been proposed for determining the MTF of optical systems on-orbit. These include imaging lines or points and potentially using imagery from a system with known MTF during an under flight (In general, these measurement techniques require a particular size and orientation of targets and scan direction of the sensor to achieve good performance.
Another approach is to use edges to determine MTF. The edge spread function (ESF) is the system response to a high contrast edge. The derivative of the ESF produces the line spread function (LSF), which is the system response to a high contrast line. The normalized magnitude of the Fourier Transform of the LSF produces a one-dimensional slice through the two-dimensional MTF surface. Other methods exist for computing the system MTF directly from the ESF that remove the need for differentiation
A requirement for determining MTF from edges is to have a high fidelity representation of the ESF.
We take many shapes to show MTF, ESF, and LSF in program Quick mtf2, the first step, and the most important too. Minimizing edge detection errors is most critical for getting sensible results. The edge is usually detected by analyzing the line spread function for each pixel line. [4]
Fig (2) an example calculation MTF [9]
IV. RESULT AND DISCUSSION
ISSN(Online): 2319-8753 ISSN (Print): 2347-6710
I
nternational
J
ournal of
I
nnovative
R
esearch in
S
cience,
E
ngineering and
T
echnology
(A High Impact Factor, Monthly, Peer Reviewed Journal)
Visit: www.ijirset.com
Vol. 8, Issue 11, November 2019
BT.709: Kr = 0.2126; Kg = 0.7152; Kb = 0.0722;
BT.601: Kr = 0.299; Kg = 0.587; Kb = 0.114
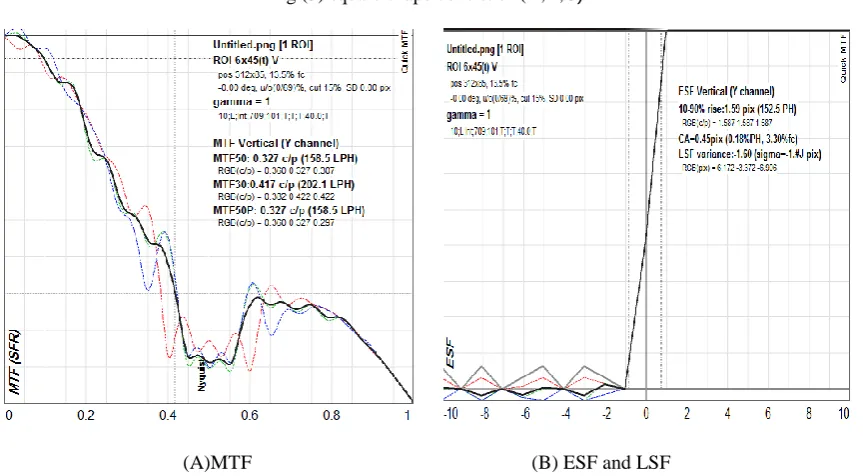
If the "Intensity based" option is used, Quick MTF does not calculate the LSF but only detects the edge by analyzing the intensity distribution by using Quick MTF2 software We takes 2 shapes(square ,half circle ) to show MTF ,LSF ,and ESF curves the MTF measurement approach is introduced to measure the quality of imaging systems and MTFs of two imaging system combinations are calculated and their graphics To compare different shapes products .always check the scaling of the MTF plot and relate the MTF data to actual condition your proposed use of the lens ,for example general purpose or specialized photography (action, landscape, wildlife, ...). The MTF chart can help you to evaluate lens performance (to identify limitations) the MTF charts should be read with accompanying lens performance data (distortion, flare ,...). Above all, look for performance excellence at apertures and focal lengths that are best suited to your photographic technique and range of subject matter. Finally, read photographic magazines and browse manufacturer’s websites, their product reviews (test results) may provide useful advice bellow all the result from software from different shapes by using Quick MTF2 software we take two shapes.
Fig (3) square shape consist of (A,B,C)
ISSN(Online): 2319-8753 ISSN (Print): 2347-6710
I
nternational
J
ournal of
I
nnovative
R
esearch in
S
cience,
E
ngineering and
T
echnology
(A High Impact Factor, Monthly, Peer Reviewed Journal)
Visit: www.ijirset.com
Vol. 8, Issue 11, November 2019
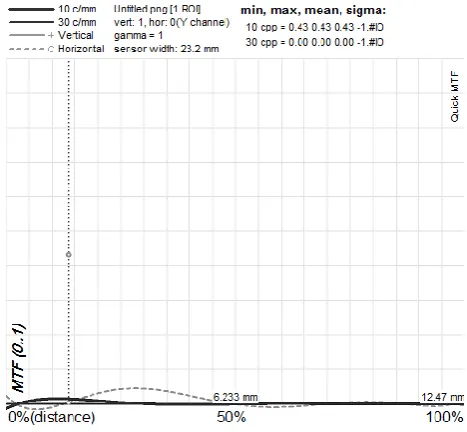
(C)MTF vs. distance to center
ISSN(Online): 2319-8753 ISSN (Print): 2347-6710
I
nternational
J
ournal of
I
nnovative
R
esearch in
S
cience,
E
ngineering and
T
echnology
(A High Impact Factor, Monthly, Peer Reviewed Journal)
Visit: www.ijirset.com
Vol. 8, Issue 11, November 2019
(A)MTF (B) ESF and LSF
(C)MTF vs. distance to center
V. CONCLUSION
ISSN(Online): 2319-8753 ISSN (Print): 2347-6710
I
nternational
J
ournal of
I
nnovative
R
esearch in
S
cience,
E
ngineering and
T
echnology
(A High Impact Factor, Monthly, Peer Reviewed Journal)
Visit: www.ijirset.com
Vol. 8, Issue 11, November 2019
level can make edge detection difficult; in such cases, you might prefer to turn off the linear regression in Quick MTF to calculating the SFR .
The intensities for all lines are accumulated and averaged; with taking the displacement of the edge into consideration the result obtained with interpolation looks more meaningful, because without interpolation, the SFR for any spatial frequency equals one. If correction for the difference schemes is applied, the SFR will even increase with frequency, and that is contrary to the very meaning of SFR the LSF is the first derivative of ESF with respect to coordinate. For calculating the derivative, Quick MTF lets you choose either of the two difference schemes: [-1, 0, 1] and [-1, 1]. The difference between the calculation results will be small but obvious. When the correction is on, the results for the two difference schemes are practically indistinguishable. So, as you can see, the correction really improves the accuracy of calculations. It is advisable to turn off the correction only
REFERENCES
[1]Jain, A., 1989. Fundamental s of Digital Image Processing. Prentice Hall, Englewood Cliffs, NJ, USA.
[2]Boreman, G.D., “MTF in Optical and Electro-Optical Systems”, SPIE Optical Engineering Press, Bellingham, WA, p.1, (2001) [3]P.D.Burns, “Slanted-Edge MTF for Digital Camera and Scanner Analysis”, Proc.IS&T 2000 PICS Conference,pg.135-138, 2000.
[4]Electro Optical Industries, Inc.(2005). EO TestLab Methodology . In Education /Ref. http://www.electro-optical.com/html/toplevel/ educationref.asp.
[5]SPIE: “Modulation Transfer Function” Society of Photo-Optical Instrumentation Engineers,Redondo Beach, California, 1968, Proceedings, Seminar-in-Depth
[6]Gopal, A., Samant, S.S., “Bar-Pattern Technique for Modulation Transfer Function Measurement in Portal Imaging”, Proc. of SPIE, 5030, 433, (2003).
[7]Boreman, G.D., “Modulation Transfer Function in Optical and Electro-Optical Systems”, SPIE PRESS, Tutorial Texts in Optical Engineering, Volume TT52, Washington, (2001).
[8]Kubota, H., Ohzu, H., “Method of measurement for response function by means of random chart,” J. OSA , 47 (7) : 666 ~667(1957).
![Fig (1) the maximum and minimum intensity [3]](https://thumb-us.123doks.com/thumbv2/123dok_us/1541050.1189016/1.595.114.484.580.753/fig-maximum-minimum-intensity.webp)
![Fig (2) an example calculation MTF [9]](https://thumb-us.123doks.com/thumbv2/123dok_us/1541050.1189016/3.595.159.438.493.679/fig-an-example-calculation-mtf.webp)