EVALUATION OF OEE IN A
CONTINUOUS PROCESS INDUSTRY ON
AN INSULATION LINE IN A CABLE
MANUFACTURING UNIT
Disha M Nayak
1, Vijaya Kumar M N
2,
G.Sreenivasulu Naidu
3, Veena Shankar
4Student, II Year M.Tech (MEM), Department of Industrial Engineering and Management, RVCE, Visvesvaraya
Technological University, Bangalore, Karnataka, India 1
Assistant Professor, Department of Industrial Engineering and Management, RVCE, Visvesvaraya Technological
University, Bangalore, Karnataka, India 2
Assistant Manager, Manufacturing Engineer and Lean coach, Lapp India Pvt. Ltd., Bangalore, Karnataka,
India
3Assistant Manager, Quality assurance, Lapp India Pvt. Ltd., Bangalore, Karnataka, India
4Abstract: The exploration for improving productivity in the current global competitive environment has created a need for rigorously defined performance measurement system in a manufacturing process. OEE, a vital KPI of TPM is used to evaluate performance and productivity of the machine. OEE is one of the performance evaluation methods that are most common and popular in the production industries. This paper tries to evaluate the OEE index on insulation unit in a cable organization and identifies the main loss elements of the process. OEE data on machine performance is an initial key point to understand the equipment losses and establish improvement to eliminate them. The results are compared with world class level. Result of the research demonstrates that although the OEE coefficient of the investigated process is not meeting the world class level, however with the continuous improvement, performance of the machine can be acceptable.
Keywords: Performance measurement, Overall Equipment Effectiveness, Key Performance Indicator, Insulation unit, cable organization
I. INTRODUCTION
Globalization has expanded manufacturing organization with competition characterized by both technology push and market pull has forced the manufacturing companies to achieve world class performance through continuous improvement in their products and process. Today various innovative techniques and management practices such as TPM, TQM, and business process reengineering (BPR), ERP and JIT etc. are becoming popular among the business houses. TPM is maintenance program which involves a newly defined concept for maintaining plants and equipment. It is a philosophy designed to integrate equipment maintenance into the manufacturing process. The goal of any TPM is to eliminate losses tied to equipment maintenance or, in other words, keep equipment producing only good product, as fast as possible with no unplanned downtime [3].
TPM is used to drive waste out of the manufacturing process by reducing or eliminating production time lost to machine failures. The goal of any TPM is to ensure that machinery and equipment is always available to manufacture products for the end customer by minimizing rework, slow running equipment and down time, maximum value is added at the minimum cost.
Successful TPM is an effort where the entire organization works together to maintain and improve the equipment. As an initial initiative it is critical to measure even a small change. OEE is a metric originally developed to measure the success of TPM by associating the six big losses with three measurable: Availability, Performance, and Quality. OEE enables organization to benchmark and monitor their progress with simple, easy to understand metrics. OEE provides both a gauge for the success of TPM and a frame work to identify areas that can be improved.
II. OVERALL EQUIPMENT EFFECTIVENESS
The industrial application of OEE, as on today, varies from one industry to another. Though the basis of measuring effectiveness is derived from the original OEE concept, manufacturers have customized OEE to fit their particular industrial requirements. OEE is a way to monitor and improve the efficiency of the manufacturing process. OEE has become an accepted management tool to measure and evaluate machine productivity. OEE is broken down into three measuring metrics of Availability, Performance and Quality. These metrics help to gauge the machine efficiency and effectiveness and categorize these key productivity losses that occur within the manufacturing process. OEE empowers manufacturing companies to improve their processes and in turn quality, consistency and productivity measured at the bottom line [2].
OEE is essentially the ratio of Fully Productive Time to Planned Production Time. In practice, however, OEE is calculated as the product of its three contributing factors:
OEE = Availability x Performance x Quality. OEE = A x P x Q
III. FACTORS OF OEE
Three main contributig factors of OEE are:
Availibility(A)
Performance(P)
Quality(Q)
Figure 1Illustration of main components of OEE
A. AVALIBILITY
The “Availability” portion of the equation measures the percentage of time the equipment or operation was running compared to the available time. A comparison of the potential operating time and the time in which the system is actually making products or providing services. All planned stops and breakdowns will reduce the availability ratio, including set-up times, preventive maintenance, breakdowns and lack of operators.
Availability = Operating Time Planned Production Time
B. PERFORMANCE
The “Performance” portion of the equation measures the running speed of the operation compared to its maximum capability, often called the rated speed. A comparison of the speed/actual output with what the system could be consistently producing in the same timeframe Loss of production due to under-utilization of the machinery. In other words, losses are incurred when the equipment is not run with full speed. Short, unregistered, stops may affect the performance ratio as well.
Performance =Total Pieces Operating Time Ideal Run Rate
C. QUALITY
The “Quality” portion of the equation measures the number of good parts produced compared to the total number of parts made. A comparison of the raw materials (or occurrences) put in to the process and the number of products/services that meet the customer‟s specifications. The amount of the production that has to be discharged or scrapped.
IV.PROBLEMDEFINITION
As per the overall analysis in all the process, Insulation process was found to have a bottle neck as the line balancing was a big issue because insulation being the first stage and hence is input for other stages. Therefore further processes were idle. Since OEE helps in indicating the process, performance and as well as equipment problem. OEE was used as a measurement tool to evaluate the plant productivity. Thus this metric help gauge the machine efficiency, effectiveness and categorize these key productivity losses that occur within the manufacturing process.
V. COREINSULATIONPROCESS
The main scope of core insulation machine used to insulate the copper conductor. To ensure that the insulated conductor meets all the requirements of the specification as per the work order.
The procedure is as follows
Read the work order. Ensure that all required materials are available, if not inform the same to the Production section in-charge. Switch “ON” the Main Control panel and the computer behind the machine. Set temperature of each zone. Load the Work Order specified PVC and colour as in colour code. Load the Work Order specified Bunched copper wires on both the pay-off‟, in such a way that the finishing bunched end of one spool can be welded to the start of the next spool. Pull the bunched copper wire from the pay-off spool through the caterpillar and then the extrusion head through the die and nipple, and then the printing machine, the cooling trough, the accumulator, take-up caterpillar, dancer and on then the spool mounted on take-up. Ensure that the right type of PVC is used by checking with the Work Order and confirming with the inscription on the sacks. Select nipple and Die for a particular bunched wire. Initially set the extruder speed at around 10 rpm; purge the PVC until a homogeneous texture of PVC and colour is obtained. Set the voltage of spark tester on the control panel according to instructions given in the documents. Fix the selected nipple and die into the extrusion head, pull the bunched copper wires along the line unto the take-up-spool. Fasten this to the take-up spool. Switch on the water pump. Arrange empty spools on the take-up conveyor. All the above points must be checked again, before starting the line. Set the line tension between pay-off and Take-up caterpillar according to the graph on the control panel. Operate Decrease / Increase buttons under the heading PULL to decrease or increase the tension of the line respectively.
Switch the selector switch of the line to STARTING mode and selector switch of extruder to INDEPENDENT/ SYNCHRONISED as required. Independent push button is used while purging the PVC from the extruder to obtain the right blend. Synchronised push button is used when the line is in operation and also the colour-mixing device when the colour-mixing device is simultaneously put on. Switch ON the line by pressing START push button and extruder push button. Close the molten PVC discharge port; observe the diameter and finish of extruded core. To adjust the diameters required increase or decrease the speed of extruder using push buttons. The pull increase or decrease is used to give proper tension to the bunched copper wires entering the extrusion head.
At the take-up unit feed empty spools on the ramp and take-up pintails. Start the machine by pressing the start button on the control panel under the heading „Line‟. Check for the diameter of the core on the control panel and turn the knob to „Production‟ on Control Panel. Empty the exit ramp as the spools are being filled up. After completion of the spools unloaded paste the label and offer to QC. Clean the machine and it‟s surrounding at the end of every shift and update the daily report, and hand over the scrap to QC.
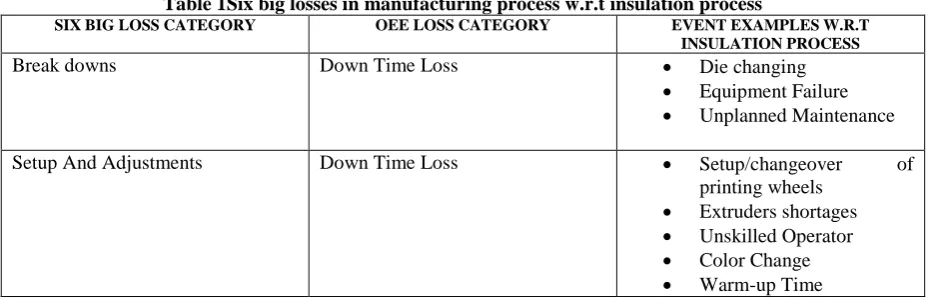
VI.SIX BIGLOSSESINMANUFACTUINGPROCESSWITHRESPECTTOINUSLATION
Looking at machine operation, we distinguish six types of waste we refer to as losses, because they reflect lost effectiveness of the equipment. These six big losses are grouped in three major categories: downtime, speed losses, and quality losses. The major goals of OEE are to reduce and/or eliminate the most common causes of efficiency loss in the manufacturing process [14].
Table 1Six big losses in manufacturing process w.r.t insulation process
SIX BIG LOSS CATEGORY OEE LOSS CATEGORY EVENT EXAMPLES W.R.T
INSULATION PROCESS
Break downs Down Time Loss Die changing
Equipment Failure
Unplanned Maintenance
Setup And Adjustments Down Time Loss Setup/changeover of printing wheels
Extruders shortages
Unskilled Operator
Color Change
Small Stops Speed Loss Cleaning of the nozzle
Color trail
Temperature setting
Components Blocked
Hopper Problem
Mesh Block
Reduced Speed Speed Loss Equipment Wear
Slow speed in CL2 Cu
Under Design Capacity Start-up Rejects Quality Loss Scrap
Rework
Printing problem
Diameter variations
Color Variations Production Rejects Quality Loss Scrap
Rework
Semi print problem on cables
No print problem
Texture Change (Core finish)
VII. CALCULATIONOFOEE
Working days in a month = 25 days
No. of shifts in a month = 25 × 3
Shift length = 8 hours = 480mins
Short break = 0 mins (machine will not stop)
Meal break = 0 mins
Down time (machine + setup time) = 60 + 90
= 150 mins
Total length = 60,000 mts
Rejected length = 1096.77 mts
A. AVALIBILITY
Availability = Operating Time / Planned Production Time Planned Production Time = Shift Length – Breaks = 480 - 0
= 480 min
Operating Time = Planned Production Time - Down Time = 480 – 150
= 330 min
Availability = 330 / 480 = 0.6875*100 Availability = 68.75%
B. PERFORMANCE
Performance = (Total length / Operating Time) /Ideal Run Rate = (60,000 length / 330 minutes) / 400 lengths per minute = 0.4545 or 45.45%
Performance = 45.45%
C. QUALITY
Quality = Good length / Total length Good length = Total length - Reject length = 60,000 – 1096.77
Quality = 58903.23 – 60,000 = 0.9817 or 98.17% Quality = 98.17%
D. OVERALL EQUIPMENT EFFECTIVENESS
OEE = Availability x Performance x Quality = 0.6875 x 0.4545 x 0.9817
= 0.3069 or 30.69% OEE = 30.69%
VIII. RESULTANDDISCUSSION
The OEE tools were used to compute the OEE for the insulation process. OEE breaks the performance of a manufacturing unit into three separate but measurable components: Availability, Performance, and Quality gives OEE process. OEE of insulation process is 52.93%.the average OEE for the insulation process is as shown in the graph.
Figure 2 Graphical representation of OEE and its components
There are three main time losses during which are downtime loss, speed loss, quality loss. These losses are important to identify for calculation of OEE and to evaluate effectiveness and efficiency of the machine.
IX.CONCULSION
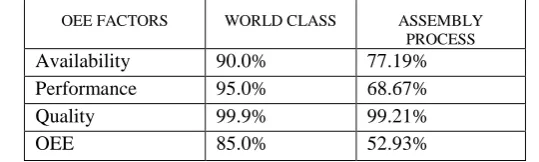
Comparison between World Class and Insulation process OEE rates:
Table 2 Comparison of World Class OEE factor And insulation process factor
OEE FACTORS WORLD CLASS ASSEMBLY
PROCESS
Availability 90.0% 77.19% Performance 95.0% 68.67% Quality 99.9% 99.21%
OEE 85.0% 52.93%
The main aim of taking up this study in the company was to calculate the OEE which gives us an understanding about the machine efficiency and in turn gives the right percentage of the machine utilization there by helping us to detect the bottlenecks. According to performed studies on OEE factors in insulation unit, the Availability is 77.19%, Performance is 68.67%, and Quality is 99.21%. The achieved result show distance between OEE in this process and World Class Level. Therefore the world class level OEE for continuous production process is 85%. The major reason for the distance is performance factor level in this process. In order to reach to world class level, insulation process performance level has to enhance to 95%. On the other hand current level is 68.67% lower than what is necessary to reach to world class level.
Identify and measure 6 big losses of this process were other aim of the research. These losses mainly are downtime losses, speed losses, quality losses which affect OEE. To minimize these losses and to achieve world class OEE there should be reduction in events which are discussed in six big losses section. The main events which are responsible for losses in insulation process are:
77.19
68.67
99.21
52.93
0.00 20.00 40.00 60.00 80.00 100.00 120.00
Die changing
Setup/changeover time of printing wheels
Extruder shortages
Colour change
Semi skilled operators
Slow speed for different class of copper
Temperature settings
Smoke from Herkula ink affects the health of operators
It is important to reduce these non productive events which affect efficiency of the process. They can be reduce by implementing new techniques and tools, standardized speed for running the line, skilled labours, special purpose machinery which wont affects the environment of the shop floor etc.
A. FUTURE RECOMMENDATIONS
The scope of improvement for the future course is highlighted by the recommendations which were done by a series of brain storming sessions and visiting the shop floor, observing the daily activities of the operators and the works. This study selected the area of OEE and conducted an appropriate study on the subject. On the basis of the theory studied and analyzed, a set of recommendations were suggested in order to improve the OEE thereby increasing the output of the machine.
Table 3 Recommendation for insulation process
AREA OF OPPORTUNITY
RECOMMENDATIONS BENEFITS
Core Extrusion (Insulation)
Use of the wind turbines in the shop floor.
Line speed of the machine should be increased.
Operators can get rid of health hazards.
Increases the productivity.
REFERENCES
[1] Nazism Baluch, Che Sobry Abdullah, Shahimi Mohtar, “Measuring OEE in Malaysian Palm Oil Mills”, Interdisciplinary Journal of
Contemporary Research in Business, Vol. 4(2), pp. 733-743, June 2012.
[2] M. Lesshammar, “Evaluation and Improvement of Manufacturing Performance Measurement system – the role of OEE”, International journal
of operations and production management, vol. 19(1), pp. 55-78, 1999
[3] M. Maram, G. Manikandan, and K. Thaigarajan, “ overall equipment effectiveness measurement by weighted approach method”, International
Multi Conferenence Of Engineers And Computer scientists, vol. 2, March 2012 .
[4] Anantharaman.N, Nachiappan.R.M., “evaluation of overall line effectiveness (OLE) in a continuous product line manufacturing system”,
Journal of Manufacturing Technology Manufacturing system, vol. 17, No. 7, pp. 987-1008, 2006.
[5] Ki-Young Jeong, Don T. Phillips, “Operational efficiency and effectiveness measurement”, International Journal of Operations & Production
Management, Vol. 21 No. 11, pp. 1404-1416, 2001.
[6] Soheil Zandieh, Seyed Akbar Nilipuor Tabatabaei, Mahsa Ghandehary, “Evaluation of Overall Equipment Effectiveness in a Continuous
Process Production System o Condensate Stabilization Plant in Assalooyeh”, Interdisciplinary Journal of Contemporary Research in Business, vol. 3, No.10, February 2012.
[7] Chan, F.T.S., Lau, H.C.W., Ip, R.W.L., Chan H.K., Kong.S. “Implementation of Total Productive maintenance: a case study”, International
Journal of Production Economic, Vol. 95, pp. 71-94.
[8] Naderinejad .M, Nilipour Tabatabaei .S.A, “Comparison of OEE in Continuous Production Line of Isomax unit of Esfahan Oil Refining
Company (EORC) with World Class Manufacturing”, Interdisciplinary Journal of Contemporary Research in Business, Vol. 3 , No. 6, pp. 466-482, 2011.
[9] Dal .B, Tugwell.P, Greatbanks.R, “ Overall Equipment Effectiveness as a measure of operational improvement” , International Journal of
Operational and Production Management, Vol. 20, No. 12, pp. 1488-1502, 2000.
[10] Muthiah. K.M.N, Huang.S.H, “Overall throughput Effectiveness (OTE) Metric for factory level Performance Monitoring and Bottleneck
Detection”, International Journal of Production Research, Vol. 45, No. 20, pp. 4753-4769, 2007.
[11] Andre Icso, Circonix Technologies, LLC Ringwood, NJ, “Overall Equipment Effectiveness Improvement A Case for Retrofits”.
[12] Pintelon, Liliane; KULeuven, CIB muchiri, peter; KULeuven, CIB, “Performance measurement using overall equipment effectiveness (OEE):
Literature review and practical application discussion”, International Journal of Production Research, Vol. 46, pp. 1-46, 2008.
[13] Frost & Sullivan‟s, “Improving Plant Performance: Overall Equipment Effectiveness (OEE)”, White Paper, 2005.
[14] Soniya Parihar, Sanjay Jain, Dr. Lokesh Bajpai, “Calculation of OEE for an Assembly Process”, International Journal of Research in
Mechanical Engineering and Technology, Vol. 2, issue 2, pp. 25-29, July – Dec 2012.