American
Society of Range Management
The American Society of Range Management was created in 1947 to foster advancement in the science and art of grazing land management, to promote progress in the conservation and greatest sustained use of forage and soil resources, to stimu- late discussion and understanding of scientific and practical range and pasture problems, to provide a medium for the exchange of ideas and facts among society members and with
allied technologists, and to encourage professional improvement of its members.
Persons shall be eligible for membership who are interested in or engaged in practicing range or pasture management or animal husbandry; administering grazing lands ; or teaching, or conducting research, or engaged in extension activities in range or pasture management or related subjects.
T
he JOURNAL OF RANGE MAN- AGEMENT, published b&monthly, is the official organ of the American Society of Range Management. The Society, however, assumes no responsibility for the statements and opinions expressed by authors and contributors.Office, Executive Secretary. Address all inquiries and correspondence including memberships, renewals, replacements of JOURNALS, etc., to Executive Secretary, American Society of Range Management, P.O. BOX 5041, Portland 13, Oregon. Dues. Membership dues should be sent to the Executive Secretary. The dues are $&OO per year including a subscrip- tion to the JOURNAL OF RANGE MAN- AGEMENT. Dues for student members are $4.00 per year, including the JOURNAL. All subscriptions mailed outside the North American continent and insular possessions of the U. S. are $8.50 per year. Subscrip- tions must be paid in advance. Remit by draft or check on U. S. banks in U. S. funds. Repriniing. The reprinting of articles or parts of articles published in the JOURNAL OF RANGE MANAGEMENT is author- ized on the express condition that full credit be given the JOURNAL and the author. The date of original publication must be shown with the credit line.
Post Office Enfry. Second-class post- age paid at Portland, Oregon, and at, ad- ditional offices.
Change of Address. Notices of change of address should be received by the Execu- tive Secretary one month before the date of issue on which the change is to take effect. Both the new and old addresses should be sent to the Executive Secretary, American Society of Range Management, P.O. Box 5041, Portland 13, Oregon.
Priniers. The Nebraska Farmer Company, 1420 P Street, Lincoln, Nebraska.
Copyright 1960 by the American Society of Range Management.
JOURNAL OF RANGE MANAGEMENT
EDITOR E. J. WOOLFOLK
Pacific Southwest Forest & Range Exp. Sta. Berkeley 1, California
EDITORIAL BOARD 195860
ARNOLD HEERWAGEN W. R. HANSON
Soil Conservation Service Eastern Rockies Forest 321 New Customs Building Conservation Board
Denver 2, Colorado Calgary, Alberta 1959-61
GEORGE E. GLENDENING U.S. Forest Service
DONALD R. CORNELIUS Tempe, Arizona JACK R. HARLAN Agricultural Research Service
P. 0. Box 245 Oklahoma State University Berkeley 1, California Stillwater, Oklahoma
1960-62 F. A. BRANSON U.S. Geological Survey
Federal Center Denver, Colorado
L. T. BURCHAM LYNN RADER
California Division of Forestry
Sacramento, California University of California Berkeley, California OFFICERS OF THE SOCIETY
President: FRED H. KENNEDY
U. S. Forest Service Albuquerque, N. Mex. President Elect:
V. A. YOUNG
Executive Secretary: JOHN G. CLOUSTON 733 West 2nd St. P. 0. Box 5041
Mesa, Arizona Portland 13, Oregon BOARD OF DIRECTORS
1958-60
JAMES L. FINLEY MELVIN S. MORRIS
P. 0. Box 136 University of Montana Gilbert, Arizona Missoula, Montana
1959-61
JOHN CHOHLIS C. H. MCKINNON
Western Livestock Journal LK Ranches, Ltd. Sacramento, California Calgary, Alberta
1960-62
KARL G. PARKER GERALD W. THOMAS
Montana State College Texas Technological College
Bozeman, Montana Lubbock, Texas
Past President: DONALD F. HERVEY Colorado State University
Fort Collins, Colorado
IN THIS
ISSUE
Effect of Mima-Type Microrelief on Herbage Production of Five Seeded Grasses in Western Colorado..._... ____ ______ _________ William J. McGinnies 231 Grazed Glades Can Grow Good Grass... ____ _ _..____________ Robert F. Buttery 234 An Evaluation of Big Game Winter Range in Southwestern Alberta
George J. Mitchell and Robert G. H. Cormack 235 Effects of Deferred-Rotation and Coniinuous Grazing on Yearling Steer
Gains and Shorfgrass Prairie Vegetation of Southeastern Alberta
S. Smoliak 239 Yield, Qualify, and Fertilizer Recovery of Crested Wheafgrass, Bromegrass.
and Russian Wildrye as influenced by Fertilization
D. E. Smika, H. J. Haas, and G. A. Rogler 243 A Procedure for Rapid Collection, Processing, and Analysis of Line
Intercept Data ___.________ ____ ___ ______ ______.____ _____ _ ___._ _ _.__ _ .____________ George M. Van Dyne 247 Determining Correct Stocking Rate on Range Land . . . .._.._.__L. A. Stoddart 251 Can Fertilizers Effectively Increase Our Range Land Production
J. K. Patterson and V. E. Youngman 255 Winter Germination of Intermediate Wheafgrass on Mountain Lands
A. C. Hull, Jr. 257 Technical Notes
A Modification For the Point-Frame Method of Sampling Range
Vegetation ._..._...~____________________.____~.__________~_N. J. Nerney 261 A Useful Device for Sampling Undersfory Woody Vegetation
Thomas H. Ripley, Frank M. Johnson, and William P. Thomas 262 Common-Range Technique in Supplemental Feeding Experimenis
L. B. Whitaker and V. L. DuvaZZ 263 Book Reviews: The Sfockman’s Handbook (Ensminger); Hydrology
(Wisler and Brater); An Introduction fo the Plant Kingdom (Russell); The Plant Kingdom, A Laboratory Manual (Lemon and
Russell); Taxonomy of Flowering Plants (Porter) _______________________________________ 264 Current Literature ______________ ____ ____________ ____ _ ______ _ ________ __ _____ ___________ ____ ________________________________ 266 With the Sections __________ ______ _._____..__ .__________ ____ ______ _____________________________________________~____________ 267
Range Student Roundup _____________.________________.__________________.______________~______~~~_~~____________~_____ 269
News and Notes ________________.________________________~_______________________________________________.__~___~_______________ 271
Society Business ______________________________.____________._______________________________________________________~__________ 274
Cover Photo-READING
THE
RANGE
Journal of
RANGE
MANAGEM
September, 1960 Volume 13, Number 5
ENT
Effect of Mima-Type Microrelief on
Herbage Production of Five Seeded
Grasses in Western Colorado1
WILLIAM J. McGINNIES
Range Conservationist, Crops Research Division, Agri- cultural Research Service, U. S. Department of Agri- culture, Fort Collins, Colorado
Mima-type microrelief h a s been commonly observed in the treeless areas of the western United States. This microrelief is characterized by low mounds or soil pimples, commonly called “Mima mounds” after the Mima Prairie in western Washington, where they were described by Dalquest and Scheffer, (1942). Some contend that the Mima mounds are a result of physical actions of ice wedges and erosion
(Newcombe, 1952; Ritchie, 1953)
while others feel that the
mounds are built largely by the activity of fossorial rodents such as pocket gophers or prairie dogs
(Arkeley and Brown, 1954).
Present evidence tends to favor the formation of the mounds by rodents in Colorado and adjacent areas. The subsoil in mounded areas usually contains a cemen- ted hardpan, bedrock, gravel bed, or water table, which limits root growth and the activity of fossorial rodents. In Colorado,
IContribution from the Crops Re- search Division, Agricultural Re- search Service, U. S. Department of Agriculture in cooperation with the Rocky Mountain Forest and Range Experiment Station, Forest Service, U. S. Department of Agriculture, and the Colorado AgricuZturaZ Experi- ment Station.
the mounds vary in height from less than a foot to several feet and in diameter from 15 to 25 feet; the diameter is approxi- mately equal to the territory of a pocket gopher. The mounds may be closely or widely spaced.
The presence of Mima-type
microrelief in Colorado has been reported by Scheffer, (1958). Dalquest and Scheffer (1942) re- ported that in Washington her- bage production on top of Mima mounds was greater than be- tween the mounds in spite of pocket gopher disturbance on the mounds. The writer observed the same pattern of higher yields on the mounds in a range seed- ing study area on the Uncom- pahgre Plateau, in western Colo- rado.
In 1959 a study was made to determine the extent of the effect of Mima mounds on the variability of herbage produc- tion of five seeded grasses. This study is reported herein.
Description of Area
The study area is on 25 Mesa, a part of the Uncompahgre Plateau, 25 miles southwest of Delta, Colorado (Figure 1). Elevation is about 8000 feet, and the average annual precipitation is estimated to be 17 inches. The
231
site, an opening in the ponderosa pine forest, was dominated by big sagebrush (Artemisia triden- tutu) before seeding. Soil parent material is sandstone.
The sagebrush was removed with a brushland plow in 1949. One-tenth-acre p 1 o t s w e r e seeded by the Rocky Mountain Forest and Range Experiment .
Station, U. S. Forest Service, in 1949, 1950, 1952, and 1953 to in- termediate wheatgrass (Agro- pyron intermedium), c r e s t e d wheatgrass (A. desertorum),
smooth brome (Bromus iner-
mis), Russian wildrye (E Zymus junceus), and big bluegrass (Pea umplu). Some light grazing by cattle and horses had been per- mitted in recent years, but the area was protected during the first few years following plant- ing of the grasses.
232 McGINNIES
FIGURE 1. General view of study area on Uncompahgre Plateau in western Colorado, showing typical Mima-type microrelief.
Methods
Only those few mounds and adjacent intermound areas that were entirely within a seeded plot were sampled. Because the seeded plots were long and nar- row, very few mounds fit this requirement. Of the 10 mounds sampled, 3 had been planted to intermediate wheatgrass, 3 to crested wheatgrass, 2 to smooth brome, and 1 each to Russian wildrye and big bluegrass. Her- bage samples were clipped from one 9.6-sq. ft. plot on top of each mound and one 9.6-sq. ft. plot on the adjacent intermound area in late July, 1959. The plots were systematically picked as being representative of the two sam- pling sites. The herbage samples were air-dried and weighed to determine herbage y i e 1 d. A numerical stand rating (0 = no stand, 10 = best possible stand) was made on both the mound and the intermound area just prior to clipping.
Soil samples of the surface 6 inches were taken from the plots after the herbage was clipped. These samples were analyzed by Colorado State University for
%-and 15-atmosphere mois-
ture percentages, soil texture, pH, soluble salts, organic matter, phosphate (P205), and potassium (K20).
Results and Conclusions Great differences in the abili- ties of these five cool-season species to produce herbage on
mound and intermound areas
were observed (Table 1). Air-dry herbage yields from the tops of the mounds were greater than the yields from between the mounds, by an average of 94 per- cent (intermediate wheatgrass), 180 percent (crested wheatgrass), 323 percent (smooth brome), 358 percent (Russian wildrye), and 542 percent (big bluegrass). The
reasons for the consistently higher yields on tops of the mounds are not entirely clear, but the differences are apparent- ly a result of differences in stand quality, soil fertility, and soil volume above the bed rock. These are discussed separately below.
Stand quality (as indicated by stand ratings) was better on top of the mounds, where the aver- age rating was 8.0 (out of a possi- ble 10) as compared with an average of 5.1 between the mounds. Stand ratings on the mounds were better than inter- mound ratings by 29 percent for Russian wildrye, 43 percent for intermediate wheatgrass, 45 per- cent for crested wheatgrass, 67 percent for big bluegrass, and 183 percent for smooth brome (Table 1). Whether the higher ratings on the Mima mounds are a result of better initial es- tablishment of the seedings or a result of greater drouth mortal- ity between the mounds could not be determined. However, the plants on the mounds were gen- erally more robust despite their higher density, but variation be- tween species was great. For ex- ample, while Russian wildrye
Table 1. Average herbage yields and stand ratings of five grasses on fop of and between Mima mounds in western Colorado. 1959.
Location No. of Air dry Stand Soil or- of mounds herbage rat- ganic
Species samples studied yield ings matter
(lb/A) (percent)
i
Mound 3 1030 10.0 4.9
Intermediate wheatgrass Intermound 3 530 7.0 2.6
1
Mound 3 1100 7.7 4.5
Crested wheatgrass Intermound 3 393 5.3 2.5
i
Mound 2 635 8.5 4.0
Smooth brome Intermound 2 150 3.0 3.0
1
Mound 1 550 9.0 5.1
Russian wildrye Intermound 1 120 7.0 3.4
I
Mound 1 770 5.0 5.6
Big bluegrass Intermound 1 120 3.0 3.1
Average of all species 1
kound 817 8.0 4.8
had only a ‘29-percent better stand on the mound, it had a 358- percent higher yield on the mound, but intermediate wheat- grass had a stand 43 percent better on the mound while the yield was only 94 percent great- er. Thus, differences in stand quality alone cannot account for the differences in yield.
Soil pH averaged 6.4 and soluble soil salts averaged .06 percent, but differences between the mound-top and intermound v a 1 u e s were not significant. Phosphorus and potassium aver- aged 70 and 259 pounds per acre on top of the mounds and 58 and 150 pounds per acre between the mounds. Neither of these ele- ments would be considered de- ficient under this arid climate, and limited trials have shown no benefits from adding either of these on other range lands in this area. However, increases in yield
are frequently observed on
seeded stands when nitrogen is added. Soil nitrogen is difficult to measure accurately, but it is usually considered to be propor- tional to organic matter content. Organic matter averaged 4.8 per- cent on the mounds and 2.9 per- cent between the mounds (Table 1). Thus, nitrogen in the surface 6 inches of the soil on the mounds would be about 66 per- cent greater than in the inter- mound areas. This difference in nitrogen no doubt accounts for at least part of the differences in yields.
Percentages of sand, silt, and clay averaged respectively 44.8, 49.9, and 5.3 on top of the mounds and 42.0, 47.5, and 10.5 between the mounds. Field capacity of the
soils (1/3 atmosphere of tension) on top of the mounds and be- tween the mounds averaged 17.5 and 17.7 percent moisture, and wilting point (15 atmospheres) averaged 8.6 and 8.0 percent, re- spectively. Thus, there was no particular difference in the per- centage of moisture available be- tween field capacity and the
MIMA-TYPE MICRORELIEF
wilting point. The soil was more friable and less compact on top of the mounds because of the higher organic-matter content, and the better structure may have had some influence on in- creasing water infiltration and yields. However, because of the underlying sandstone bedrock, the volume of soil available to the plants growing between the mounds is only about half of that available to plants growing on the mounds. Since the avail- able water holding capacity per unit of soil volume is the same for both soils, with twice the volume of soil in the mounds, the plants on the mounds would have access to twice the amount of stored water from winter snows available to the plants growing between the mounds. In this part of western Colorado, where June is a dry month, the stored water would have a very important influence on herbage yields, particularly those of these
cool season species that make much of their annual growth during this dry period. In the dry spring and early summer of 1959, the water stored in the mounds was sufficient for the plants growing on the mounds to mature seed, while the plants in the intermound areas produced mostly vegetative growth and al-
233
most no seed heads (Figure 2). Even in favorable years, seed heads are rare in the intermound areas.
Discussion
The type of mounds mentioned in this study are probably much more common than is generally realized, although in most cases they are not so well developed and obvious as the mounds re- ported here. However, it can be predicted that the effect of the Mima mounds on herbage pro- duction will be similar and will differ only in the degree of effect. The Mima-type micro- relief will frequently show up from the air or on aerial photo- graphs when it is not otherwise easily identifiable. Because of the effect of the mounds on her- bage, recognizing the Mima-type microrelief when it does exist is important if herbage sampling or small-plot studies are contem- plated. Methods can be de- veloped or techniques can be used to reduce the great sam- pling variability that w o u 1 d otherwise be present.
Summary
234 -
McGINNIES
Mima mounds was seeded to in-
termediate and crested wheat-
grasses, smooth brome, Russian
wildrye, and big bluegrass in
1949-53. In 1959 yield deter-
minations and stand evaluations
were made on the mounds and
between the mounds to deter-
mine the effects of microrelief
on the seeded species.
Herbage yields on the Mima
mounds were 94 percent (inter-
mediate wheatgrass) to 542 per-
cent (big bluegrass) greater than
between the mounds. Stands
were better on the mounds by
29 percent (Russian wildrye) to
183 percent (smooth brome).
Nitrogen, as estimated from or-
LITERATURE CITEDganic matter, was 66 percent
ARKLEY, R. J., AND H. C. BROWN.greater on the mounds than in
1954. The origin of Mima mound (hogwallow) microrelief in thethe intermound areas. Although
far western states. Proc. Soil Sci.water holding capacity
was
about the same for both loca-
tions, the depth of soil above
bedrock was twice as great in
the mounds as between the
mounds, allowing greater vol-
ume of water to be stored in the
mounds.
It is suggested that the higher
yields on top of the mounds re-
sult from a combination of better
stands, more nitrogen, and a
greater soil volume available for
water storage.
Sot. Amer. 18: 195-199.
DALQUEST, W. W., AND V. B. SCHEFFER. 1942. The origin of the Mima mounds of western Wash- ington. Jour. Geol. 50: 68-84. NEWCOMB, R. C. 1952. Origin of the
Mima mounds, Thurston County region, Washington. Jour. Geol. 60: 461-472.
RITCHIE, A. M. 1953. The erosional origin of the Mima mounds of southwest Washington. Jour. Geol. 61: 41-50.
SCHEFFER, VICTOR B. 1958. Do fos- sorial rodents originate Mima- type microrelief. 3 Amer. Midland Naturalist. 59: 505-510.
Grazed
Glades
Can
Grow
Good
Grass
ROBERT F. BUTTERY
Range Conservationist, Central States Forest Experi- ment Station, Forest Service, U.S. Department of Agri- culture, Columbia, Missouri1 now on Kalamath National Forest, Yreka, California.
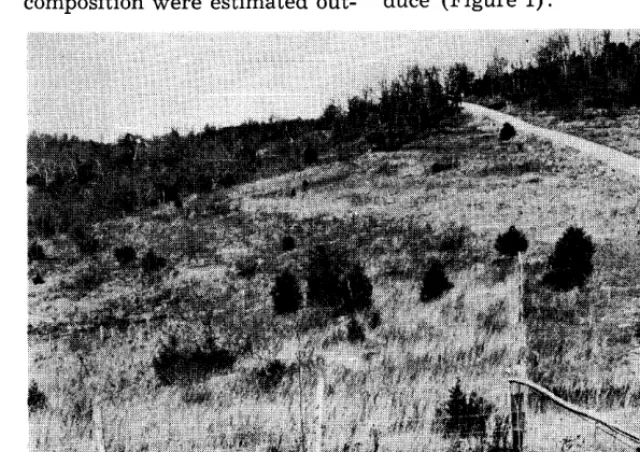
The glades, southwest Mis-
Ocular estimates of herbage
souri’s only natural grasslands, production and composition
have been overused by livestock
were made inside and outside
for many years, and herbage
the exclosures at the end of the
production is far below what it growing season in 1956,1957, and
should be. How much herbage
1958. In 1959 production and
can the glades produce? How
composition were estimated out-
fast do glade ranges recover
from abuse ? What is the reac-
tion of glades to complete pro-
tection from grazing Some an-
swers to these questions were
found by sampling the vegeta-
tion inside and outside two ex-
closures located on the glades.
These small areas, fenced to
exclude livestock, are the Liz-
zard Pen Exclosure, established
in 1938, and the Caney Tower
Exclosure, established in 1956.
Both are about 1 acre in size and
are located on typical
glade
range on the Ava District of the
Missouri National
Forest in
Taney County, Missouri.
side and sampled inside by clip-
ping, sorting to species,
and
weighing the herbaceous vegeta-
tion on eight randomly located,
2.4-square-foot quadrats in each
exclosure.
Observations in the Caney
Tower Exclosure
show that
under complete protection, glade
ranges recover quickly
from
abuse and are capable of pro-
ducing nearly seven times as
much herbage as they now pro-
duce (Figure 1).
IMaintained in cooperation with the School of Forestry, University of Missouri Agricultural Experiment Station, Columbia, Missouri.
234 -
McGINNIES
Mima mounds was seeded to in-
termediate and crested wheat-
grasses, smooth brome, Russian
wildrye, and big bluegrass in
1949-53. In 1959 yield deter-
minations and stand evaluations
were made on the mounds and
between the mounds to deter-
mine the effects of microrelief
on the seeded species.
Herbage yields on the Mima
mounds were 94 percent (inter-
mediate wheatgrass) to 542 per-
cent (big bluegrass) greater than
between the mounds. Stands
were better on the mounds by
29 percent (Russian wildrye) to
183 percent (smooth brome).
Nitrogen, as estimated from or-
LITERATURE CITEDganic matter, was 66 percent
ARKLEY, R. J., AND H. C. BROWN.greater on the mounds than in
1954. The origin of Mima mound (hogwallow) microrelief in thethe intermound areas. Although
far western states. Proc. Soil Sci.water holding capacity
was
about the same for both loca-
tions, the depth of soil above
bedrock was twice as great in
the mounds as between the
mounds, allowing greater vol-
ume of water to be stored in the
mounds.
It is suggested that the higher
yields on top of the mounds re-
sult from a combination of better
stands, more nitrogen, and a
greater soil volume available for
water storage.
Sot. Amer. 18: 195-199.
DALQUEST, W. W., AND V. B. SCHEFFER. 1942. The origin of the Mima mounds of western Wash- ington. Jour. Geol. 50: 68-84. NEWCOMB, R. C. 1952. Origin of the
Mima mounds, Thurston County region, Washington. Jour. Geol. 60: 461-472.
RITCHIE, A. M. 1953. The erosional origin of the Mima mounds of southwest Washington. Jour. Geol. 61: 41-50.
SCHEFFER, VICTOR B. 1958. Do fos- sorial rodents originate Mima- type microrelief. 3 Amer. Midland Naturalist. 59: 505-510.
Grazed
Glades
Can
Grow
Good
Grass
ROBERT F. BUTTERY
Range Conservationist, Central States Forest Experi- ment Station, Forest Service, U.S. Department of Agri- culture, Columbia, Missouri1 now on Kalamath National Forest, Yreka, California.
The glades, southwest Mis-
Ocular estimates of herbage
souri’s only natural grasslands, production and composition
have been overused by livestock
were made inside and outside
for many years, and herbage
the exclosures at the end of the
production is far below what it growing season in 1956,1957, and
should be. How much herbage
1958. In 1959 production and
can the glades produce? How
composition were estimated out-
fast do glade ranges recover
from abuse ? What is the reac-
tion of glades to complete pro-
tection from grazing Some an-
swers to these questions were
found by sampling the vegeta-
tion inside and outside two ex-
closures located on the glades.
These small areas, fenced to
exclude livestock, are the Liz-
zard Pen Exclosure, established
in 1938, and the Caney Tower
Exclosure, established in 1956.
Both are about 1 acre in size and
are located on typical
glade
range on the Ava District of the
Missouri National
Forest in
Taney County, Missouri.
side and sampled inside by clip-
ping, sorting to species,
and
weighing the herbaceous vegeta-
tion on eight randomly located,
2.4-square-foot quadrats in each
exclosure.
Observations in the Caney
Tower Exclosure
show that
under complete protection, glade
ranges recover quickly
from
abuse and are capable of pro-
ducing nearly seven times as
much herbage as they now pro-
duce (Figure 1).
IMaintained in cooperation with the School of Forestry, University of Missouri Agricultural Experiment Station, Columbia, Missouri.
BUTTERY
Tablle 1. Herbage production and percent composition by oven-dry weight, Caney Tower and Lizzard Pen Exclosures, 1959
Caney Tower Lizzard Pen Species 4 years protection 21 years protection
Lbs./acre Percent Lbs./acre Percent -_
I
Little bluestem 1,555 56 1,000 46
Big bluestem 465 17 260 12
Indiangrass 310 11 665 31
Switchgrass 30 1 10 1
Baldgrass 220 8 70 3
Panicgrass 0 0 15 1
Sedges 0 0 40 2
Forbs 195 7 90 4
Total 2,775 100 2,150 100
After one growing season of protection there was very little difference in herbage production and composition inside and out- side the exclosure. However, by the end of the fourth growing season herbage production in- side the exclosure had increased to 2,775 pounds per acre, an in- crease of nearly 600 percent in only 4 years. Baldgrass, (Sporo- bolus neglectus Nash.) which had been the dominant species, had decreased to only 8 percent of the total production while lit- tle bluestem had increased from almost nothing to 56 percent.
Big bluestem (Andropogon ger- ardi Vitman) and Indiangrass, (Sorghastrum nutans (L) Nash.) had increased from a trace to 17 percent and 11 percent, respec- tively.
In 1956, as now, the glades out- side the exclosures were produc- ing about 400 pounds of oven- dry herbage per acre, mostly the less desirable baldgrass and black-eyed Susan (Rudbeckia
hirta L.) with a scattering of the more desirable little bluestem (Andropogon scopurius Michx.) and Indiangrass (Table 1).
Herbage production in the
235
nearby Lizzard Pen Exclosure probably reached a peak 5
or
6 years after fencing, but produc- tion decreased about 25 percent over the years. Such a decrease is typical of the reaction of any grassland area where the old herbage is not removed periodi- cally. After 21 years of complete protection, herbage production has stabilized, because of con- tinued complete protection, at about 2,150 pounds per acre, 23 percent less than production in the Caney Tower Exclosure. The greatest difference was in pro- duction of little and big blue- stem, but the significance of this difference was offset to some ex- tent by greater Indiangrass pro- duction in the Lizzard Pen Ex- closure.Many of southwest Missouri’s glade ranges in poor condition could contribute more to the forage resource of the region if they were given 3 or 4 years of complete protection from graz- ing and moderately stocked thereafter. Complete recovery would probably not be obtained after only 3 or 4 years, but the range should continue to im- prove under moderate grazing.
An Evaluation of Big Game Winter Range
-
in Southwestern Alberta1
GEORGE J. MITCHELL AND ROBERT G. I-I. CORMACK
Provincial Game Biologist, Department of Lands and Forests, Edmonton, Alberta and Professor of Botany, University of Alberta, Edmonton, AZberta, Canada
In southwestern Alberta, topo- graphic and climatic features im- pose a heavy concentration of elk (Cervus cunadensis nelsoni) and mule deer (Odocoileus hemi- onus hemionus) on undersized winter ranges. The problem of managing game herds in this region is further complicated by the fact that these same winter ranges must support large num- bers of cattle and sheep during
the spring and summer months. The study reported herein was initiated in the summer of 1955.
IThis range study was made under the supervision of Mr. E. S. Huestis, Director of Forestry, Alberta De- partment of Lands and Forests. The writers wish to acknowledge the cooperation of the numerous forest officers in the Crowsnest Forest Reserve who assisted with the range census in certain locales and/
It is a follow-up of information gained from ground and aerial counts made during the winters of 1953 and 1954 in the Crows- nest Forest Reserve by the senior author. The study consisted es- sentially of the determination of the density and composition of range grasses and forbs on heavi- ly utilized big game winter ranges and the evaluation of these ranges in terms of their climax status.
or submitted winter big game dis- tribution maps and census figures for elk, moose, deer and bighorn sheep.
236
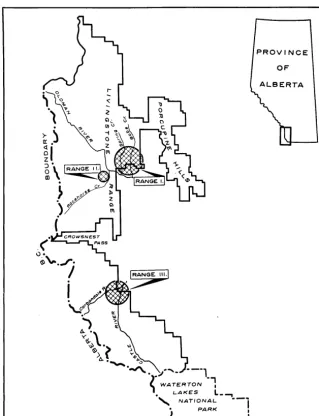
Description of Area The Crowsnest Forest Reserve is a 1,318 square mile tract of land situated in the southwest corner of Albert, (Figure 1) , east
of the Alberta-British Columbia boundary and north of Waterton National Park. The rugged west- ern half of this forested, semi- wilderness area is dominated by the main range of the Rocky Mountains and the Livingstone range to the east, where indi- vidual peaks rise to heights of 8,000 and 9,000 feet. In the east- ern half, the mountainous ter- rain falls away abruptly to roll- ing hills and open prairie. While
it extends approximately 85
miles in a north to south direc- tion its width never exceeds 32 miles and the greater part of the reserve is less than 18 miles wide. This extreme narrowness is an important consideration in th,e management of big game su.mmer and winter ranges. The region is well watered and three major branches of the Oldman River serve to drain all portions of the reserve.
Coniferous forests in varying stages of development occupy a large part of the reserve
(Dwight, 1913; Cormack, 1949, 1953). Although many mountains exhibit rocky and timbered slopes above 7,000 feet, the actu- al proportion of land surface bare of trees due to elevation, soil and slope is rather small.
The characteristic trees and shrubs of this region include: Engelmann spruce (Picea engel- manni), white spruce (Picea glauca), Douglas fir (Pseudot- suga mucronata), limber pine (Pinus flexilis), lodgepole pine (Pinus contorta), alpine fir (Abies Zasiocarpa), white bark pine (Pinus albicaulis), alpine larch (Larix ZyaZZii) balsam poplar (Populus balsamifera), aspen (Populus tremuloides), white birch (Betula papyrifera), saskatoon berry (Amelanchier alnifolia), bearberry (Arctosta- phyZos uva-ursi), pincherry
MITCHELL AND CORMACK
(Prunus pennsylvanica), shrub- by cinquefoil (Potentilla fruti- cosa), prickly rose (Rosa acicu- Zaris), elderberry (Sambucus melanocarpa), snowberry (Sym- phoricarpos occidentalis), rasp- berry (Rubus sp.) and blueberry (Vaccinium sp.). Other com- mon woody plants in the reserve are willow (Salix spp.), and creeping juniper (Juniperus horizontalis).
Although spruce is the climax tree species for the region (Cor- mack, 1953)) repeated fires have prevented the attainment of the climax type in many instances and have encouraged the devel- opment of a lodgepole pine sub-
FIGURE 1. Crowsnest Forest Reserve
climax community. Grasses and sedges are common everywhere on suitable soil in the more mixed stands and on many south exposed slopes where repeated fires have discouraged or de- stroyed tree regeneration. The predominance of grassland along the eastern border of the reserve as well as on the higher slopes of the mountain ranges is an im- portant factor in the winter dis- tribution of elk and deer.
During six years, 1950 to 1955 inclusive, temperatures reached a minimum of 51°F. below zero in January 1950. Below freezing temperatures can be expected even in the summer and below
I LAKES
‘\
NATIONAL 1 1 m ‘.i
.o.-_.-. PARK J!
EVALUATION OF WINTER RANGE 237
zero temperatures may occur during four to six months of the year. The average annual pre- cipitation at one weather station for six years (1950-1955) was 24.71 inches.
Range I, (Figure 1) , encom- passing the valleys of Spring and Bob’s Creeks, is situated below timberline. The hills rise to 1,000 feet above the valleys at eleva- tions under 6,500 feet above sea level. Many of the gently undu- lating hills run in a north-south direction as a series of ridges paralleling the Livingstone range to the west (Figure 2) . A
large proportion of the slopes are treeless or virtually so and sup- port various densities of grassy and herbaceous vegetation. The important elk and deer winter- ing areas center around these grassy slopes which are kept free of snow for an appreciable length of time each winter by the warm chinook winds.
Range II, situated along Race- horse Creek on the west side of the Livingstone range, lies be- tween 5,000 and 6,500 feet in ele- vation and supports heavy stands of spruce and lodgepole pine ex- cept on some south slopes where an open park-like Douglas fir as- sociation occurs.
Range III is situated along the valleys of the Carbondale and Castle Rivers south of the Crows- nest Pass. This elk wintering area has an undulating topog- raphy and most of the hills are
lower than 6,000 feet. Tree growth is mostly confined to the river bottoms and the north and east facing slopes. Lodgepole pine, white spruce and aspen are the most abundant tree species with Douglas fir appearing spo- radically on suitable sites. Wil- low is abundant along the two main water courses.
Methods of Study
The Point Sampler Method described by Clark, et al (1942) was used to measure the compo- sition and density of vegetation on these elk winter ranges. A plant was recorded as hit when any pin of the point sampler hit the main stock of the plant as it emerged from the soil. Plants so hit were recorded as to species and location on field data sheets. This made it possible to deter- mine an individual plant density and composition on each unit of range sampled. A total of 8,400 points was registered on the three major elk winter concen- tration areas, Photographs were taken to record visual aspects of range vegetative growth, general topography and slope.
Range Use
Range I, both in and outside the reserve, is grazed annually by large numbers of wild and domestic stock. More than 1,100 cattle graze the forest reserve portion of this range for 4% to 5 months each year. Big game
aerial and ground counts have shown that the size of elk herd varies from 350 to more than 1,000 ,n,nimals. Mule deer are very abundant too and exhibit similar distribution to elk. This range is also used by a few moose (Alces americana ander- soni) and bighorn sheep (Ovis canadensis canaclensis) .
Even though only about 100 elk winter on Range II, sections of it show the effects of pro- longed, continuous over-utiliza- tion. Moose are present but not abundant at the higher eleva- tion. Approximately 900 cattle each summer exert additional pressure on this range.
The Castle-Carbondale region is grazed by over 1,100 cattle each summer but not all of these are confined to key elk winter range areas. Recently, elk use of Range III has been very heavy. Aerial surveys in 1954 showed nearly 1,000 elk wintering on the area. Later that year, and again in 1955 extensive “either” sex seasons resulted in a 70 percent reduction of this herd.
Results
Originally the Crowsnest For- est Reserve supported a clima% grass vegetation dominated b3 rough fescue (Festuca scabrella,
(Moss and Campbell, 1947). Prow longed use of the grassland in Range I has decreased the rough fescue and increased the second- ary grasses such as bluebunch wheat grass (Agrop yron spica- turn), Parry oat grass (Dantho- nia parryi), June grass (Koeleria cristata) and bluebunch fescue (Festuca idahoensis) . Overgraz-
238 MITCHELL AND CORMACK
Table 1. Vegetative Density and Composition on Ranges I. II and III. Percent density Percent composition
I II III I II III
Forbs
Grasses 24.9
8.7
Shrubs 1.9
Sedges, rushes 9.6
Selaginella, moss, lichens 10.2
All vegetation 55.4
Bare ground 44.6
Totals 100.0
vice-versa, and the unit showing the lowest grass density showed the highest occurrence of sedges (Carex heliophila and Carex spp.) and rushes (Juncus spp.) . This suggests that on this area at least, sedges, rushes and selagi- nella were replacing the grasses. Willows and aspen showed signs of browsing but were too uncom- mon to rank as important winter forage species.
14.3 6.7 15.8 15.0
30.2 19.1
18.0 8.1 1.6 3.4
45.0 31.7
17.0 4.2 8.5 5.5
51.3
17.4 17.9 14.8 1.5 4.4 18.4 3.2 11.7 47.4 37.3 100.0 100.0 100.0 52.6 62.7
100.0 100.0 100.0 100.0 100.0
ranked second to June grass in another.
Discussion
Density and composition of the different plant groups plus some consideration of plant utilization were estimated in assaying the various ranges. Range in satis- factory condition had a high density of grasses and grass-like plants, little bare ground, no evi- dence of accelerated erosion, and a low incidence of over-grazing indicator plants such as selagi- nella, pasture sage, and rosy everlasting. Departures from these criteria indicate poor range condition.
Bare soil and low vegetative density on Range II indicated
marked modification of the
rough fescue association. This grass was recorded only 69 times in 1,500 points and ranked sec- ond in abundance to June grass. Low sedge was hit the greatest number of times while bear- berry, prairie selaginella and pasture sage (Artemisia frigida), made impressive showings. All along the higher reaches of this range, willows showed signs of
extreme browsing and bunch
grasses were heavily grazed. Al- though the greater proportion of this wintering area showed av- erage densities for grasses and forbs, the eastern section was in very poor condition as evidenced by the excessive amount of bare eroded ground (72 percent), and the extremely low density of the grasses (7 percent).
Range III had the lowest vege- tation density of any range sam- pled. Even though grass densi- ties were higher than those in Range II, the low occurrence of sedges, forbs and shrubs sub- stantially reduced the vegetation cover per unit area. Rough fes- cue was the dominant grass in two of the areas examined but
By these guides Range I was found in healthier condition than either Range II or III. It ex- hibited the highest grass density and was the only major elk win- tering area with more than 50 percent of the soil surface vege- tated. This is the most impor- tant big game winter range in the Crowsnest Forest Reserve in terms of the numbers of game animals it supports. Although current trend in range condition was not established, the range vegetation is clearly sub-climax and increases in range use are not desirable at this time.
Range II exhibited a low grass density and relatively high oc- currence of undesirable plants. Undoubtedly the eastern section of Range II is in a critical condi- tion. If there is to be any im- provement of vegetative density and erosion control on this range, future grazing must be extreme- ly light.
Range III had a higher grass
density but less cover over-all than the other ranges. Cowan (1944) found similar conditions on Henry House Flats in Jasper National Park. Although in poor condition these areas ranged much better than those sampled by Cowan in the Athabasca Val- ley of Jasper National Park (1943) where grass and sedge densities did not exceed 10 per- cent of the vegetational cover.
Although elk are primarily re- sponsible for the unsatisfactory condition of Ranges II and III, there is strong evidence that do- mestic stock has contributed ap- preciably to the obvious mis- use of these ranges. At the pres- ent time the elk population is be- ing held to a level which will permit improvement in the re- serve provided additional live- stock pressure is restricted. Al- though the degree of interaction between elk and cattle for forage is unknown, it is believed to be a real factor on Ranges II and III. These key forest reserve areas should receive only light livestock and elk grazing until they show marked improvement and the ability to support heavi- er utilization. An attempt to im- prove range conditions has al- ready been made south of the Crowsnest Pass by reducing the elk population by some 70 per- cent. Reduction in the number of cattle on all key elk wintering areas is the next step toward im- proving range conditions.
LITERATURE CITED CLARKE, S. E., J. A. CAMPBELL and
J. B. CAMPBELL. 1942. An Ecologi- cal and Grazing Capacity Study of the Native Grass Pastures in Southern Alberta, Saskatchewan and Manitoba. Tech. Bull. 44 Dom. Can. Dept. Agric.
CORMACK, R. G. H. 1949. A Study of Trout Streamside Cover in Logged-
over and Undisturbed Virgin Spruce Woods. Canad. Jour. Res. C. 27: 78-95.
CORMACK, R. G. H. 1953. A Survey of Coniferous Forest Succession in the Eastern Rockies. For. Chron. 29: 218-232.
EVALUATION OF WINTER RANGE 239
Mimeo. 72 pp. juries of Game Animals in the Canada, Forestry Branch Bull. 33.
COWAN, I. McT. 1944. Report of Rocky Mountain National Parks Moss, E. H. and CAMPBELL, J. A. Wildlife Studies in Jasper, Banff 1942-1944. Mimeo. 84 pp. 1947. The Fescue Grassland of Al- and Yoho National Parks in 1944 DWIGHT, T. W. 1913. Forest Condi- tions in the Rocky Mountain For- berta. Canad, Jour. Res. C. 25: and Parasites, Diseases and In- est Reserve. Dept. of the Interior, 209-227.
Effects of Deferred-Rotation and Continuous
Grazing on Yearling Steer Gains and
Shortgrass Prairie Vegetation of
Southeastern Albertal
S. SMOLIAK
Experimental Farm, Manyberries, Alberta
The deferred-rotation system of grazing is a rotation scheme whereby grazing is delayed on a portion of the range to allow the primary forage species to gain vigor, set seed, and to per- mit seedlings to become estab- lished. This procedure is in- tended to increase the livestock returns per acre as well as to improve the vegetation.
Most of the deferred-rotation trials (Sampson, 1951) conducted in the northern Great Plains re- gion compared the use of two equal-sized fields, one of which was grazed continuously and the other divided into three equal
paddocks; each paddock was
grazed for approximately one- third of the grazing season. This grazing system allowed the veg- etation in each paddock to de- velop fully in two years out of six and protected it from spring grazing in four years out of six.
Sarvis (1941) and Rogler (1951) showed that two-year-old steers gained more on the de- ferred-rotation pasture than on the continuously grazed pasture at the same grazing intensity, and that continuous grazing caused adverse effects on the
1Contribution from the Research Branch, Canada Department of Ag- riculture, Ottawa, Ontario. W. A. Hubbard, formerly Agrostologist at the Experimental Farm, Manyber- Ties, A 1 b er t a, initiated and con- ducted th.e study until 1953.
vegetation. Clarke et al. (1943) indicated that a system of de- ferred-rotation grazing was su- perior to continuous grazing only with respect to the vegetation. Black and Clark (1942) showed no difference in livestock gains nor in vegetation between alter- nate grazing and continuous use.
Results of clipping tests (Clarke et al., 1943) have shown that yields of herbage on plots clipped to simulate a two-field rotation system were greater by 25.5 percent than those on plots clipped to simulate continuous use. The two-field system of grazing appeared to be better suited to the seasonal develop- ment and life cycle of the prin- cipal forage species than were either the three-field rotation or continuous use. A grazing test to compare the two-field system proposed by Clarke et al. (1943) with continuous grazing was be- gun in 1949 at the Experimental Farm, Manyberries, Alberta.
Materials and Methods A description of the vegetation in the area has been given by Clarke et al. (1942, 1943)) Hub- bard (1951), and Coupland
(1950).
The grazing trial was con- ducted during the years 1949 to 1957 with a grazing season of six months (averaging May 1 to Oc- tober 27). Two 300-acre fields were used for the experimental
pastures. One field was grazed continuously for six months each year. The adjacent field was sub- divided into two equal rotation fields A and B and each rotation field was grazed for one and one- half months in the spring and one and one-half months in the fall every other year and for three months during the summer grazing period in alternate years. The order of grazing rotation during the experimental period is shown in Table 1.
Ten head of grade yearling Hereford steers were used in each of the two pasture systems in 1949 and 1950. As forage util- ization during these two years appeared low, the number of steers in each pasture was in- creased to obtain a moderate in- tensity of grazing. From 1951 to 1957, inclusive, 16 yearling steers were used yearly on each pas- ture, giving a stocking rate of about 19 acres per yearling steer for the six-months grazing sea- son. The cattle had free access to salt and water at all times.
240 SMOLIAK
ization were obtained annually (Calamagrostis montanensis) on by clipping inside and outside all fields and for Junegrass on the 10 cages located in each field. the continuously grazed field.
Initial, bi-weekly and final There were significant decreases weights of the yearling steers in ground cover of Sandberg’s were taken throughout the study. bluegrass (Poa secunda) and the
Table 1. Order of rotating fields during years grazed.
Season grazed
Field designations by letters and years grazed
1949 1950 195119521953195419551956 1957 Spring (May 1 to June 20) A
Summer (June 21 to Sept. 17) B Fall (Sept. 18 to Oct. 27) A
Annual precipitation was low- est during 1949, 1950 and 1952 and equal to or above the 29- year average in the remaining six years (Table 2). Precipita- tion for April to July, inclusive, was lowest during the first and last years of the trial. During the experimental period the means of seasonal precipitation and an- nual precipitation exceeded the means for the previous 20-year period by 20 and 23 per cent, respectively.
Experimental Results
Vegetation
Vegetational analyses of the fields under the two systems of grazing showed no difference in total increase of ground cover of the main for age species, blue grama grass (Bouteloua gracilis), needle-and-thread grass (Stipa comata), Junegrass (Koeleria cristata) and western wheatgrass (Agropyron smithii), after nine years (Table 3). The total grass and sedge ground cover increased slightly more on the rotation fields than on the continuously grazed field, but the difference was not significant.
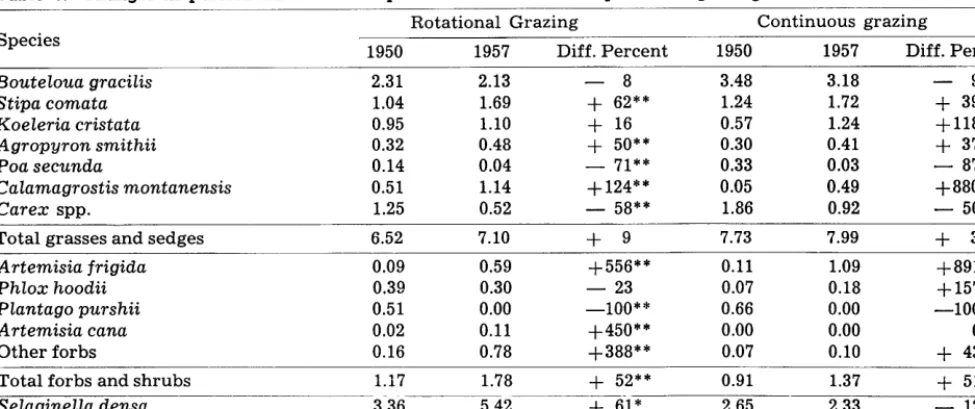
In general, there was an in- crease in ground cover of the mid-grasses and a decrease in the short-grasses over the nine- year period on both the rotation and the continuously grazed fields. Significant increases in ground cover were recorded for needle-and-thread grass, western wheatgrass and plains reed-grass
B A B A B A B A A B A B A B A B B A B A B A B A
sedges (Carex spp.) and a non- significant decrease of b 1 u e grama grass on all fields.
There was no observational evidence of overgrazing under either system of grazing. Clarke and associates (1943) have shown that under heavy grazing the principal forage grasses, needle- and-thread grass, Junegrass, western wheatgrass and, to a less
extent, blue grama, decrease in density while Sandberg’s blue- grass, fringed sage (Artemisia frigida) and low sedge (Carex eleocharis) increase in density. The significantly large increase in ground cover of fringed sage from 1950 to 1957 shows that very favorable climatic condi- tions existed after 1950.
There were no differences in
the increased ground cover of total forbs and shrubs in the fields under the two different systems of grazing. Pursh’s plan- tain (Plantago purshii), the most abundant range weed in 1950, was non-existent in 1957. Moss phlox (Phlox hoodii) increased
significantly on the continuously grazed field but decreased on the rotation fields. Little club moss (SeZagineZZa densa) increased in ground cover on the rotation fields but decreased on the con- tinuously grazed field.
The changes in number of plants of the various species per square meter quadrat generally corresponded with changes in their ground cover (Table 4). The increased number of plants of certain species indicates that some natural reseeding may have occurred on all fields during the years when moisture conditions were favorable. The system of grazing practiced did not appear to affect the degree of natural reseeding. The increase in total number of grass and sedge plants was similar under both grazing systems. The large increase in number of plants of “Other forbs” on the rotation fields was due to the widespread coverage of golden aster (Chrysopsis vil-
Zosa) .
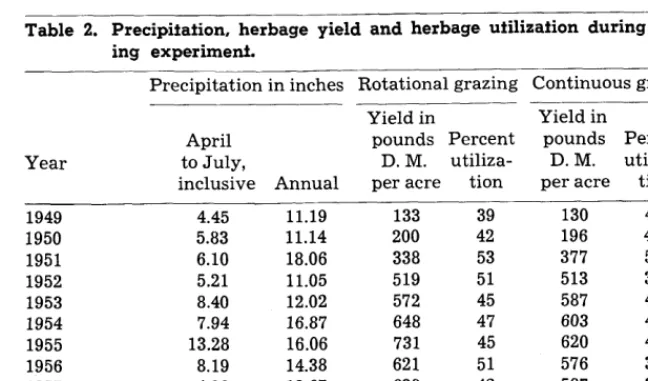
Table 2. Precipitation, herbage yield and herbage utilization during graz- ing experiment.
Year
Precipitation in inches Rotational grazing Continuous grazing
Yield in Yield in
April pounds Percent pounds Percent to July, D. M. utiliza- D. M. utiliza- inclusive Annual per acre tion per acre tion
1949 1950 1951 1952 1953 1954 1955 1956 1957 Av., 9 years
(1949-57) Av., 29 years
(1928-57)
4.45 11.19 133 39 130 45
5.83 11.14 200 42 196 48
6.10 18.06 338 53 377 53
5.21 11.05 519 51 513 37
8.40 12.02 572 45 587 46
7.94 16.87 648 47 603 47
13.28 16.06 731 45 620 45
8.19 14.38 621 51 576 38
4.30 13.67 638 42 587 34
7.08 13.83 489 46 465 44
EFFECTS OF GRAZING 241
Table 3. Changes in percent basal area of plant cover under two systems of grazing between 1950 and 1957. Rotational Grazing Continuous grazing Species
1950 1957 Diff. Percent 1950 1957 Diff. Percent
Bouteloua gracilis 2.31 2.13 - 8 3.48 3.18 - 9
Stipa comata 1.04 1.69 + 62”” 1.24 1.72 + 39**
Koeleria cristata 0.95 1.10 + 16 0.57 1.24 + 118**
Agropyron smithii 0.32 0.48 + 50** 0.30 0.41 + 37**
Poa secunda 0.14 0.04 - 71** 0.33 0.03 - 87**
Calamagrostis montanensis 0.51 1.14 + 124** 0.05 0.49 +880**
Carex spp. 1.25 0.52 - 58** 1.86 0.92 - 50**
Total grasses and sedges 6.52 7.10 + 9 7.73 7.99 + 3
Artemisia frigida 0.09 0.59 +556** 0.11 1.09 +891**
Phlox hoodii 0.39 0.30 - 23 0.07 0.18 + 157**
Plantago purshii 0.51 0.00 -loo** 0.66 0.00 -loo**
Artemisia cana 0.02 0.11 +450** 0.00 0.00 0
Other forbs 0.16 0.78 +388** 0.07 0.10 + 43**
Total forbs and shrubs 1.17 1.78 + 52** 0.91 1.37 + 51**
Selaginella densa 3.36 5.42--- + 61* 2.65 2.33 - 12
* Significant at the 5% level. ** Significant at the 1% level.
Forage production was low in 1949 and 1950 but was greater during the years 1951 to 1957
(Table 2). Although average production of forage on the rota- tion fields was greater than on the continuously grazed field the difference was not significant. The slight increase of forage pro- duction in favor of the rotation fields may be due to deferment of a portion of the field during the growing period of May and early June.
Average estimates of forage utilization over the nine-year pe- riod on the rotation and continu- ously grazed pastures were 46 and 44 percent, respectively. Utilization throughout the ex- perimental period was below the recommended 55 per cent level
(Clarke et al., 1942)) thus allow- ing abundant carryover e v e r y year.
To determine whether nutri- tional differences existed in the herbage on the two pastures, checks on protein content were made during the years 1951 to 1956. Average crude protein de- terminations were 8.43, 5.88 and 3.98 percent on the continuous pasture and 8.42, 5.36 and 3.73 percent on the rotation pasture at the end of the spring, summer and fall grazing periods, respec-
tively. Herbage clipped from the continuous pasture during the summer and fall contained sig- nificantly (P<O.O5) more protein
than herbage from the rotation pasture. This difference in pro- tein content occurred in five out of six years.
Cattle Gains
Average daily and total sea- sonal gains of the yearling steers on the two different systems of grazing are presented in Table 5.
There was a significant (P< 0.01) difference in the total sea- sonal gain made by the steers in favor of continuous grazing. Av- erage seasonal steer gains on the continuous pasture were greater than those on the rotation pas- ture in all years except 1951. Over the nine-year period aver- age daily gains of the two groups of yearling steers were identical during the spring or first grazing period. During the summer or second grazing period daily gains were consistently in favor of the continuous pasture (P<O.Ol) . At this time the steers on rotation grazing were moved to a field which was last grazed the pre- ceding fall and contained more mature forage than that found on the continuously grazed pas- ture. During the fall, or third
grazing p e r i o d, average daily gains were slightly greater on the continuous pasture but the difference was not significant.
Discussion