A STUDY OF DWARFNESS I N WHEAT ACCOMPANIED B Y
UNEXPECTED RATIOS
L. R. WALDKON
North Dakota Agricultural Experiment Station, Agricultural College, North DaZota
Received December 13, 1923
T A B L E OF C O N T E N T S
PA G E
INTRODUCTION ... 212
Original work. . . 216
Offspring of normal plants of family 140.10, . . . 218
Offspring of dwarf plants of family 140.10. . . 221
Two other dwarf families.. . . 226
Family 149.78. . . 230
Family 149.98. . . 231
Plant 140.11.. . . 232
Plant 140.17. . . 234
Results from Red FifeXKota crosses . . . 235
Origin of the factors., . . . 242
SUMMARY.. . . 244
Dwarf and normal plants secured in 1922 from phenotypically normal parents. . . 226
GENERAL DISCUSSION.. . . 237
LITERATURE CITED.. . . 245
INTRODUCTION
Plants markedly deficient in height may suddenly appear and their genetical import claims attention. Plants of this nature have been noted several times in the cereals and also in other groups of cultivated plants. COOK (1915) has classified plants of deficient stature into dwarfs and brachytes. He says, in effect, that a dwarf is a plant markedly deficient in stature and having parts correlated with each other as in the normal plant. A brachytic plant, on the other hand, is one possessing a diminished vertical axis, caused by shortening of the internodes, without a correspond- ing reduction of other parts. He includes in the brachytic class, for example, most of the “dwarf” or “bush” varieties of peas, beans, squashes and tomatoes, the phenomenon being found in other groups of plants also.
DWARFNESS IN WHEAT IN UNEXPECTED RATIOS 213
Striking and excellent examples of brachytic dwarfs1 are found in maize reported upon by different investigators. EAST and
HAYES
(1911) described such a dwarf, having a height of only 18 inches, in a commercial strain of Stowell’s Evergreen sweet corn. The leaves were broad but short, while the plant had the appearance of having been telescoped down upon itself. Satisfactory genetical data on this plant were not secured. Dwarf plants of a brachytic type were found by EMERSON (191 1) in three families of maize. Families coming from self-pollinated phenotypically normal plants contained dwarf and normal plants in the ratio of 24 to 107. Later studies by EMERSON and EMERSON (1922) revealed the character inherited as a simple recessive to normal.KEMPTON (1920) crossed two varieties of maize, designated Chinese and Algerian. I n the Ft generation about one-fourth of the plants were of a pronounced dwarf type. When these were selfed or intercrossed, brachy- tic dwarfs were uniformly produced. Crosses of these dwarfs with normal plants produced normal F1 offspring with a simple 3-to-l segregation in
the succeeding generation, the dwarf form being simply recessive. I n this case dwarf plants appeared when two very distinct varieties of maize were crossed, but as they also appear in self-fertilized commercial strains, this fact evidently has but little bearing upon the origin of the factor. Further work by KEMPTON (1923) has revealed another maize form, of diminished stature, which he considers a true dwarf, not brachytic. Crosses between his two dwarf forms result in entirely normal plants in the f.rst generation. The genes for the two characters of dwarfness must be located in separate chromosomes.
EMERSON (1916) has made a detailed study of bush and twining beans, from a genetical standpoint. He states that the bush bean differs from the twining bean only in its habit of growth. The bushkbean growth is determinate while that of the pole bean is indeterminate. The bush habit, in contrast to the twining habit of pole beans, is conditioned by a smaller number of internodes and also by a relatively small mean internode length. This latter condition evidently has not been brought about by a general shortening of the axis, but rather by a cessation of axial growth early in the period of growth-rate acceleration, before the period of maximum internode-length formation..
Evidently dwarfness in maize, instanced in the examples cited, belongs to a somewhat different category than the dwarf habit of beans. KEMPTON
While recognizing the validity of the classification laid down by COOK, it is more tenable to recognize brachytic plants as dwarf plants of limited character. This article deals with brachy- tic plants but they will be referred to as dwarf plants or dwarfs.
214 L. R. WALDRON
found that inheritance of dwarfness in maize was due to a single Mendelian factor with normal height dominant. Lik.ewise, EMERSON found the same method of inheritance in bush and twining beans, and he reviews the work of different investigators who have secured similar results working with dwarf varieties of peas, sweet peas, tomatoes and maize. I n investi- gations with the two types of beans, bush and twining, TSCHERMAK
(1912) found a complicated method of inheritance. I n order to explain the results he assumed the existence of several factors and also the possible formation of unequal numbers of gametes and of zygotes.
VILMORIN (1913) discussed the inheritance of “dwarf” plants found in two varieties of wheat. These plants were about 80 percent of the normal height of the variety from which they were obtained. Seed of dwarf and normal plants was planted for a number of years. Normal plants always produced normal off spring while dwarf plants produced dwarf and normal offspring in the ratio of about 1 : ’2.35. It is not possible to gather from his paper whether a higher proportion of off spring from dwarf plants failed to come to maturity than offspring from normal plants. His failure to secure homozygous dwarf plants is ascribed by him to the failure of the zygotes to survive. I n other words, he evidently was working with lethal factors, similar to the classical case of the yellow coat color of mice described by C U ~ N O T and others. The dwarf wheats of VILMORIN differ from the dwarf maize plants of KEMPTON and others already discussed in this paper and differ also from the dwarf wheat and oats to be considered later.
MIYAZAWA (1921) crossed two varieties of barley, finding in the F,
generation one dwarf plant in a total of 96. This dwarf, like that found by VILMORTN, was evidently an intermediate heterozygote differing by one factor from the normal plant. When the young seedlings were given sufficient protection, small and quite sterile dwarfs developed, evidently homozygous. When the barley cultures were well cared for so that the maximum number of plants developed, a reasonable approximation to the 3: 1 ratio was secured.
DWARFNESS I N WHEAT I N UNEXPECTED RATIOS 215 lethal in character, although it is obvious that the dwarf maize plant has little chance to compete with the normal plant.
Cases have been found in wheat and oats which are apparently entirely comparable with those found by EMERSON and others in maize, that is, plants occur which are strictly dwarf in character and evidently homozy- gous. The first worker to report dwarf wheat plants was
FARRER
(1898), working in Australia. He gives an extended description of the plants, quoted by WARBURTON (1919). He speaks of the plants as “grass clumps,” thus indicating the abundance of stools which they develop, the plants only occasionally producing heads. He harvested grain from some of the dwarf plants, the offspring consisting of both normal and dwarf plants, while in one instance the entire offspring consisted of dwarfs. He found the plants appearing only when different varieties of common wheats were crossed, none appearing when one of the parent varieties was Triticum durum or T . turgidum. The abnormal plants nearly always appeared in the F2 generation; in one instance the F, plants were dwarf, although here one of the parents was the result of a recent hybridization and was probably heterozygous in character. From the information furnished by FARRER it is not possible to determine much about the Mendelian behavior of the dwarf plants.Plants similar to those found by FARRER were reported by RICHARDSON (1913) from Victoria where he found 28 dwarf plants in a total population of 15,800 of hybrid parentage. The dwarf plants had a height of about nine inches. Less than 50 percent formed heads and only nine percent of them produced grain.
NEETHLING (1917), by crossing two common wheats of normal height, secured only normal plants in the F, generation; in the Fz generation, in the one case where data are given, 8 dwarfs appeared in a total of 31 plants. He considered dwarfness t o be brought about by a single recessive factor. It is not explained how such a factor could have been carried in one of the two normal parents without an accompanying inhibiting factor. Aside from the single Fz result for which data are given, his figures are rather more favorable to a two-factor hypothesis, including an inhibit- ing factor, than to the one-factor hypothesis suggested.
CUTLER (1919) reported dwarf wheat plants occurring in head-rows selected from Marquis wheat. Evidently dwarf plants were found in more than one head-row and their occurrence was noted during three years, 1914 to 1916. CUTLER states that the plants of lowest stature, about nine inches tall, produced a high percentage of dwarf plants, in some cases
216 L. R. WALDRON
while intermediate plants produced dwarfs, intermediates and normals in the ratio of 1 : 2 : 1. No data are given in the article to support these statements. Dwarf plants were found in other varieties, according to CUTLER, the variety Red Fife being specifically mentioned. It is quite certain that the dwarf plants observed by CUTLER became manifest as a result of field crosses of Marquis with other varieties, as it is stated that aside from the appearance of dwarfs, variable characters were present relative to color of chaff, beardedness, shape of kernel, etc. It is reasonable to suppose that the dwarfs which appeared in other varieties likewise made themselves known as a result of field crossing.
WARBURTON (1919) found dwarf oat plants in the Victory variety which were entirely comparable to the dwarf wheat plants discussed above. I n one head-row of Victory oats grown a t Aberdeen, Idaho, 40 percent of the plants were dwarf in character. These measured not over nine inches in height. Seed saved from the dwarf plants was given to two plant breeders for growing. The complete results indicated that the dwarf character was due to a single Mendelian factor. The 3 : 1 ratio was approximated very closely. WARBURTON does not indicate that other characters besides dwarfness were concerned, and he does not suggest that the dwarfs which produced dwarf oflspring were the result of a field cross.
SAX (1921) crossed Bluestem and Amby wheats, planting 52 F1 seeds of reciprocal crosses. Apparently the entire F1 offspring was strictly dwarf, producing no fertile culms. Conditions here are entirely different from those reported in most other cases.
STANTON (1923) has recently reported two cases of dwarf oat plants appearing in the F4 and F6 generation, of two crosses. I n one instance dwarfness proved to be heterozygous in a monohybrid ratio, while in the other case one entire progeny may have been dwarf, comparable with the dwarf hybrid wheat of SAX.
ORIGINAL WORK
I n 1918 the writer made certain crosses between a variety of wheat resistant to Puccinia graminis, later named Kota (WALDRON and CLARK 1919), and certain rust-susceptible varieties. All wheats were of the com- mon type, Triticum vulgare. While dwarfs appeared in hybrid families of different varieties of the susceptible wheats, those occurring from the combination Marquis XKota were studied in greatest detail. Dwarf and normal plants are shown in figure 1.
DWARFNESS IN WHEAT I N UNEXPECTED RATIOS 217
FIGURE I.-Two plants each of dwarf and normal wheat from family 140.10. The taller dwarf is plant 152.8.
218 L. R. WALDRON
measured 95. I n 1920 the four plants produced F, offspring as shown in table 1.
TABLE 1
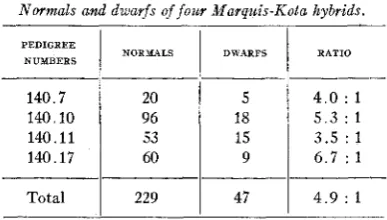
Normals and dwarfs of jour Marquis-Kota hybrids.
PEDIGREE
NUMBERS NORMALS DWARFS RATIO
140.7 140.10 140.11
20 96 53
5
18 15
4 . 0 : 1 5 . 3 : 1 3 . 5 : 1
140.17
I
60I
91
6 . 7 : 1Total
I
229I
47I
4 . 9 : 1This .ratio does not approximate a 3 : 1 ratio and doubt arises immedi- ately as to the simplicity of the dwarf factor carried in the parental form.
I n crosses between Red Fife wheat and Kota, dwarfs also appeared in the F 2 generation in 1920 as shown in table 2.
TABLE 2
Normals and dwarfs o j nine Red Fqe-Kota hybrids.
PEDIGREE NUMBERS
”
140.14 140.15 140.20 140.21 140.22 140.27 140.29 140.30 140.31
Total
”
-NORMALS
38 19 11 85 35 30 23 18 12
271
DWARFS
“
5 2 4 12 1 5 0 0 1
30
RATIO
____- 7 . 6 : l
9 . 5 : 1 2 . 8 : 1 7 . 1 : 1 3 5 . 0 : 1 6 . 0 : 1
”
1 2 . 0 : 1
9 . 0 : 1
Only with family 140.20 is there an indication that dwarfness is deter- mined by a single factor. For the remaining cases, complications are indicated except in two cases where dwarf genes may be lacking.
O$spring of normal plants of f a m i l y 140.10
The greatest amount of data was secured from family 140.10. The average height of the normal plants of the Fz generation in 1920 was 138.1
DWARFNESS I N WHEAT I N UNEXPECTED RATIOS 219 The dwarfs of 140.10 had an average height of 25.8 cm, the extremes being 9 and 43 cm. The possibility that the dwarf zygotes were less viable than the normal zygotes and thus failed to grow or failed .to produce plants living until the close of the growing season, similar to the .conditions found by
MIYAZAWA
(1921), is untenable. For the FS generation of 1921 a calculation was made of the percentage of plants coming to maturity, based upon number of seeds sown. As stated, 36 families produced no dwarfs while 42 families produced dwarfs. The percentage of dwarfs per family for the dwarf-carrying families was 18.86 percent. The families producing no dwarfs brought 63.06k
1.02 percent of the parent seed t o maturity while the families producing dwarfs brought 62.23 -t 1.06 percent of the parent seed to mature plants, or plants which were secured a t harvest. If an appreciable number of zygotes had failed to grow a t all or to grow sufficiently to be harvested, the fact should have been reflected in a difference of the above means.Family 140.10 in 1920 produced 96 normals and 18 dwarfs. This obviously approaches a 55 : 9 ratio. If JOHANNSEN’S formula for the
probable error of a Mendelian ratio, as modified by BABCOCK and CLAUSEN (1918); be applied to the ratio in question the following relation results:
Phemtyfie Plants
Obsened Calculated Probable
ratio ratio error
Normal 96 53.9 55
Dwarf 18 10.1 9
k1.405
The deviation is found to be less than the probable error. The two families, 140.10 and 140.17, taken together, approximate more closely a
55 : 9 ratio than family 140.10, but families 140.7 and 140.11 can not be brought into accord.2 Certainly the presumption would be that four F1
plants derived by crossing similar parents would possess genotypes nearly or quite identical relative to the character of dwarfness. The data from family 140.10 are extensive, and with additional available data, the char- acter of the genotype of the F, hybrid is foreshadowed.
Of the 96 normal F2 plants produced in 1920 from 140.10, 78 were planted and 78 families resulted. Of these 78 families, 36 produced no dwarfs in the FS generation in 1921 and were thus considered to be dwarf- free.3 The 42 families which carried dwarfs showed different kinds of segregation indicated in table 3.
2 Evidence will be presented later to show that the genotype of family 140.11 was perhaps of
8 It will be shown later that this conclusion was not quite true.
a nature to produce offspring a t the ratio of 55 : 9 (see table 13 and accompanying text).
220 L. R. WALDRON
Distribution o j dwarf-bearing jamilies relative to namal-to-c of family 140.10 from a Marquis
I
l
FAMILY NO. 119
45 50 58 59 61
-
63 71 84 77 93 109 103 117 ” Total-i
I NORMALS 47 35 48 42 48 42 54 43 5021 51 47 50 DWARFS 19 13 16 17 16 6 14 20 13 19
12 7 15 51 57 46 70 56 11 57 72
59 13 12
14
87 38 8
Total
I
256 58Ratio group, 13 : 3 or 4
44 54 .55 75 81 83 89 92 90 96 9 l05 115 113 116 ” -Total 56 47 49 41 55 38 53 49 37 53 47 44 73 66 62 697 “
r a t i o grot
l
”
‘P.
4 4s
64 95 58
99
45 101 40 100
67
Total 368
- 6 8 1
104 61 77””
Rafio grot
Total
1
138Ratio proa 8 9 8 8 7 h 6 4 9 8 6 7 8 12 11 ~~ 117 , 5 5 : 9 o r 6 .
arf ratios jound in the F8 generation ota cross.
RATIO
2 . 7 : 1 2.5 : 1
3.0 : 1
3.0 : 1 2 . 5 : 1
2.6 : 1 3.9 : 1
3.4 : 1 2.5 : 1
3.0 : 1 2.7 : 1
3 . 9 : 1 3.3 : 1
2.9 : 1
4.2 : 1 4.4 : 1 4.9 : 1 4 . 1 : 1 4.8 : 1
4.4 : 1 : 1
7.0 : 1
5.2 : 1 6 . 1 : 1
5.9 : 1 6.9 : 1 6.3 : 1 8.8 : 1 9 . 3 : 1 5.4 : l 6.6 : 1 7.8 : 1 6 . 3 : 1 9.1 : 1 5.5 : 1 5.6 : 1
6 . 0 : 1
-
_
_
_
~
: 1
.
12.0 : 1 18.3 : 1 13.8 : 122.3 : 1 19.3 : 1
13.3 : 1 11.3 : 1
, l 5 : l 24 I 15.3 : 1
I
-1 61.0 : 1
1
I
77.0 : 1, 6 3 : 1
DWARFNESS IN WHEAT IN UNEXPECTED RATIOS 221
Summarizing the foregoing table it is seen that evidently there are five kinds of segregation; first, the simple 3 : 1, then 13 : 3, 55 : 9, 15 : 1 and
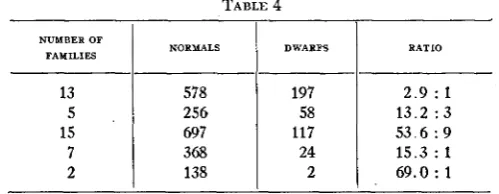
63 : 1. These ratios are not followed exactly but are very closely approxi- mated. Table 4 presents a summary of table 3.
TABLE 4 NUMBER OF
FAMILIES NORMALS DWABPS RATIO
13
6 9 . 0 : 1
2 138
2
1 5 . 3 : 1
24 368
7
5 3 . 6 : 9 117
697 15
1 3 . 2 : 3
58 256
5
2 . 9 : 1 197
578
The average number of individuals per family in the 78 families in the F3
generation was 59, but in a few of the families the individuals per family were less than half this number. As two of the families had only one dwarf each with the total individuals per family above 60, it is quite possible that certain of the families which showed no dwarfs in 1921 were really not homozygous for normals but showed all normals simply because of too few individuals. As will be seen later, this was found to be true. It is possible to reduce the five ratio groups shown in tables 3 and 4 to four groups by classifying three of the families of the second group with ratio group
3 : 1, and two of the families with ratio group 55 : 9. This does not change the ratios materially and adds to the difficulty of solving the problem.
Ojspring of dwarf plants of f a m i l y 140.10
Although 18 dwarf plants were produced in 1920, only three of them produced seed and only one plant produced seed in any quantity. The dwarf plant, given the number 152.8 (see figure l ) , measured 43 cm, pro- duced 105 seeds which were all planted, and in 1921, in the F3 generation,
76 plants resulted. An even larger percentage of dwarf plants came to maturity from seeds produced by a dwarf than from seed from normal plants. The zygotes surviving during the season were 72 percent, as
222 L. R. WALDRON
phenoty,pic dwarfs. One, or perhaps two, of the dwarfs were perhaps tall enough to have gone into the normal group, but a further test of them showed that they were not normal and produced but a few normal off- spring.
The 76 plants of the FS generation resulting in 1921 from the dwarf plant 152.8 were distributed as shown in the following tabulation: Class centers in d m . .
. .
. . . 2 . 5 3 . 5 4. 5 5 . 5 6 . 5 7 . 5 8 . 5 9 . 5 10.5 1 1 . 5Number of plants.
. . . .
. .. .
3 5 11 16 7 5 1 3 22 3The bimodality of the foregoing distribution is very striking. I n dividing the wheat plants into the two groups, normal and dwarf, the point of nine decimeters was taken. It is seen a t once that this is a natural division point and no further argument is needed to sustain it. Plants taller than nine decimeters were considered to be normal and those below were considered to be dwarf. I n the foregoing case, trials in 1922 showed that one of the plants, measuring 93 cm, produced mainly dwarf offspring and had a different genotype than the other plants measuring 9 decimeters or more. On the face of the foregoing tabulation 28 normal and 48 dwarf plants resulted from an Fz dwarf plant. Changing the position of the foregoing plant, changes this distribution to 27 and 49. Omitting this plant from consideration for the present, there were 27 plants which were probably pure for normal height. Seed from 10 of these 27 plants, ranging in height from 100 to 110 cm, was not planted in 1922, and the constitution of these was not known from the behavior of their offspring. However, seed of the remaining 17 normal plants was planted in 1922 and the result- ing offspring were all entirely normal.
Of the 49 plants which evidently were wholly dwarf or a t least hetero- zygous for dwarfness, only 38 were represented in the 1922 plantings. Of
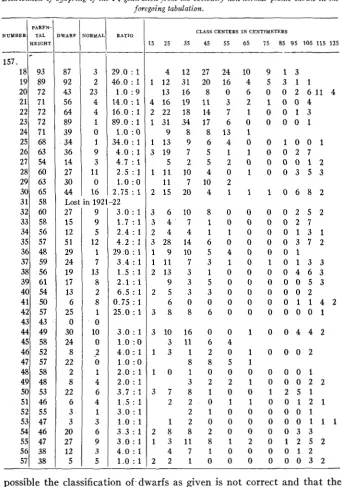
the 11 plants not represented, eight produced no seed whatever, one produced non-viable seeds, another plant produced four seeds, none of which came to maturity, and one number was lost. The 1922 offspring of the remaining 38 parent plants which were obviously not normal in height (excepting one plant) are shown distributed in table 5. I n this table the parent height is given, number of dwarf and normal plants, and the ratio of the two.
DWARFNESS IN WHEAT IN UNEXPECTED RATIOS 223
TABLE 5
Distribution of 05spring o j the F4 generation from the obviously non-normal plants shown in the
foregoing tabulation.
PARFN-
NUMBER DWARF TAL RATIO NORMAL CLASS CENTERS I N CENTIMETERS
HELGHT 15 25 35 45 55 65 1 5 85 95 105 115 125
_c"" -
c 157.
18
2 2 1 0 0 0 0 0 0 3 2
1 . O : l 5 5 38
57
4 7 1 0 0 0 0 1 2
4.0 : 1 3
12 38 56
1 3 11 8 1 2 0 1 2 5 2
3 . 0 : l 9
27 47 55
2 8 8 2 0 0 0 0 3 3
3 . 3 : l 6
20 46
54
1 2 0 0 0 0 0 0 1 1 1
1.0 : 1 3 3 47
53
2 1 0 0 0 0 0 1
3.0 : 1 1
3 55 52
2 2 0 1 1 0 0 1 2 1
1 . 5 : 1 4 6 46 51
3 7 8 1 0 0 1 2 5 1
3 . 7 : l 6
22 53 50
3 2 2 1 0 0 0 2 2
2.0 : 1 4
8 48 49
1 0 1 0 0 0 0 0 0 1
2 . 0 : l 1
2 58 48
8 8 5 1
1.0
: o
022 57 47
1 3 1 2 0 1 0 0 0 2
4 . 0 : l
2
8 52 46
3 1 1 6 4 1.0 : O
0 24 58 45
3 10 16 0 0 1 0 0 4 4 2
3 . 0 : l 10 30 49 44 0 0 43 43
3 8 8 6 0 0 0 0 0 0 1
2 5 . 0 : l 1
25 57 42
6 0 0 0 0 0 0 1 1 4 2
0.75 : 1 8
6 50 41
2 5 3 3 0 0 0 0 0 2
6 . 5 : l 2
13 54 40
9 3 5 0 0 0 0 0 5 3
2.1 : 1 8
17 61 39
2 13 3 1 0 0 0 0 4 6 3
1 . 5 : l 13
19 56 38
1 11 7 3 1 0 1 0 1 3 3
3 . 4 : l 7
24 59 37
1 9 10 5 4 0 0 0 1
2 9 . 0 : l 1
29 48 36
3 28 14 6 0 0 0 0 3 7 2
4 . 2 : l 12
51 57 35
2 4 4 1 1 0 0 0 1 3 1
2 . 4 : l 5
12 56 34
3 4 ' 7 1 0 0 0 0 2 7
1 . 7 : l 9
15 58 33
3 6 10 8 0 0 0 0 2 5 2
3 . 0 : l 9 27 60 32 in 1921-22 Lost 58 31
2 15 20 4 1 1 1 0 6 8 2
2 . 7 5 : l 16
44 65 30
11 7 10 2
1.O:O 0
30 63 29
1 l 1 10 4 0 1 0 0 3 5 3
2 . 5 : l l 1
27 60 28
5 2 5 2 0 0 0 0 1 2
4.7 : 1 3
14 54 27
3 19 7 5 1 1 0 0 2 7
4 . 0 : l 9
36 63 26
1 13 9 6 4 0 0 1 0 0 1
3 4 . 0 : l 1
34 68 25
9 8 8 1 3 1
1.0 : O 0
39 71 24
1 31 34 17 6 0 0 0 0 1
89.0 : 1 1 89
72 23
2 22 18 14 7 1 0 0 1 3
1 6 . 0 : l 4
64 72 22
4 16 19 11 3 2 1 0 0 4
14.0 : 1 4
56 71 21
13 16 8 0 6 0 0 2 6 11 4
1.0 : 9 23
43 72 20
1 12 31 20 16 4 5 3 1 1 46.0 : 1
2 92 89 19
4 12 27 24 10 9 1 3
29.0 : 1 3
87 93
possible the classification of.dwarfs as given is not correct and that the three plants a t 75 cm and 85 cm are pure for normal height, although
224 L. R. WALDRON
this is unlikely. I n a few cases there are plants apparently intermediate between dwarfs and normals, the plant centering a t 85 cm, family 157.25, being a striking example. Four of the families (numbers 24, 29,45 and 47) carry all dwarfs, no plants of normal height being present. It is possible that in one or more of these families, normal plants are absent because of too small numbers but this would hardly be true of all the four families.
TABLE 6
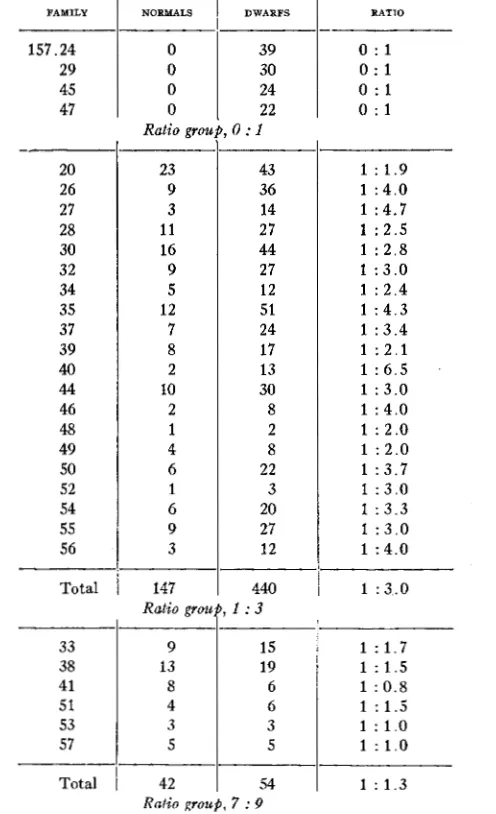
Distributions of table 5 condensed and rearranged to show approach to Mendelian ratios. FAMILY NORhCALS
157.24 0 47 0 45 0 29 0 20 26 27 28 30 32 34 35 37 39 40 44 46 48 49 50 52 54 55 56 Total Ratio grot 23 9 3 11 16 9 5 12 7 8 2 10 2 1 4 6 1 6 9 3 147
DWARFS RAT10
39 0 : l
30
0 : l 22
0 : l 24
0 : 1 -
0 : l
43 36 14 27 44 27 12 51 24 17 13 30 8 2 8 22 3 20 27 12 440
1 : 1.9 1 : 4 . 0 1 :4.7
1 : 2.5 1 : 2 . 8 1 : 3 . 0 1 : 2.4 1 : 4.3 1 : 3.4 1 : 2 . 1 1 : 6 . 5 1 : 3.0 1 : 4.0 1 : 2.0 1 : 2.0 1 : 3 . 7 1 : 3.0 1 : 3.3 1 : 3 . 0 1 : 4 . 0
1 : 3 . 0 Ratio group, 1 : 3
33 38
15
9 1 : 1.7
13 19 1 : 1.5
41 8 6 1 : 0.8
51 4 6
53
1 : 1.5
3 3
57
1 : 1 . 0
5 5 1 : 1 . 0
Total 54 42 1 : 1 . 3
DWARFNESS IN WHEAT IN UNEXPECTED RATIOS 225 TABLE 6 (continued)
FAMILY DWARFS NORMALS R A I . 0
___-
21
1 : 16.0 64
4 22
1 : 14.0
56 4
Total
1
8I
1201
1 : 15.0Ratio group, I : 15
-. I
18
1 : 25.0
25
1
42
1 : 29.0 29
1
31
1 : 34.0 34
1
25
1 : 29.0
87
3
Total 6 175 1 : 29.2
Ratio group, (1)
l
19
1 : 60.3
181
3
Total
1 : 89.0 89
1
23
1 : 46.0
92 2
Ratio group, l : 63
It
is evident from table 5 that a diversity of ratios is present in regard to dwarf and normal plants. How closely the dwarf and normal plants approximate certain well-established ratios is shown in table 6 .One notes that the ratios 1 : 3, 7 : 9 and 1 : 15 are fulfilled exactly,' only one additional dwarf being needed in the case of the 1 : 3 ratio. Families 18, 25, 36 and 4 2 present a ratio quite out of the ordinary and discussion of this will be withheld for the present. The ratio of 1 : 60.3
from families 19 and 23, is to be interpreted as a 1 : 63 ratio; the approxi- mation is satisfactorily close. Reference to table 5 shows that in family
23 there is no possible confusion between the normal plant and the dwarfs. The normal plant was over one meter and none of the dwarfs was as tall as sixty centimeters.
The dwarf plants in 1921, which produced no seed, were among the shortest. Only two plants below 40 cm produced seed. However, one cannot draw the conclusion that the shorter plants were always the more nearly homozygous for dwarfness. Family
57
of 1922, the parent plant ofwhich wzs but 38 cm tall, produced 5 0 percent normals and familv 56
with the same height of parent plant produced 25 percent normals. One of the families producing all dwarfs, family 24, came from a parent plant
71 cm tall.
226 L. R. WALDRON T w o oiher dwarf families
I n 1919, as stated previously, three dwarf plants of cross 140.10 pro- duced seed. The foregoing discussion has been limited to but one of these plants, having a height of 43 cm. I n 1921 there were secured from the two other dwarf plants five dwarfs ranging in height from 24 to 48 cm, the shortest plant producing no seed.
A
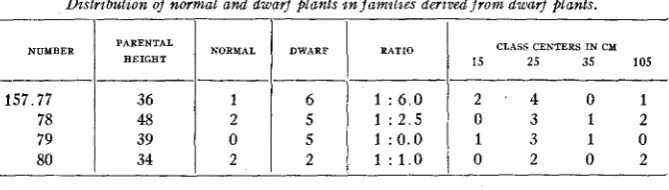
total of 48 seeds from the four remaining plants was planted, 23 plants coming to maturity in 1922.4 The distribution of the 23 offspring plants is shown in table 7.TABLE 7
Distribution of normal and dwarf plants in families derived f r o m dwarf plants.
I I l l I
NUMBER PARENTAL
HEIGHT RATIO 15 25 35 105
CLASS CENTERS I N C Y
""
157.77
0 2 0 2
1 : 1.0 2 2
34 80
1 3 1 0
1 : 0.0
5
0 39
79
0 3 1 2
1 : 2.5 5
2 48
78
2 . 4 0 1
1 : 6 . 0 6
1 36
" " " _^_
The foregoing numbers are too meagre to warrant drawing any con- clusions, but perhaps a 1 : 3 ratio is indicated, while one family may be pure for dwarf character. Family 157.80 might reveal a 7 : 9 ratio if
more plants were available. This ratio might be looked for in this con- nection as will appear later on in the discussion.
Dwarf and normal plants secured in 19ZZfrom phenotypically normal parents
I n 1922 six families were planted of series 149, numbered 64, 65, 74, 77,
78 and 98. Families 65, 74, and 78 are not shown in table 3 as there were no dwarfs in these three families in 1921. I n family 64 four dwarfs were found in a total of 59 plants, the ratio being 13.8 : 1 which brought the family into the 15 : 1 ratio group. I n 1922 the parent family 64 of 1921 produced 55 families, no dwarfs being present in 28 of these families. For
the remaining 27 families normal and dwarf plants were produced as shown in table 8.
The plant 149.64 of table 3 producing the foregoing families appeared to be simply dihybrid in character with two dominant factors responsible for normal height, for out of a total of 59 offspring there were four dwarf plants. I n the succeeding generation, shown in table 8, it is evident that conditions in the genotype governing dwarfness are considerably more
DWARFNESS IN WHEAT I N UNEXPECTED RATIOS 227
TABLE 8
Distribution, relative to normal-dwarf ratios, of dwarf-bearing families foamd in the F4 geencration
of a f a m i l y 149.154 derivedfrom a Marquis-Kota cross.
FAMILY NORMALS
156.47
-l-
156. 3 9 17 32 44 48 49 Tctal Ratio grof 59 58 53 60 71 95 96 492 Ratio grot
156. 5 6
79
65 55 86 53 98 46 99 42 68 38 7 1 37 89 26 48 24 59 22 65 10 57 8 38 7 52
DWARFS
I
RATIO25
1
3 . 2 : 1 3: l13 14 14 13 16 23 21 114
13 : 3 9 8 7 11 9 6 6 10 14 10 16 19 14 8
4 . 5 : 1 4 . 1 : 1 3.8 : 1 4 . 6 : 1 4 . 4 : 1 4 . 1 : 1 4 . 6 : 1
4 . 3 : 1
- 8.8 : 1 6 . 5 : 1 5.4 : 1 5 . 2 : 1 7.2 : 1 9 . 8 : 1 8 . 0 : 1 8 . 9 : 1 5 . 1 : 1 6.6 : 1 6.2 : 1 5.2 : 1 6 . 1 : 1 8 . 1 : 1
Total
1
974I
1471
6 . 6 : 1Ratio group, 55 : 9 156. 4
1
::
5 "11.9 : 1 14
Total
15.5 : 1 4
62
1
16710.0 : 1 5
31
11
.o
: 1Ratio group, 15 : 1
156.11
1
1:
1
4
1
103.0 : 147.0 : 1 45
I I I
Total
I
197I
31
65.3 : 1Ratio group, 63 : l
228 L. R. WALDRON
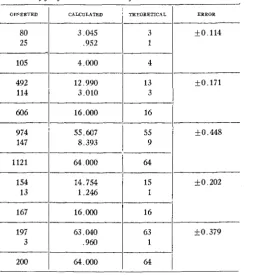
complicated. The following ratios of normals to dwarfs are apparently to be observed in the families resulting from family 149.64, namely, 3 : 1, 13 : 3, 5 5 : 9, 15 : 1 and 63 : 1. Probable errors for these ratios were determined and are shown in table 9.
TABLE 9
Closeness of jit of the observed ratios of table 8 to the calculated ratios. OWER'JED ERROR THEORETICAL CALCULATED
80 3 .045 3 f0.114
25 ,952
13 12.990
492
4 4.000
105
1
114 3.010 3
606 16.000 16
974 55.607 55 IkO.448
147 8.393 9
1121 64,000 64
-
f0.171154 14.754 15 k0.202
13
16.000 167
1 1.246
k0.379 63
63.040 197
16
3
64
64.000 200
1 ,960
I n any arrangement like that shown in table 8 some of the more pro- nounced deviates may be found t o have been wrongly placed when another generation is grown. The theoretical and observed ratios are observed to
DWARFNESS IN WHEAT IN UNEXPECTED RATIOS 229 Mendelian ratios. When the data of table 8 are compared with those of table 3, a striking similarity is observed in that the same ratios are found in both cases, although not in the same proportions. Similarity too close for an accidental occurrence is evident between the genotypes of the grand- parent producing the families derived from family 149.64, of table 8, and the F1 hybrid plant of the original cross.
Family 149.65 produced no dwarfs in 1921 in a total of 61 plants. I n 1922, 60 families were grown from the one family of 1921. There resulted 58 families free from dwarfs while two families showed dwarfs as follows:
Family Normals Dwarfs Ratio
7 1 82 1 82 : 1
114 58 1 58 : 1
70 : 1 156.
-
-
140 2
Ratio group, 63 : 1
-
A very simple explanation of the segregation shown in the offspring of family 149.65 seems to be that the plant producing in 1921 the family carrying no dwarfs was really heterozygous for three factors, ea,ch respon- sible for normal height. But if this had been the case, out of 64 plants taken at random from the 1921 family (60 were actually used) eight would show offspring ratios of 63 : 1, 1 2 would show ratios of 15 : 1, and 6 ratios of 3 : 1. Nothing of the kind occurred, for only two families had a ratio of 63 : 1, while the remainder of the families produced no dwarfs.
Family 149.74 had 57 individuals in 1921, none of which was dwarf. Twenty-five families were grown in 1922 from the parent family and again no dwarfs were produced.
Of family 149.77, 70 plants were grown in 1921 and 20 of these were dwarfs. The ratio of normals t o dwarfs was thus 2.5 : 1. I n 1922 only 20 families were grown, using normal parent plants taken a t random. Of these 20 parent plants, six produced normal offspring plants only. The 14 families carrying both normal and dwarf plants had the offspring in 1922 shown in table 10.
The ratio groups of the offspring of family 149.77 shown in table 10 are the same as those of table 8 except that the 13 : 3 group does not appear. While the families entering into the ratio group 55 : 9 fit less closely to the expected than in some of the other corresponding cases, the fit is acceptable for the two families as a unit, as the deviation with its probable error is 1.147 -t 1.213. It is not desired to enter into a full dis- cussion of these results until later, but attention is called to the four classes
230 L. R. WALDRON
of families listed in table 10. The 20 parent plants, normal in height, were taken from a family ratioed 2 . 5 : 1 of normal to dwarf plants. If the segre- gation in the parent family of normals and dwarfs was brought about by a single factor, as is apparently the case, it becomes difficult t o explain the
55 : 9, 15' : 1, and 63 : 1 resulting ratios. TABLE 10
Distribution, reladive to dwarf ratios, of dwarf-bearing families found in the F4 generation. of family
149.77 derived from a Marqzris-Kota cross.
FAMILY 156. 142 149 152 155 156 157 1.63 161 Total 148 154 Total 147 150 Tot a1 146 153 Total " NORMALS 24 50 69 36 31 38 45 17
310
-l-
Ratio group, 3 : 1 DWARFS 8 15 23 11 9 10 15 8 99 72
12 71 8
20 143 - Ratio group, 8 128 5 79 3 49
55 : 9 (?)
Ratio group 15 : l
1 86
160
1
3Ratio group 63 : l
" " " " " " RATIO
3.0 : 1 3 . 3 : 1 3.0 : 1 3 . 3 : 1 3.4 : 1 3.8 : 1 3 . 0 : 1 2 . 7 : 1 "
-3.1 : l
9.0 : 1 5.9 : 1
7 . 2 : 1
"
__P
16.3 : 1 15.8 : 1
16.0 : 1
"
-74.0 : l 43.0 : 1
53.3 : 1
"
-l
Family 149.78
Family 149.78 in 1921 carried no dwarfs; all plants were of normal stature. In 1922 seeds of 39 plants were planted and of the 39 families,
DWARFNESS IN WHEAT IN UXEXPECTED RATIOS 231 Families 149.65 and 78 are of course omitted from table 3 as they produced no dwarfs, but with this added knowledge of their genotype evidently they should have been included, presumably in the group ratio 63 : 1, making a t least four families segregating 63 : 1.
Family 149.78 and its offspring families show a condition similar to that of family 149.65. Here there is strong evidence, apparently, that three (triplicate) factors are responsible for the normal character, but there is no obvious explanation why nearly all the families carrying dwarfs should
TABLE 1 1
Distribution, relative to dwarf ratios, of dwarf-bearing families found in the F4 generation of a f a m i l y 149.78 derived f r o m a Marquis-Kola cross.
FAMILY NORMALS DWARFS RATIO
-
189 5 19.0 : 1
171 173 180 187 193 199
Total
73
106
1 96
2 97
1
1 117
2 92
2
58 1 9
Ratio group 63 : 1
73.0 : 1 48.5 : 1 96.0 : 1 53.0 : 1 46.0 : 1 117.0 : 1
64.5 : 1
be of, the ratio 63 : 1. On the basis of chance eight families out of 64
would throw this percentage of dwarfs and six families out of 39 is not greatly a t variance. B u t a t the same time there should be.12 families out of 64 producing normals to dwarfs in the 15 : 1 ratio and six families in the 3 : 1 ratio.
Family 149.98
Family 149.98 in 1921 contained 47 normal plants and 6 dwarfs; thus, in table 1 it is placed in the ratio group 5 5 : 9. I n 1922 15 families were grown from 15 normal plants, obviously taken a t random with regard t o dwarfness. Of these 15 families seven were free of dwarfs and eight families contained dwarfs as shown in table 12.
The fit in both of these groups is very close. I n the first, less than two normal plants need to be added per family to make the ratio exact and the fit in the second group is still closer. Ratios of 13 : 3 and 5 5 : 9 are not uncommon in Mendelian heredity, and their presence here adds much
232 L. R. WALDRON
weight to a certain part of our general argument. More detailed remarks upon the behavior of these families will be left until the general discussion.
Plant 140.11
I n t h e first part of the discussion of original work, mention was made of a plant, 140.11, which produced 53 normals to 15 dwarfs or a t a ratio of 3.5 : 1. The later data secured from the offspring of this plant were less ample-than those secured from plant 140.10, but are of decided interest so far as they are available.
TABLE 12
Distribt6lion, relative to normal-dwarf ratios, of dwarf-bearifag families fotbnd in the F4 generation of f a m i l y 149.98 derived f r o m a Marquis-Kola cross.
FAMILY
156.
,, 207
209 210 2 14 215
Total
202 208 212
Total
NORMALS
84 70
60
83 84
38 1
DWARFS
17 16 14 22 21
90
I
Ratio group, 13 : 328 3
84
16 88
14
200 33
Ratio group 55 : 9
RATIO
4.9 : 1 4.4 : 1 4.3 : 1 3.8 : 1 4.0 : 1
4.2 : l
9.3 : 1 6.0 : 1 5 . 5 : 1
6 . 1 : 1
From the 53 normal plants, 52 were used to produce families for the F,
generation grown in 1921. Out of the 52 resulting families 2 3 produced no dwarfs, and 29 families carried dwarfs. This number is compared with families 149.42-119secured from plant 140.10, in the following tabulation: Families.. . . ,149.42-119 149.120-172
Carrying only normals. . . .34 23 34.5
Carrying normals and dwarfs. ... .44 29 43 .5
Total. ... .78 52 78.0
Observed Calculaled
-
-
-
DWARFNESS IN WHEAT IN UNEXPECTED RATIOS 233
The 29 families carrying both normals and dwarfs are shown in table 13. TABLE 13
Distribution of dwarf-bearing families, relative to normal-dwarf ratios, found in the F3 generation of
plant 140.11 f r o m a Marquis-Kota cross.
FAMILY 149. 128 139 14 1 156 Total 129 13 1 136 155 161 Total 123 133 138 142 144, 158 159 163 167 171 Total
~-
122 126 132 135 145 147 153 162 170 172 TotalGENETICS 9: My 1924
NORMALS DWARFS RATIO
I I
52
3.7 : 1 15
56
3.4 : 1 15
51
3 . 1 : 1 18
56
2.3 : 1 23
215 71 3.0 : 1
Ratio group, 3 : l
-___-
28
4 . 8 : 1 12
57
4 . 2 : 1 12 50
4 . 1 : 1 9 37
4 . 1 : 1 11
45
4 . 0 : 1 7
217 51 4 . 3 : 1
Ratio grl 60 48 60 54 50 56 60 47 24 67 526 Ratio grc - 5 1 59 66 58 64 60 46 68 48 61
p, 13 : 3
"
8
8.0 : 1 3
7.8 : 1 6
8.6 : 1 7
8 . 0 : 1
7
8.3 : 1 6
6 . 0 : 1 9
6 . 0 : 1 10
6.0 : 1 8
7.5 : 1
13 5.2 : 1
77 6 . 8 : 1 ___-
b , 55 : 9
~ _ _ _ _ _ _ "
5
4
21.3 : 1 3
11.6 : 1 5
16.5 : 1 4
11.8 : 1 5
10.2 : 1
10.2 : 1 6
16.0 : 1 3
13.6 : 1 5
11.5 : 1 4
15.0 : 1
581
1
44 13.2 : 1234 L. R. WALDROh-
With the 29 families four ratio groups are in evidence, namely, 3 : 1, 13 : 3, 55 : 9 and 15 : 1. These correspond to the ratio groups shown in table 3, except that here ratio group 63 : 1 is not represented. The close- ness of fit of the different families to their ascribed ratios of table 13 is not quite so good as is found in table 3, although they are very good in both cases. The closeness of fit in the ratio groups of 3 : 1 and 13 : 3 is practically exact, but for the two other groups it is less exact than for the corresponding groups of table 3. Even in these two groups the probable errors calculated for the ratios in the two ratio groups are of the same order of magnitude as the deviations from the observed in comparison with the theoretical ratios. One is entirely justified in dividing up the families into the four ratio groups as indicated. The deviations which are present are not greater than are commonly found in work of this kind.
When a comparison is made in the two tables, relative t o the propor- tionate number of families entering into the two ratio groups, the results are not so satisfactory, but even here analogous comparisons can be made.
If one regards either group of families as the basis toward which to work, it is impossible to rearrange the families of the other table in different ratio groups so that the closeness of fit for each ratio group will be im- proved. If a similarity of distribution of families among the groups in the two tables is to be made uniform, then the character of the ratio groups themselves will be greatly disturbed.
It will be remembered that a fourth generation secured from planting certain of the families of table 3 developed the fact that the ratio group 63 : 1 was represented in two cases in additional families which only came
to light by growing another generation. If as large a number of families had been represented in table 13 as in table 3, or if another generation of some of the families apparently carrying all normals had been grown, a more equable chance would have been given for members of the ratio group 63 : 1 to make their appearance.
Without anticipating a discussion of the results as a whole, it is possible
to point out that the ratio group 15 : 1 of table 13 is not to be looked fof in connection with groups 13 : 3 and 55 : 9. I n short, the data from family 140.11 strongly corroborate those from family 140.10, with due respect to certain discrepancies in class groupings, presenting the same sort of a problem for solution.
Plant 140.17
DWARFNESS IN WHEAT IN UNEXPECTED RATIOS 235
suggests a 55 : 9 ratio. I n 1921 the seed of 52 normal plants out of the 60 was planted. From this lot of 52 plants, 38 families resulted carrying normal plants only, while 14 families were found to carry both normals and dwarfs. This is an entirely different condition from that obtained with the offspring of the two families 140.10 and 140.1 1. With only 14 dwarf- carrying families, the numbers are too small to place satisfactorily in different group ratios, but even here it is evident that different classes are in evidence. Without attempting to make a definite grouping, the dwarf-carrying families are shown in table 14, arranped in the order of ratio size.
TABLE 14
FANILY
149. 211 182 213 207 180 192 185 216 193 173 2 19 177 194 186
NORNALS
55 50 54 64 59 73 55 61 71 48 62 33 63 66
DWARFS
12 10 8 9 8 8 6 6 6 4 5 2 3 3
RATIO "___-
4 . 6 : l 5.0 : 1 6.8 : 1 7.1 : 1 7 . 4 : 1 9 . 1 : 1 9.2 : 1 10.2 : 1 11.8 : 1 12.0 : 1 12.4 : 1 16.5 : 1 21.0 : 1 22.0 : 1
Evidently seven families of this table belong to the ratio group 15 : 1, and possibly two others, 149.185 and 149.192.
Results from Red Fife
x
Kota crossesTwo families, 140.15 and 140.20, from a cross, Red FifeXKota, carried normals and dwarfs in 1920 a t the rate of 19 normals to 2 dwarfs and 11 normals to 4 dwarfs, respectively, as shown in table 2.
For our purpose these two families may be considered together. I n 1921 a total of 30 families were grown from the two parent families num- bered 140.15.and 140.20. Out of the 30 families, eight produced both normal and dwarf plants, while the remaining families produced only normal plants. The ratios obtaining in the eight families carrying both normals and dwarfs are shown in table 15.
236 L. R. WALDRON
While the families carrying dwarfs are too few to be classified, they have a value in indicating a diversity of ratios.
This fact also is indicated in the offspring of a cross, 140.1, between the varieties Kota and Red Bobs, made in 1918. The variety Red Bobs, selected in Canada by Doctor SEAGER WHEELER, resulted from a field cross between the Australian variety Bobs and some other variety.
TABLE 15
FAMILY
149. 233 250 238 247 249 240 232 251
NORMALS
43 39 43 55 44 42 55 37
DWARFS RATIO
4 . 8 : 1 7.0 : 1 7 . 2 : 1 7 . 9 : 1 8.8 : 1 10.5 : 1 l1 .o : 1 12.3 : 1
I n 1920 54 plants of the F, generation were produced from the F, plant. Twelve of these 54 plants were dwarfs ranging in height from 22 cm to 35 cm. The normal plants were a t least one meter high, and most of them considerably taller. The ratio of normals to dwarfs was 4.5 : 1.
I n 1921 41 of the 42 F3 families were grown, of which there were eight which carried both normal and dwarf plants only. Ratios of these eight families are shown in table 16, graded according to size of ratios.
TABLE 16
FAMILY
149. 10 12 5 23 11 14 7 19
NORMALS
49 68 53 55 59 31 64 64
DWARFS RATIO
5.4 : 1 8.5 : 1 10.6 : 1 13.8 : 1 14.8 : 1 15.5 : 1 16.0 : 1 16.0 : 1
DWARFNESS IN WHEAT IN UNEXPECTED RATIOS 237
have appeared instead of the two out of nine that did appear.
No
seed from dwarf plants was planted, so the history of these is lost. Seven out of 15 of the normal plants should have produced families carrying only normal offspring. As a matter of fact, 33 families out of 41 behaved in this manner, which is a much higher percentage than is expected. Of the families which carried both dwarfs and normals, one-half should show the ratio of 3 : 1, and the other half should produce normals and dwarfs in the ratio of 15 : 1. The actual results evidently do not accord a t all well with the two-factor hypothesis suggested by the tabulation.Data secured from the offspring of plants 140.1, 15, 17 and 20 are not sufficient to warrant any attempt at explanation of the facts. The value these data have is to show the complicated nature of the problem and that conditions have arisen which apparently are not amenable to ordinary Mendelian interpretation.
GENERAL DISCUSSION
The families derived from family 140.10 are shown distributed in table 17 with reference to ratio classes. Less ample results from another cross of the same parentage, family 140.11, were similar to those secured from family 140.10. Other results were secured from crosses of other parentage with data too scanty to have a positive bearing.
The ratios shown in table 1 7 (with the exception of the aberrant and unexplained ratio of 1 : 29) are all of frequent occurrence in Mendelian in- vestigations. Moreover, the approximation of the observed to the calcu- lated results are, in general, very close. While these facts are outstanding,
it is nevertheless true that it has not been found possible to postulate a genotypic formula for the F1 individual which will explain all of the resulting ratios. Any simple hypothesis should be able to accomplish this. The conclusion seems inevitable, then, that the results before us are not amenable to any simple explanation.
The presence of each of the two ratios, 55 : 9 and 63 : 1, according to ordinary Mendelian reasoning, affords ample justification for a three-factor hypothesis. The fact that both ratios are present contrary to any one conventional hypothesis does not lessen a t all the probability that three factors are present having to do with normal and dwarf heights. On the contrary, the presence of both ratios acts cumulatively in this respect.
It will be worth while to discuss briefly the hypotheses suggested by the data. First, it may be assumed that three factors were present in the F1
genotype, each responsible for normal height. The progenies in the
Fz generation should have consisted of normals and dwarfs in a
238 L. R . WALDRON TABLE 17
Distribution of families derived from family 140.10, carrying normal and dwarf plants, with respect
to various ratio classes. T h e F1 indivr;dzlal (133.9.1) a'as of normal height. I n each ratio normal plants are placed jirst.
I
PARENTAL ORIGIN __ 1 : o
F P
140.10. . .
F3
149.42-119and 152.8.. .
P = 140.10 of 55 : 9 class 36
F4
156.1-55.. . . P=149.64 of 15 : 1 class
28
156.56-115. . . 58 P=149.65 of 1 : Oclass.
156.142-161 . . . 6 P=149.77 of 3 : 1 class
156.162-200 . . . 32 P=149.78of 1:Oclass
156.201-215.. . . P = 149.98 of 55 : 9 class
7
157.1-57.. . . P = 152.8 of 7 : 9 class
17 3 : 1
-
13
1
0
8
0
0
0
RATIO CLASSES
. 3 : 3 5 9 1 5 .
-1-
l(96 : 18)15
14
0
2
0
3
0 7
3
0
2
1
0
0
1 6
"
3 : l
"
2
2
2
2
6
0
0
3 ;
"
1
~ l : 15
-
"
(27 :49) 0
6
- 2
-
-
: 63
"
0
2
63 : 1 ratio instead of the 96 : 18 which did result. The theoretical dis- tribution of families among the ratio classes, secured from planting a ran- dom sample of normal Fz plants, in comparison with observed results is shown as follows:
Ratio classes.. . . 1 : 0 3 : l 1 3 : 3 5 5 : 9 1 5 : l 63 : 1
Theoretical.. . . 46 7 0 0 15 l0
Observed.. . . 36 13 5 15 7 2
DWARFNESS IN WHEAT IN UNEXPECTED RATIOS 239 among the offspring of plant 152.8 can not be explained at all by the duplicate-factor hypothesis without assuming a complete “reversal of dominance.”
Another hypothesis suggests itself. One may assume a factor N , responsible for normal height, dominant over other factors. Also there is a factor for dwarfness, U , which makes itself evident only in the presence of an activating factor,
A .
A little consideration will show that when anF1
individual is heterozygous for the three factors, the Fz, F3, and F4 genera-
tions will result as shown in figure 2. F1
XnAaDd all normal
Fz Fa Fa
55 totaI normals
37 breed normal 2 produce 3N : ID
8 produce 13N : 3 0 Of the 13 normals
7 breed normal 2 produce 3iV : 1D 4 produce 13N : 3 0
2 produce 1.47 : 3 0
1 brceds dwarf Of the 3 dwarfs
8 produce 55 N : 9D 1 breeds dwarf. 4 produce 1N : 3D 4 produce 7 N : 9D 9 total dwarfs
Of the 7 normals
Of the 9 dwarfs All breed normal
1 breeds dwarf 4 produce 11%’ : 3 0 4 produce 7 N : 9D
FIGURE Z.-Outline showing expected normal-and-dwarf composition of the offspring for three generations following an F1 normal individual heterozygous in three factors according to the suggested hypothesis.
Reference to figure 2 shows the ratios 1 : 0,3 : 1,13 : 3 , 5 5 : 9, 1 : 3 , i ’ : 9, and 0 : 1 of normals to dwarfs to result logically from such a genotype. All of these ratios were found in various’families, as is seen by reference to table 17, but the theory does not account for the ratios 15 : I , 63 : 1 , l : 15, and 1 : 63. The second theory accounts for a larger number of ratios than the first theory but this helps but little when one recognizes that there are certain outstanding facts which remain unaccounted for.
Assuming the second theory, one striking feature is the great excess of families carrying both normal and dwarf plants with the corresponding
240 L. R. WALDRON
deficiency of families carrying normal plants only. I n a total of 169 families presumed to carry only normal plants there were actually only 117 such families, a deficiency of over 30 percent.
If
one assumes the second of the above theories as corresponding more nearly to the facts, it is evident that it must undergo some modification to meet the various demands. The necessary modification of the assumed genotype to produce the unexpected ratios of 15 : 1 and 63 : 1 is of a rather profound nature. As the deficient families are those expected to produce only normal offspring it is evident that it is in these genotypes that one must look for modifications. Assuming this theory to be the true one for the time being, any of the numerous normal-breeding genotypes may be taken for illustrative purposes.A
zygote of the formula NNAaDd, when self-fertilized, would be expected to produce only normal plants. Iffamilies are to be produced from this genotype of the ratio of 63 : 1, one of the dominant factors for normal height would have to be modified to become a recessive factor, while the two other dominant factors, for dwarfness and for activation of dwarfness, would have to be modified so
that they became responsible for normal height.
It would be a matter of considerable difficulty to prove that the fore- going hypothesis, with its attendant conditions, is correct. I n the first place, assuming the theory outlined, there would be 19 different genotypes constituting the normal plants in the F3 generation, while the dwarf plants would be found to be of four genotypes. This being true, one would be able to pick out by progeny results only a very limited number of known genotypes to be used in genetical analysis. One of these would be NnAaDd while another would be N n A A D D . If individuals carrying these two genotypes were crossed, 14 different genotypes would be expected among a sample of 16 offspring individuals. As only one F, individual results from each hybridization, the difficulties of the problem become sufficiently obvious.
DWARFNESS IN WHEAT IN UNEXPECTED RATIOS 241 Because of the uniqueness of the distributions of normals and dwarfs resulting in ratios inexplicable by any one hypothesis, and because of the irregular distribution of families producing the ratio, the testing of the sug- gested three-factor-modification hypothesis is of much importance in spite of the obvious difficulties. This work is being carried forward a t the present time.
If
the work is carried out successfully,one should be able to demonstrate the probable composition of certain of the genotypes. Modi- fication of these in a manner t o produce the unexpected ratios as previously indicated could hardly be demonstrated directly, but if modified ratios con- tinued to appear the corollary would be that they arose by reason of the postulated factor modification.Assuming the genetic composition of the Ft generation to be as indicated in figure 2, it should not be difficult to isolate individuals with the formula
N N A A D D derived from individuals throwing 3 normals to 1 dwarf, of
the formula N n A A D D . If such an individual be crossed to a sample of individuals derived from a plant producing a 7 : 9-ratio there should result in the F2 generation families producing normals and dwarfs in the ratios and in the proportions indicated in table 18.
TABLE 18
Calculated distribution of ratios in F2 families resulting from crossing the tester N N A A D D with
individuals of the indicated genotypes.
l
DWARFS NORMALSnnAADD
z22z
nnAaDd nnuaDd nnAAddnndadd
I
n w D D1
nmaddI l I 1 I I
3 : l
N N A A D D
1
3 : l.
I
$ 3 : l1
: 1 3 : 31
$ 1 3 : 3I
1 3 : 3I
5 5 : 9(Tester) 1 3 : 3
t
5 5 : 9 4 5 5 : 9Of the genotypes to be tested shown in table 18, only nnAADD and
nnAaDd would be known directly by the progeny ratios secured through
self-fertilization.
Assuming the hypothesis suggested, one sees that if the gametes of the two normal individuals, nnAAdd and nnaaDD are brought together in hybridization, the entire