HIGHLIGHTED ARTICLE
| INVESTIGATION
When Is Selection Effective?
Simon Gravel1
Department of Human Genetics, McGill University, and Genome Quebec Innovation Centre, Montreal, Québec, Canada, H3A 1A4 ORCID ID: 0000-0002-9183-964X (S.G.)
ABSTRACTDeleterious alleles can reach high frequency in small populations because of randomfluctuations in allele frequency. This may
lead, over time, to reduced average fitness. In this sense, selection is more “effective” in larger populations. Recent studies have
considered whether the different demographic histories across human populations have resulted in differences in the number,
distribu-tion, and severity of deleterious variants, leading to an animated debate. This articlefirst seeks to clarify some terms of the debate by
identifying differences in definitions and assumptions used in recent studies. We argue that variants of Morton, Crow, and Muller’s“total
mutational damage”provide the soundest and most practical basis for such comparisons. Using simulations, analytical calculations, and
1000 Genomes Project data, we provide an intuitive and quantitative explanation for the observed similarity in genetic load across populations. We show that recent demography has likely modulated the effect of selection and still affects it, but the net result of the
accumulated differences is small. Direct observation of differential efficacy of selection for specific allele classes is nevertheless possible
with contemporary data sets. By contrast, identifying average genome-wide differences in the efficacy of selection across populations will
require many modeling assumptions and is unlikely to provide much biological insight about human populations.
KEYWORDSgenetic drift; genetic load; human genetics; purging; selection
O
NE of the best-known predictions of population ge-netics is that smaller populations harbor less diversity at any one time but accumulate a higher number of deleterious variants over time (Kimuraet al.1963). Considerable subsequent theoretical effort has been devoted to the study offitness differ-ences at equilibrium in populations of different sizes (e.g., Glémin 2003) and in subdivided populations (e.g., Whitlock 2002; Roze and Rousset 2003). The reduction in diversity has been observed in human populations that have undergone strong population bottlenecks. For example, heterozygosity decreased in popula-tions that left Africa and further decreased with successive foun-der events (Tishkoffet al.1996; Ramachandranet al.2005; 1000 Genomes Project Consortium 2012; Casalset al.2013). The effect of demography on the accumulation of deleterious variation has been more elusive in both humans and nonhuman species. In conservation genetics, where fitness can be measured directly and effective population sizes are small, a modest correlationbetween population size and fitness was observed (Reed and Frankham 2003). In humans, thefirst estimates of thefitness cost of deleterious mutations were obtained through the analysis of census data (Crow 1958), but recent studies have focused on bioinformatic prediction using genomic data (Davydov et al. 2010; Adzhubeiet al.2013). Lohmuelleret al.(2008) found that sites that were variable among Europeans were more likely to be deleterious than sites that were variable among African Ameri-cans and attributed thefinding to a reduced efficacy of selection in Europeans because of the out-of-Africa (OOA) bottleneck. However, recent studies (Do et al.2014; Simonset al. 2014) suggest that there has not been enough time for substantial dif-ferences infitness to accumulate in these populations, at least under an additive model of dominance. By contrast Peischlet al. (2013) and, more recently, Henn et al. (2016) have claimed significant differences among populations under range expansion models, and Fuet al.(2014) claim a slight excess in the number of deleterious alleles in European Americans compared to African Americans. These apparent contradictions have sparked a heated debate as to whether the efficacy of selection has indeed been different across human populations (Fuet al.2014; Lohmueller 2014). Part of the apparent discrepancy stems for disagreement about how we should measure the effect of selection.
Copyright © 2016 by the Genetics Society of America doi: 10.1534/genetics.115.184630
Manuscript received November 9, 2015; accepted for publication March 3, 2016; published Early Online March 21, 2016.
Supplemental material is available online atwww.genetics.org/lookup/suppl/doi:10. 1534/genetics.115.184630/-/DC1.
What does it mean for selection to be“effective”? Some genetic variants increase the expected number of offspring by carriers. As a result, these variants tend to increase in fre-quency in the population. This correlation between the fi t-ness of a variant and its fate in the population—i.e.,natural selection—holds independent of the biology and history of the population. However, the rate at which deleterious al-leles are removed from a population depends on mutation, dominance, linkage, and demography and can vary across populations. Multiple metrics have been proposed to quan-tify the action of selection in human populations and verify the classical population genetics predictions, leading to ap-parent discrepancies between studies.
In this article, we first review different metrics used in recent empirical work to quantify the action of selection in human populations. We show that many commonly used metrics implicitly rely on“steady state”or“equilibrium” as-sumptions, wherein genetic diversity within populations is independent of time. This condition is not met in human populations. We discuss two measures of the efficacy of se-lection that are appropriate for the study of human popula-tions and other out-of-equilibrium populapopula-tions.
We then seek to provide an intuitive but quantitative understanding of the effect of mutation, selection, and drift on the efficacy of selection in out-of-equilibrium popula-tions. This is done via a combination of extensive simulation and analytical work describing differentiation between pop-ulations after a split from a common ancestor. Using this information, we discuss how the classical predictions con-cerning the effect of demography on selection could be verified in empirical data from human populations.
Methods
Measuring selection in out-of-equilibrium populations
We consider large panmictic populations whose size NðtÞ may change over time and whose reproduction follows the Wright-Fisher model (Ewens 2012). Given alleles aand A, we assume that genotype aa has fitness 1, aA has fitness 1þsihi, andAAhasfitness 1þsi. We suppose thatAis the least favorable allele (si,0) and that 0#hi#1. In a random-mating population, an allele Aat frequency xi adds an average ofdwi¼si½2hixiþ ð122hiÞx2
ito individualfitness compared to the optimal genotype. We compute the expected fitness over multiple loci as w¼Qið1þdwiÞ ’1þ
P idwi under the assumption that the individual selection coeffi -cients si are small. Finally, we define the genetic load L¼12w as the total relative fitness reduction compared to the optimal genotypewmax¼1. This yields
L¼ 2X
i si
h
2hixiþ ð122hiÞx2i
i
To study the effect of selection over short time spans and in out-of-equilibrium populations, we want to define instantaneous
measures of the effect of selection on the genetic load and the frequency of deleterious alleles. In this article, therate of adaptationrefers to the instantaneous rate offitness increase (or load decrease) in a population. It has contributions from selection, mutation, and drift. The contribution of selection has been the object of considerable theoretical attention: it is the object of the fitness increase theorem (FIT) (see, e.g., Ewens 2012). We will refer to the contribution of selection to the rate of adaptation as theFIT efficacy of selection.
We also wish to study the effect of selection on the fre-quencyof deleterious alleles. There are multiple ways to com-bine frequencies across loci to obtain a single, genome-wide metric: any linear functionLlin¼Pirixiof the allele frequen-cies, with ri.0 a weight assigned to locus i, provides an equally acceptable metric. A natural option, which weights alleles according to their selection coefficient, is Morton, Crow, and Muller’stotal mutational damage(Morton et al. 1956), which is equivalent to the additive genetic loadthat would be observed if all dominance coefficients were replaced by 1/2,i.e.,Ladd¼ 2Pisixi. Mutation and selection systematically affectLlin, but genetic drift does not. We define theMorton efficacy of selectionas the contribution of selection to @Llin=@t. In simulations, where all alleles have equalfi t-ness, we useri¼ 2s. Another common choice, in empirical studies, is to setri¼1 for all sites annotated as deleterious by a prediction algorithm and zero otherwise (Doet al.2014; Fu et al.2014; Simonset al.2014). Because different empirical studies use differentri, direct comparisons of the results can be challenging.
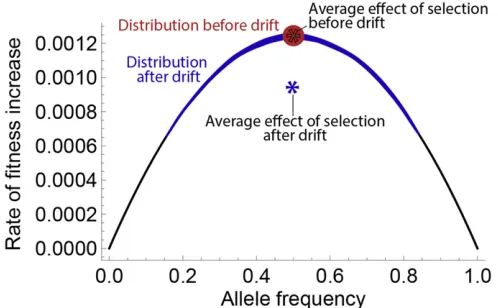
Because Morton and FIT efficacies are instantaneous measures of the effect of selection, they can be integrated over time to measure the effect of selection over arbitrary periods. Their integrals over long periods are directly related to classical steady-state metrics such as the rate offixation of deleterious alleles and the average genetic load in a population. To understand how genetic drift affects the FIT and Morton efficacies of selection, consider an allele with parental fre-quency x, selection coefficient jsj 1; and no dominance (h¼0:5). In the descending population, this allele is drawn with probabilityx9’xþsxð12xÞ=2. Figure 1 shows the resulting distribution in offspring allele frequency forx¼0:5, s¼ 20:6, and 2N¼100; 500; and N. The average fre-quencyx9is independent ofN; hence, the expected FIT and Morton efficacies are equal in all populations. Genetic drift does not instantaneously change the effect of selection.
of drift and its impact on selection can be ignored in steady-state populations but not in out-of-equilibrium populations. For this reason, measures of the effect of selection that have been developed for populations of constant size can be mis-leading or biased when applied to populations that are out of equilibrium.
Other measures of the effect of selection
The rate at which deleterious mutations are eradicated from a population, for example, is an intuitive metric for the effect of selection that has been recently applied to out-of-equilibrium populations (Gazave et al.2013). Over long time scales or in the steady state, this rate of eradication is indeed equiv-alent to Morton’s efficacy of selection. However, in out-of-equilibrium populations, the rate of eradication is a biased measure of the effect of selection. In Figure 1, the smaller population has a higher rate of eradication of deleterious alleles, but this reflects the action of drift rather than the effect of selection. This effect of drift on the rate of eradi-cation of deleterious alleles is short-lived on phylogenetic time scales, but it can be the dominant effect for time scales relevant to human populations.
Classical work on the efficacy of selection in steady-state populations has emphasized the role of the combined param-eterNsin the dynamics of deleterious alleles. The importance of this combined parameter has led some authors to argue that it should be used as a metric for the efficacy of selection even outside the steady state (Do et al. 2014; Lohmueller 2014). This is problematic for practical and fundamental rea-sons. On the practical side, the parameterNðtÞsis a function of time and does not allow for comparison between popula-tions overfinite times:NðtÞsis not a rate, and its time integral is meaningless. At a more fundamental level, an instanta-neous difference between two populations in the product NðtÞs simply indicates a difference in effective population sizes. The interesting biological question is not whether the
population sizes are different but whether these differences lead to differential action of selection by the process illus-trated in Figure 2.
More generally, it is commonly proposed that the effect of selection should be measured relative to the effect of drift (Lohmueller 2014) because the classical parameter Nsis a ratio between a selection termsand a drift term 1=N. Such a relative measure is not necessary: Morton and FIT efficacies are absolute measures of the effect of selection, and they do capture the classical interaction between selection and genetic drift. In populations of constant size, these efficacies do depend on the relative magnitude of selection and drift coef-ficientsthrough the classical parameterNs. In out-of equilib-rium populations, however, they depend on a more complex function ofsandNðtÞ:In other words, the classical param-eterNsdoes not measure the effect of selectionas compared to the effect of drift but rather the effect of selection as modulated bypast genetic drift.
Finally, even though most classical work has focused on the effect of selection onfitness or allele frequency, Hennet al. (2016) recently proposed to measure the effect of selection on diversity, defining a “reduction in heterozygosity”(RH) statistic that compares the heterozygosity of selected and neutral sites. We show in Section S2 of Supplemental Mate-rial,File S1thatRHis robust to the effect of genetic drift, but it can be biased by recent mutations.
Asymptotic Results
To study the effect of selection after a population split, we calculate the moments of the expected allele frequency dis-tribution fðx;tÞ under the diffusion approximation. In this formulation,fðx;tÞdxrepresents the expected number of al-leles with frequency between x and xþdx at time t. In a
Figure 2 Effect of drift on the rate of adaptation forh¼0:5. We con-sider two populations with initial allele frequency 0.5 and selection co-efficients¼ 20:1. The red population does not undergo drift, and the blue population undergoes one generation of neutral drift, leading to increased variance in allele frequency. The reduced diversity at each locus leads to a lower averagerateoffitness increase per generation (blue star). Because the rate offitness increase is a concave function of allele fre-quency, drift always reduces the future effect of selection whenh¼0:5. Figure 1 Frequency distribution of deleterious alleles with initial
randomly mating population of sizeN¼NðtÞ 1 and con-stantssandh, the evolution offðx;tÞapproximately follows the diffusion equation (Ewens 2012)
@fðx;tÞ
@t ’
1 4N
@2
@x2xð12xÞfðx;tÞ 2s @
@x½hþ ð122hÞxxð12xÞfðx;tÞ þ2Nud
x2 1
2N
(1)
whereuis the total mutation rate. Thefirst term describes the effect of drift; the second term, the effect of selection; and the third term, the influx of new mutations: d is Dirac’s delta distribution. From this equation, we can easily calculate evo-lution equations for moments of the expected allele fre-quency distribution mk¼ hxki. For example, the rate of change in allele frequenciesm_1[dm1=dtis driven by muta-tion and selecmuta-tion,i.e.,
_
m1¼uþ sG1;h
4 (2)
where Gi;h¼4ðmi2miþ1Þhþ4ð122hÞðmiþ12miþ2Þ is a function of the diversity in the population that generalizes the heterozygosityp1¼G1;1=2[see the Appendix for detailed calculations and Evanset al.(2007) and Balicket al.(2015) for other applications of the moment approach]. We can de-fine the contributions of selection and mutation to changes in allele frequency asm_1s[sG1;h=4 andm_1u[u. Morton’s effi -cacy of selection at a locus is simplysm_1s. Whereas the effect of mutation is constant and independent of population size, Morton’s efficacy depends on the history of the population throughG1;h:
sm_1s¼ s2G1;h
4 (3)
Similarly, changes in the expectedfitnessWcan be decom-posed into contributions from mutation, drift, and selection:
_
W¼W_uþW_NþW_s
¼s 2huþð122hÞp1 4N þs
hG1;hþ ð122hÞG2;h
2
(4)
Favorable mutations increase fitness, drift increases fitness when fitness of the heterozygote is below the mean of the homozygotes, and selection always increases averagefitness.
The FIT efficacyWs_ is therefore _
Ws¼s2
hG1;hþ ð122hÞG2;h
2 (5)
The right-hand side is the additive variance in fitness, and Equation 5 is an expression of the FIT [see,e.g., equations 1.9 and 1.42 in Ewens (2012)]. Importantly, the FIT efficacy describes only one of three genetic contributions to the rate of adaptation. Interpreting changes infitness in terms of FIT
efficacy requires picking apart the effects of drift and mutation from those of selection. In addition to these genetic effects, changes in the environment can directly affectfitness, intro-ducing a further confounder (Mustonen and Lassig 2010).
Now consider an ancestral population that splits into two isolated randomly mating populations with initial sizes NA andNBat timet¼0. The populations may experience con-tinuous population size fluctuations. If we expand the mo-mentsmkof the allele frequency distribution in Taylor series aroundt¼0;we can easily solve the diffusion equation to study the differentiation between the two populations right after the bottleneck. Here we provide an overview of the main results. Detailed derivations are provided in the Appendix.
The difference in fitness between the two popula-tionsDWðtÞ ¼WAðtÞ2WBðtÞgrows linearly in time under dominance
DWðtÞ ¼2sð122hÞtp1;o 4
1 NB2
1 NA
þO t2 (6)
wheretis measured in generations,p1;ois the expected het-erozygosity in the source population, and Oðt2Þ represents terms at least quadratic int. This rapid, linear differentiation is driven by drift coupled with dominance. The smaller pop-ulation has higherfitness whenh.0:5 fors,0: drift hides dominant, deleterious alleles from the action of selection.
If the source population is large and h.0, we have
p1;o’2m1;o’22u=hs (Crow and Kimura 2009), and the rate offitness differentiation is independent ofs. This gener-alizes Haldane’s observation that load is insensitive to the selection coefficient in large populations (Haldane 1937). By contrast to the constant-size population case, however, the observation does not hold when h¼0. The initial re-sponse to the bottleneck is independent of fitness for 0,h,0:5 (Figure S2andFigure S3) but not forh¼0 or h¼0:5 (Figure 3 andFigure S1).
The effect of selection onfitness differencesDWsðtÞgrows only quadratically
DWsðtÞ ¼ s2t2P
h 16
1 NB2
1 NA
þO t3 (7)
wherePhis a measure of diversity that reduces top1;owhen h¼0:5 (see Appendix).
This slower response is the mathematical consequence of the intuition provided by Figure 1 and Figure 2: right after the split, thefitnesses are identical, and the efficacy of selection is the same in both populations. It takes time for drift to in-crease the variance in allele frequency and cause differ-ences in the efficacy of selection, accounting for a factor t½ð1=NBÞ2ð1=NAÞ. It then takes time for differences in the efficacy of selection to accumulate and produce differences in fitness, accounting for an additional factorst.
DWasymptoticðtÞ ¼
2sð122hÞtp1;o
4 þ
s2t2Ph 16
3
1 NB2
1 NA
(8)
This expression describes the leading differentiation infi t-ness in all the simulations that follow. It is straightforward to
refine this asymptotic result by computing higher-order cor-rections. However, the number of terms in the expansion in-creases rapidly. Some of these terms are of particular interest, such as the contribution of new mutations. Since the direct effect of mutation on load is independent of demography (Equation 4), we must wait for mutations to accumulate before load differen-tiation can begin. This leads to an additional factor ofut com-pared to the case of standing variation. The contribution of drift acting on new recessive mutations is therefore quadratic:
DWnew¼2
sut2ð122hÞ 4
1 NB2
1 NA
þO t3 (9)
The effect of selection on new mutations is only cubic in time: we must wait for mutations to appear (contributing a factor of ut), then wait for drift to cause differences on the frequency distribution of the new mutations {contributing a factor of t½ð1=NBÞ2ð1=NAÞ}, and finally wait for selection to act on these frequency distribution differences (contributing a fac-tor ofst). The leading contribution of selection is therefore
DWs;new¼
s2t3uhð5h22Þ 6
1 NB2
1 NA
þO t4
Finally, since drift alone does not produce differences in average allele frequencies, the rate of differentiation in del-eterious allele frequencies is always quadratic in time,i.e.,
Dm1sðtÞ ¼ st2
8
ð3h21Þp1;oþ3ð122hÞp2;o
3
1 NB2
1 NA
þO t3 (10)
Simulations
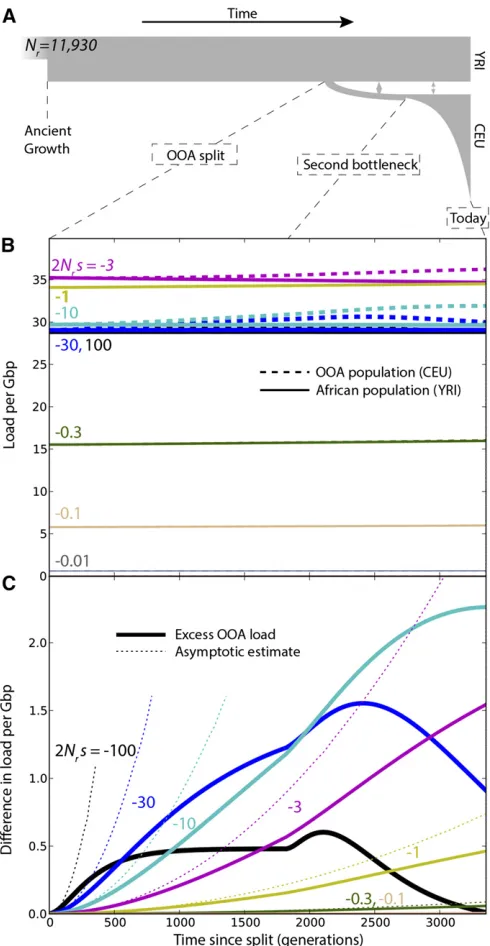
We simulated the evolution offðx;tÞusing dadi (Gutenkunst et al.2009) and the OOA demographic model illustrated in Figure 3A. This model begins with an ancestral population of sizeNr¼11;930 with frequency distribution following the quasi-stationary distribution of Kimura (1964) and features population splits and size changes that were inferred from synonymous polymorphism from the 1000 Genomes Project data set (Gravel et al.2011). We estimated the probability
fnði;tÞthat a variant is at frequencyiin afinite sample of size n¼100 for each population given a mutation rate of
m¼1:4431028 bp21generation21(Gravelet al.2013) in an infinite genome. We used thefinite-sample predictions to estimate the expected genetic load and the contributions of drift, selection, and mutation. Finally, to ensure that the re-sults were not model dependent, we repeated each simula-tion using a different demographic model described in Do et al. (2014), featuring a single deeper but shorter OOA bottleneck.
We simulated all combinations of selection coefficients 2Nrs2 f0;20:01;20:1;20:3;21;23;210;230;2100g
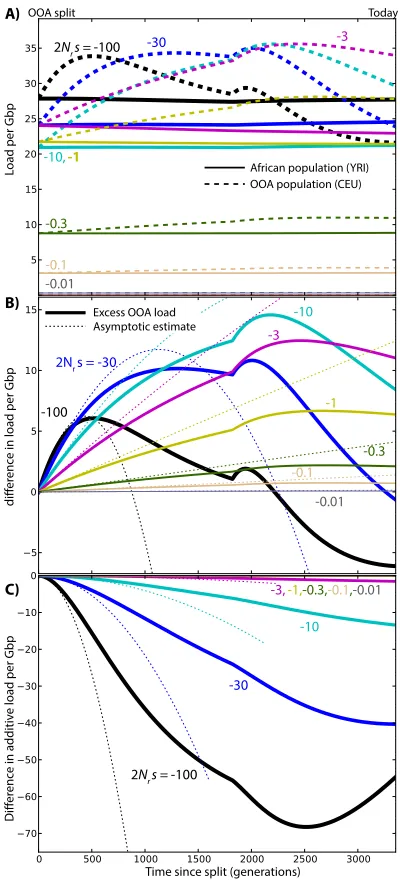
Figure 3 (A) Changes in load after the OOA split model as a function of s, given ancestral population size Nr¼11;930 and no dominance
and dominance coefficients h2 f0;0:05;0:2;0:3;0:5;1g. The contributions of selection and drift were obtained using Equation 4. To emphasize the long-term effects of the OOA bottleneck even after drift is suppressed, simulations also were carried to future times assuming large population sizes (N¼20Nr) and no migrations (Figure S6). In all cases, Equa-tions 8–10 capture the initial increase in load (Figure 3, Fig-ure S1,Figure S2, andFigure S7).
Genic selection: h = 1/2
Simulated differences in load are modest and limited to intermediate-effect variants (0:3,j2Nrsj,30, 2:531025, jsj,0:0025). Assuming the distribution of fitness effects inferred from European-American data by Boyko et al. (2008), the excess load in the OOA population is 0.49 per Gbp of amino-acid-changing variants, in addition to a total accumulated load of 24 Gbp21 in the African population (this accumulated load does not include variation that was fixed at the time of the split). If we consider the 24 Mb of exome covered by the 1000 Genomes Project and assume that 70% of mutations are coding in that region (Hwang and Green 2004), the model predicts a nonsynonymous load difference of 0.008. The total estimated nonsynonymous load, excluding mutationsfixed in the ancestral state, is 0.4 in the African-American population. In this model, the re-duced efficacy of selection caused by the OOA bottleneck leads to a relative increase in nonrecessive load of 2%. Since we did not consider fixed ancestral deleterious al-leles in the total load, thisfigure is an overestimate of the relative increase in load due to the bottleneck. The relative increase reaches a maximum of 8% for mutations with
220,2Nrs, 210. The results are similar if we use the dis-tribution of fitness effects inferred from African-American data (Boykoet al.2008).
Using the simple bottleneck demographic model of Do et al.(2014), wefind very similar load (24 Gbp21) and load differences across populations (2% of the total load).
Partial and complete dominance
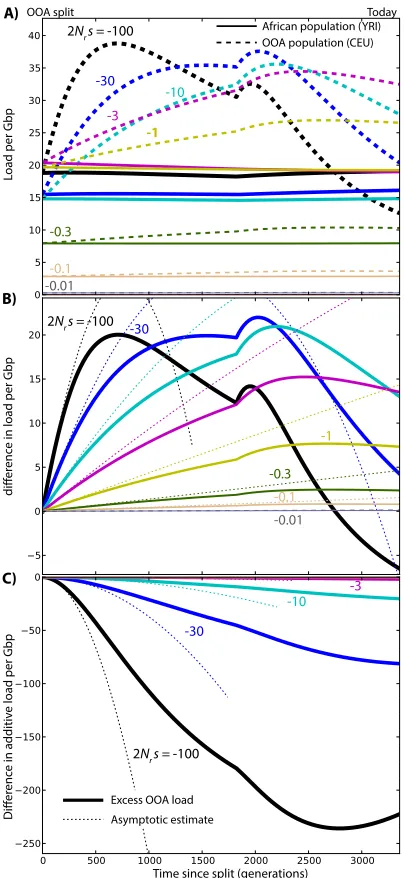
The picture changes dramatically when we consider reces-sive deleterious variants (h¼0). Reactions to changes in popu-lation size are linear rather than quadratic, and they are more substantial than in the additive case (Figure S1). The OOA load due to segregating variants with 2Nrs¼ 2100 almost doubles after 500 generations. This excess load in the OOA population is due entirely to drift and leads to an increased efficacy of selection in the OOA population because a higher proportion of deleterious alleles is now visible to selection. The difference in load for the most deleterious variants is therefore not sustained. Both the number of very deleterious variants and the associated genetic load eventually become higher in the simulated Yoruba population. By contrast, weak-effect deleterious variants contribute more load in the simulated European population.
Even though a bottleneck inexorably leads to increased load when no dominance is present, the additional exposure
of recessive variants therefore leads to“purging,”a reduction in the frequency of deleterious alleles [see Glémin (2003) and references therein]. Simulations show that the increase in recessive load can last hundreds or thousands of gener-ations for weakly deleterious variants. Glémin (2003) ar-gued that the purging effect is suppressed in constant-sized population when Nsis much less than“2 to 5.”This also holds in a nonequilibrium setting in recessive alleles going through a bottleneck (Figure S1) (see also Wang et al. 1999). The time required for purging to compensate the initial fitness loss increases rapidly as the magnitude of the selection coefficients decreases: whereas our model predicts a reduced load in present-day OOA populations for alleles with 2Nrs¼ 2100, it would take over 20,000 generations of continued isolation in a large constant-sized population to see purging in alleles with 2Nrs¼ 23 (Fig-ure S6).
Opposite effects are observed for dominant deleterious variants (Figure S7). Drift tends to increasefitness by com-bining more of the deleterious alleles into homozygotes, re-ducing their average effect onfitness. The difference between populations is much less pronounced and less sustained than in the recessive case. Equation 6 shows that the reduced magnitude is caused by reduced ancestral heterozygosity
p1;0: dominant deleterious alleles are much less likely to reach appreciable allele frequencies before the split. Here again, the population with the highest load depends on the selection coefficient, with a higher load in the simulated Eu-ropean population for strongly deleterious variants and a higher load in the simulated Yoruba population for the weakly deleterious variants.
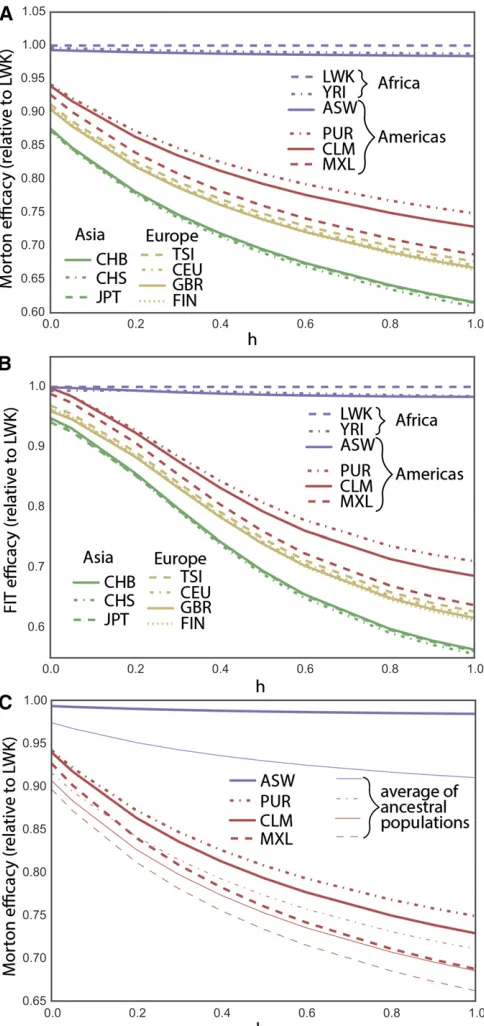
Present-Day Differences in the Efficacy of Selection The Wright-Fisher predictions for the instantaneous Morton and FIT efficacies of selection (Equations 3 and 5) depend on the present-day allele frequency distribution, on the domi-nance coefficienth, and on the selection coefficients. How-ever,sis a multiplicative factor in both equations and cancels out when we consider the relative rate of adaptation across populations. We can therefore use Equations 3 and 5 to esti-mate differences in the efficacy of selection between popu-lations based on the present-day distribution of allele frequencies. For nearly neutral alleles, the present-day fre-quency distribution is similar to the neutral frefre-quency spec-trum and largely independent ofh. We can therefore use the present-day frequency spectrum for synonymous variation to estimate the relative efficacy of selection for all nearly neutral alleles at different values ofh(Figure 4).Figure S9and Fig-ure S10 show similar results for nonsynonymous and pre-dicted deleterious alleles (for the most deleterious classes, the assumption that the present-day frequency spectra de-pend weakly onhis less accurate).
In the nearly neutral case, the Luhya population (LWK) shows the highest Morton and FIT efficacies of selection for most dominance parameters and is used as a basis of com-parison. The estimated FIT efficacy of selection is higher in African population for all dominance coefficients, as is the Morton efficacy, except for completely recessive alleles. The reduction in Morton efficacy of selection for nearly neutral variation in OOA populations is 25–39% for dominant var-iants, 19–31% for additive varvar-iants, and 6–13% for fully recessive variants. The reduction in the FIT efficacy in OOA populations is 29–44% for dominant variants, 19– 31% for additive variants, and 0.2–6% for fully recessive variants. This is also consistent with the interpretation of Glémin (2003) that purging, measured as the reduction in the frequency of recessive alleles caused by a bottleneck, is not expected for nearly neutral variants. By contrast, esti-mates using sites with high predicted pathogenicity accord-ing to combined annotation-dependent depletion (CADD) (Kircheret al.2014) do suggest that purging of deleterious variation by drift is still ongoing in OOA populations (Figure S9andFigure S10).
Admixed populations from the Americas with the highest African ancestry proportion also show elevated predicted efficacy of selection: African Americans (75.9% African an-cestry) (Baharianet al.2015), Puerto Rican (14.8% African ancestry) (Gravelet al.2013), Colombians (7.8% African ancestry) (Gravel et al. 2013), and Mexican Americans (5.4% African ancestry) (Gravelet al.2013). The predicted Morton efficacy of selection in admixed populations is much larger than the weighted average of source populations would suggest (Figure 4C, which uses CHB, CEU, and YRI as ancestral population proxies for native, European, and African ancestries). By averaging out some of the genetic drift experienced by the source populations since their divergence, admixture increases the overall amount of additive variance in the population and
therefore leads to a substantial and rapid increase in the predicted efficacy of selection for nearly neutral alleles.
Data availability
The authors state that all data necessary for confirming the conclusions presented in the article are represented fully within the article.
Discussion
Selection affects evolution in many ways. It tends to increase the frequency of favorable alleles and the overallfitness of a population, and it often reduces diversity. The rates at which it performs these tasks vary across populations, and population geneticists like to frame these differences in terms of the efficacy of selection. The word“efficacy”implies a measure of achievement, but there are many ways to define ment for selection. We considered two measures of achieve-ment: the change in deleterious allele frequency (i.e., the Morton efficacy) and the change in load caused by selection (i.e., the FIT efficacy). Even though the two quantities are closely related and are equal for additive selection, the Mor-ton efficacy is much easier to measure: systematic differences in the frequency of deleterious alleles are robust to drift and to modest changes in the environment. By contrast, the FIT efficacy is impossible to observe directly and requires picking apart the contributions of selection, drift, and the environ-ment. Given the long-standing controversy about how this should be done in the context of Fisher’s fundamental theo-rem (Ewens and Lessard 2015), we would advise against using it.
We have argued that other popular measures for the efficacy of selection (Lohmueller et al. 2008; Casals et al. 2013; Lohmueller 2014; Henn et al. 2016) are biased in out-of-equilibrium populations studied over short time scales. Many previous claims that selection acted differen-tially in human populations (Lohmuelleret al.2008; Casals et al.2013) could be explained by these biases. Confirming this interpretation, Fuet al.(2014) found no differences in the average frequency of deleterious alleles between African Americans and European Americans in the ESP 6500 data set (NHLBI GO Exome Sequencing Project 2012). However, they did report a slight but extremely significant difference in the average number of deleterious alleles per individual for a set of putatively deleterious SNPs. The contrasting results are surprising because the two statistics are equal up to a multi-plicative constant: the average number of deleterious alleles per genome equals the mean frequency of deleterious alleles multiplied by the number of loci. We could reproduce the results from Fuet al.(2014) but found that the statistical test used did not account for variability introduced by genetic drift in afinite genome: results remained significant if allele frequencies were randomly permuted between African Amer-icans and European AmerAmer-icans (see Section S1 ofFile S1for details). This emphasizes that an empirical observation of differences in genetic load must be robust to bothfinite sam-ple size andfinite genome to be attributed to differences in the efficacy of selection.
Figure 4,Figure S9, andFigure S10strongly suggest that the OOA bottleneck still influences the present-day efficacy of selection. By extension, they also suggest that the efficacy of selection did differ and will differ among populations. Im-portantly, the differences in frequency distributions across populations that provide this support are not aconsequence
of past differences in the efficacy of selection but a possible causefor such differences in the present and future. We have shown that some of the future differences are not inevitable and can be attenuated by demographic processes including admixture. Therefore, measuring actual differences in the efficacy of selection can only be achieved by measuring actual differences in the average frequency or effect of deleterious alleles.
The simulations presented here, together with the results of Simonset al.(2014) and Doet al.(2014), do suggest that the classical prediction on the differential efficacy of selection in small populations can be verified if only we can accurately isolate variants of specific selective effect and dominance coefficients. By picking apart variants of different selection and dominance coefficients, we should soon be able to con-vincingly and directly observe the consequences of differ-ences in the efficacy of selection. The recent results of Henn et al.(2016) using a version of the Morton efficacy suggest such differences for a subset of variants and therefore provide important experimental validation for a classical population genetics prediction. By contrast, the observation of genome-wide differences in the efficacy of selection across popula-tions depends on the cancellation of effects across different variant classes and therefore can depend sensitively on the particular choice of a metric. For this reason, overall differ-ences in load among populations may not be particularly informative about the fundamental processes governing human evolution.
Acknowledgments
I thank S. Baharian, M. Barakatt, B. Henn, D. Nelson, and S. Lessard for useful comments on this manuscript and W. Fu and J. Akey for help in reproducing their results. This research was undertaken, in part, thanks to funding from the Canada Research Chairs Program and a Sloan Research Fellowship.
Literature Cited
1000 Genomes Project Consortium, 2012 An integrated map of genetic variation from 1,092 human genomes. Nature 491: 56– 65.
Adzhubei, I., D. M. Jordan, and S. R. Sunyaev, 2013 Predicting functional effect of human missense mutations using PolyPhen-2.Curr. Protoc. Hum. Genet.76: 7.20.1–7.20.41.
Baharian, S., M. Barakatt, C. R. Gignoux, and S. Shringarpure, 2015 The Great Migration and African-American genomic di-versity. bioRxiv (in press).
Balick, D. J., R. Do, C. A. Cassa, D. Reich, and S. R. Sunyaev, 2015 Dominance of deleterious alleles controls the response to a population bottleneck. PLoS Genet. 11: e1005436. Boyko, A. R., S. H. Williamson, A. R. Indap, J. D. Degenhardt, R. D.
Casals, F., A. Hodgkinson, J. Hussin, Y. Idaghdour, V. Bruatet al., 2013 Whole-exome sequencing reveals a rapid change in the frequency of rare functional variants in a founding population of humans. PLoS Genet. 9: e1003815.
Crow, J. F., 1958 Some possibilities for measuring selection in-tensities in man. Hum. Biol. 30: 1–13.
Crow, J. F., and M. Kimura, 2009 An Introduction to Population Genetics Theory. Blackburn Press, Caldwell, NJ.
Davydov, E. V., D. L. Goode, M. Sirota, G. M. Cooper, A. Sidowet al., 2010 Identifying a high fraction of the human genome to be under selective constraint using GERP++. PLOS Comput. Biol. 6: e1001025.
Do, R., D. Balick, H. Li, I. Adzhubei, S. Sunyaevet al., 2014 No evidence that selection has been less effective at removing del-eterious mutations in Europeans than in Africans. Nat. Genet. 47: 126–131.
Evans, S. N., Y. Shvets, and M. Slatkin, 2007 Non-equilibrium theory of the allele frequency spectrum. Theor. Popul. Biol. 71: 109–119.
Ewens, W. J., 2012 Mathematical Population Genetics 1: Theoret-ical Introduction. Springer Science & Business Media, New York. Ewens, W. J., and S. Lessard, 2015 On the interpretation and relevance of the fundamental theorem of natural selection. Theor. Popul. Biol. 104: 59–67.
Fu, W., R. M. Gittelman, M. J. Bamshad, and J. M. Akey, 2014 Characteristics of neutral and deleterious protein-coding variation among individuals and populations. Am. J. Hum. Genet. 95: 421–436.
Gazave, E., D. Chang, A. G. Clark, and A. Keinan, 2013 Population growth inflates the per-individual number of deleterious muta-tions and reduces their mean effect. Genetics 195: 969–978. Glémin, S., 2003 How are deleterious mutations purged? Driftvs.
nonrandom mating. Evolution 57: 2678–2687.
Gravel, S., B. M. Henn, R. N. Gutenkunst, A. R. Indap, G. T. Marth
et al., 2011 Demographic history and rare allele sharing among human populations. Proc. Natl. Acad. Sci. USA 108: 11983–11988.
Gravel, S., F. Zakharia, A. Moreno-Estrada, J. K. Byrnes, M. Muzzio
et al., 2013 Reconstructing Native American migrations from whole-genome and whole-exome data. PLoS Genet. 9: e1004023.
Gutenkunst, R. N., R. D. Hernandez, S. H. Williamson, and C. D. Bustamante, 2009 Inferring the joint demographic history of multiple populations from multidimensional SNP frequency data. PLoS Genet. 5: e1000695.
Haldane, J., 1937 The effect of variation offitness onfitness. Am. Nat. 71: 337–349.
Henn, B. M., L. R. Botigué, C. D. Bustamante, A. G. Clark, and S. Gravel, 2015 Estimating the mutation load in human genomes. Nat. Rev. Genet. 16: 333–343.
Henn, B. M., L. R. Botigué, S. Peischl, I. Dupanloup, M. Lipatov
et al., 2016 Distance from sub-Saharan Africa predicts muta-tional load in diverse human genomes. Proc. Natl. Acad. Sci. USA 113: E440–E449.
Hwang, D. G., and P. Green, 2004 Bayesian Markov chain Monte Carlo sequence analysis reveals varying neutral substitution pat-terns in mammalian evolution. Proc. Natl. Acad. Sci. USA 101: 13994–14001.
Kimura, M., 1964 Diffusion models in population genetics. J. Appl. Probab. 1: 177.
Kimura, M., T. Maruyama, and J. F. Crow, 1963 The mutation load in small populations. Genetics 48: 1303.
Kircher, M., D. M. Witten, P. Jain, B. J. O’Roak, G. M. Cooperet al., 2014 A general framework for estimating the relative patho-genicity of human genetic variants. Nat. Genet. 46: 310–315. Lohmueller, K. E., 2014 The distribution of deleterious genetic
variation in human populations. Curr. Opin. Genet. Dev. 29: 139–146.
Lohmueller, K. E., A. R. Indap, S. Schmidt, A. R. Boyko, R. D. Hernandezet al., 2008 Proportionally more deleterious genetic variation in European than in African populations. Nature 451: 994–997.
Morton, N. E., J. F. Crow, and H. J. Muller, 1956 An estimate of the mutational damage in man from data on consanguineaous marriages. Proc. Natl. Acad. Sci. USA 42: 855.
Mustonen, V., and M. Lassig, 2010 Fitnessflux and ubiquity of adaptive evolution. Proc. Natl. Acad. Sci. USA 107: 4248–4253. NHLBI GO Exome Sequencing Project, 2012 Exome variant server. Available at: evs.gs.washington.edu/EVS/. Accessed Oc-tober 2015.
Peischl, S., I. Dupanloup, M. Kirkpatrick, and L. Excoffier, 2013 On the accumulation of deleterious mutations during range expan-sions. Mol. Ecol. 22: 5972–5982.
Ramachandran, S., O. Deshpande, C. C. Roseman, N. A. Rosenberg, M. W. Feldmanet al., 2005 Support from the relationship of genetic and geographic distance in human populations for a serial founder effect originating in Africa. Proc. Natl. Acad. Sci. USA 102: 15942–15947.
Reed, D., and R. Frankham, 2003 Correlation betweenfitness and genetic diversity. Conserv. Biol. 17: 230–237.
Roze, D., and F. Rousset, 2003 Selection and drift in subdivided populations: a straightforward method for deriving diffusion approximations and applications involving dominance, selfing and local extinctions. Genetics 165: 2153–2166.
Simons, Y. B., M. C. Turchin, J. K. Pritchard, and G. Sella, 2014 The deleterious mutation load is insensitive to recent population history. Nat. Genet. 46: 220–224.
Tishkoff, S. A., E. Dietzsch, W. Speed, A. J. Pakstis, J. R. Kiddet al., 1996 Global patterns of linkage disequilibrium at the CD4 lo-cus and modern human origins. Science 271: 1380–1387. Wang, J., W. G. Hill, D. Charlesworth, and B. Charlesworth,
1999 Dynamics of inbreeding depression due to deleterious mutations in small populations: mutation parameters and in-breeding rate. Genet. Res. 74: 165–178.
Whitlock, M. C., 2002 Selection, load and inbreeding depression in a large metapopulation. Genetics 160: 1191–1202.
Appendix
Background
To derive the asymptotic results in the text, we start with the diffusion approximation for the distributionfðx;tÞof allele frequenciesxover timetin an infinite-sites model (see Crow and Kimura 2009, section 8.6):
@fðx;tÞ
@t ’
1 4N
@2
@x2xð12xÞfðx;tÞ2s
@
@x½hþ ð122hÞxxð12xÞfðx;tÞ þ2Nud
x2 1 2N
(A1)
whereNis the effective population size,his the dominance coefficient,sis the selection coefficient, anduis the mutation rate. In this model, new mutations are constantly added via Dirac’s delta functiond. Because there are no back-mutations in this model, the proportion offixed mutations increases over time without bound. Because we are only interested in population differences accumulating over a short time span, however, we can simply ignore the (infinite) number of deleterious alleles thatfixed before the population split. The time scales that we will consider are short enough that back-mutations and multiple mutations contribute little to changes in allele frequencies.
A complete solution of this problem can be expressed as a superposition of Gegenbauer polynomials (Kimura 1964). However, here we are looking for simple asymptotic results that will help us to understand the dynamics of the problem. We will consider the evolution of moments of the allele frequency distributionmk[
R1 0 dxx
k
fðx;tÞ. Similar moment approaches have been used in Evanset al.(2007) and Balicket al.(2015). Because there is a potentially infinite number offixed sites at frequencies 0 and 1, it is often convenient to distinguish contributions from segregating sites andfixed sites,i.e.,
mk ¼
Z 12
0þ dxx k
fðx;tÞ þK0dk;0þK1
whereK0is the number of sitesfixed at frequency 0,K1is the number of sitesfixed at frequency 1, anddk;0is Kronecker’s delta. BothK0andK1can be infinite in this model, but this will not be a problem because we will ultimately consider only differences or rates of change in the moments, and these remainfinite. In this notation,m0is the (possibly infinite) number of sites, andm1 is the expected number of alternate alleles per haploid genome.
To obtain evolution equations for the moments, we integrate both sides of Equation A1 usingR01þ2dxxk. The left-hand side gives
Z 12
0þ dxx
k @fðx;tÞ
@t ¼
@R12
0þ dxxkfðx;tÞ
@t ¼m_k2K_0dk;02K_1
(A2)
and the right-hand side can be integrated by parts. Fork¼0, this yields
_
m0¼2Nu2f
ð0;tÞ þfð1;tÞ
4N þK_0þK_1
wherefð0;tÞandfð1;tÞare defined by continuity from the open intervalð0;1Þand do not includefixed sites. Because the number of sites is constant (m_0 ¼0) and the diffusion equation is continuous, we require
_
K0¼ 22Nuþf ð0;tÞ 4N _
K1¼fð1;tÞ 4N
(A3)
These equations are equivalent to equations 3.18 and 3.19 in Kimura (1964).
To obtain an evolution equation formkat arbitraryk, we return to the integration of Equation A1 with R12
0þ dxxk. We use the left-hand-side expression obtained in Equation A2 and once again integrate the right-hand side by parts. This yields
_
mk¼
kðk21Þ 8N pk21þ
sk 4Gk;hþ
u
ð2NÞk21 (A4)
pk¼2 mk2mkþ1
Gk;h¼2½hpkþ ð122hÞpkþ1
(A5)
These are functions of the momentsmand therefore can be thought of as measures of the shape of the frequency distributionf. Thefirst term in Equation A4 represents the effect of drift; the second term, the effect of selection; and the third term, the effect of mutation. For example, ifk¼1 andh¼1=2, we get
_
m1¼sðm12m2Þ=2þu
The frequency of damaging alleles can decrease because of selection or increase because of mutation.
Response in Allele Frequencies
Solving Equation A4 in general is challenging becausem_k can depend onmkþ1 andmkþ2, leading to an infinite number of coupled equations. However, it can be used to calculate the response in allele frequency to a sudden change in demographic or selective conditions. Consider a population of sizeNothat experiences a change in size toNAat timet¼0. We can expandmk for short times,i.e.,
mkðtÞ ¼mk;oþmk;1tþmk;2t2þO t3
(A6)
wheremk;ois thekth moment prior to the population size change, andOðt3Þrepresent terms at least cubic int. The coefficients can be evaluated by expanding both sides of Equation A4 using Equation A6 and then collecting powers oft. For example, we get
m1ðtÞ ¼m1;oþ
sG1;ht¼0 4 þu
!
tþO t2
The frequency of variants can increase even in a steady-state regime withNA¼Nobecause our model assumes a constant supply of irreversible mutations. However, this linear term is independent of NA and does not contribute to differences across populations that share a common ancestor. DifferencesDm1ðtÞin the number of segregating sites between two populations with sizesNAandNBappear at the next order int. Computations are elementary but a bit more cumbersome. Matching terms linear intin Equation A4, wefind Equation 10:
Dm1ðtÞ ¼ st2
8
ð3h21Þp1;oþ3ð122hÞp2;o
3
1 NB2
1 NA
þO t3
wherepi;ois the momentpicomputed for the common ancestral population.
Response in Genetic Load
To compute thefitness in the diploid case, we write
W¼s½2hm1þ ð122hÞm2 (A7)
Using Equation A4, we get
_
W¼W_sþW_uþW_N (A8)
where
_ Ws¼s
s
2 hG1;hþ ð122hÞG2;h
_
Wu¼sð2huÞ
_ WN¼s
ð1
22hÞ 4N p1
are the instantaneous contributions of selection, mutation, and drift to changes infitness. The mutation term is constant in time and independent of population size; it does not contribute directly to differences across populations. The drift term, by contrast, has an explicit dependence on the population size; this leads to differentiation between populations that grow linearly in time. To see this, we compute the load using Equation A7 and the time dependence computed in Equation A6 as in the sectionResponse in Allele Frequencies:
DW¼W12W2¼2
sð122hÞtp1;o 4
1 NB2
1 NA
þO t2 (A10)
This reduction in load is driven by drift,i.e., the third term in Equation A9. It is not caused by selection, in the sense that it does not result from differential reproductive success between individuals. As expected, the contribution of drift vanishes for additive variants (h¼1=2).
For arbitraryh, the change infitness caused by selection is
DWs¼s 2t2P
h 16
1 NB2
1 NA
þO t3
wherePhis a statistic of the ancestral frequency distribution,i.e.,
P
h¼4hp1;oð5h22Þ212p2;oð122hÞð124hÞ þ24p3;oð122hÞ2 (A11)which reduces to the heterozygosityp1;0whenh¼1=2:The statisticPhdepends only on the ancestral frequency distribution and the dominance coefficient.
Genetic drift also contributes to the changes in load at second order intthroughWN_ . In addition to the linear term from Equation A10, wefind three quadratic contributions that vanish whenh¼1=2: a second-order contribution of genetic drift, a contribution from the rate of change in population size and drift, and a contribution from new mutations and drift. Even though these terms can be comparable in magnitude to the contribution of selection in Equation A11 whenh6¼1=2, they are sub-dominant to Equation A10. We only consider the contribution of new mutations in some detail because this contribution tells us whether population differentiation in the genetic load is due to old, shared variation or to new, population-specific variation.
Effect of New Mutations
If we setpi;o¼0 in the preceding equations, we can calculate the impact of new mutations on the genetic load. The leading term is again due to drift and dominance:
DWnew¼2
sut2ð122hÞ 4
1 NB2
1 NA
þO t3 (A12)
while the leading term describing the efficacy of selection is now cubic int:
DWs;new¼s
2t3uhð5h22Þ 6
1 NB2
1 NA
þO t4
Whenh6¼1=2, drift also contributest3terms toDWnew. These are reasonably straightforward to compute but are subdominant to Equation A12. We therefore use the asymptotic result
DWnew;asymptotic¼2sut
2ð122hÞ 4
1 NB2
1 NA
þs2t3uhð5h22Þ 6
1 NB2
1 NA
(A13)
GENETICS
Supporting Information www.genetics.org/lookup/suppl/doi:10.1534/genetics.115.184630/-/DC1
When Is Selection Effective?
Simon Gravel
-1
-0.3
-0.1
-0.01
Today OOA split
-30
-10
-1
-0.3
-0.01
-0.1
Load per Gbp
diff
er
enc
e in load per Gbp
A)
B)
-3
-30
-10 -3
Diff
er
enc
e in additiv
e load per Gbp
C)
Time since split (generations) OOA population (CEU) African population (YRI)
-30
Asymptotic estimate Excess OOA load 2Nr s = -100
2Nr s = -100
2Nr s = -100
Figure S1 Changes in load after the OOA split model illus-trated in Figure3A, assuming a recessive variant (h = 0.0), as a function ofsand given ancestral population sizeNr =
-100
-10, -1 -0.3
-0.1
-0.01
Today OOA split
2Nr s = -30
-1
-0.1
Load per Gbp
A)
B)
-3
-30
-10
C)
Time since split (generations) OOA population (CEU) African population (YRI)
-10
-0.3
-30 -3
-0.01
-3, -1,-0.3,-0.1,-0.01
2Nr s = -100
Asymptotic estimate Excess OOA load
2Nr s = -100
diff
er
enc
e in load per Gbp
Diff
er
enc
e in additiv
e load per Gbp
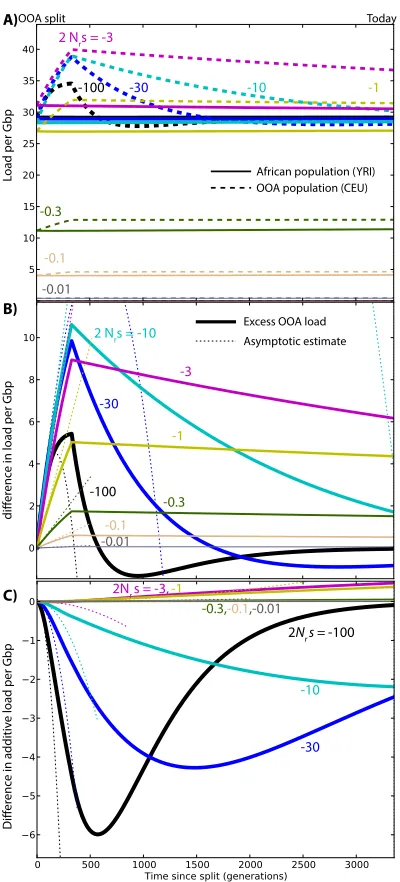
Figure S2Changes in load after the OOA split model il-lustrated in Figure3A, assuming partial recessive variants (h = 0.05) as a function ofsand given ancestral population sizeNr = 11, 930. (A) Overall genetic load evolution. The
-10, -1 -0.3
-0.1
-0.01
Today OOA split
-30
-1
-0.01
-0.1
Load per Gbp
A)
B)
-3
-30
-10
C)
Time since split (generations) OOA population (CEU) African population (YRI) 2 Nr s = -3, -30, -100
-10
-3, -1,-0.3,-0.1,-0.01
-0.3
2Nr s = -100 2Nr s = -100
diff
er
enc
e in load per Gbp
Diff
er
enc
e in additiv
e load per Gbp
Asymptotic estimate Excess OOA load
Figure S3Changes in load after the OOA split model il-lustrated in Figure3A, assuming partial recessive variants (h = 0.2) as a function ofsand given ancestral population sizeNr = 11, 930. (A) Overall genetic load evolution. The
-100
-10
-0.3
-0.1
-0.01
Today OOA split
-30
-1
-0.1
Load per Gbp
A)
B)
-3
-30 2 Nrs = -10
C)
OOA population (CEU) African population (YRI)
-10
-0.3 -30 -100 2 Nrs = -3
-0.01
-0.3,-0.1,-0.01
-1
2Nr s = -3, -1
diff
er
enc
e in load per Gbp
Diff
er
enc
e in additiv
e load per Gbp
Asymptotic estimate Excess OOA load
2Nr s = -100
Figure S4Changes in load after the simple OOA bottleneck model from (Doet al.2014), assuming partial recessive vari-ants (h=0.2) as a function ofsand given ancestral population sizeNr = 11, 930. (A) Overall genetic load evolution. The
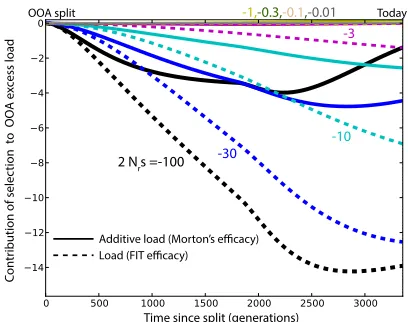
Load (FIT efficacy)
Additive load (Morton’s efficacy)
Con
tr
ibution of selec
tion t
o OO
A e
xc
ess load
Time since split (generations)
-10
-30 2 Nrs =-100
-3
-1,-0.3,-0.1,-0.01 Today OOA split
-30
-10 2Nrs = -3
-1
-0.3
-0.1
-0.01
Today OOA
split Hypothetical future assuming large, isolated populations
2 Nrs =-100
Figure S6 Excess recessive load in OOA populations, assum-ing continued future isolation between large populations (N=20Nr). This serves to illustrate that the ‘purging’ effect of
the bottleneck on deleterious variants is observed for all alleles withNrs <−3, but that it would require much more time to
-30,-100
-10
-3 2 Nrs = -1
-0.3
-0.1
-0.01
Today OOA split
-100 2 Nrs =-30
-10
-1 -0.3
-0.01
-0.1
OOA population (CEU) African population (YRI)
Load per Gbp
Ex
cess OO
A load per Gbp
A)
B)
-3
-30
-10
2Nrs = -3
-1
-0.3 -0.1
-100
Ex
cess OO
A additiv
e load per Gbp
C)
Time since split (generations)
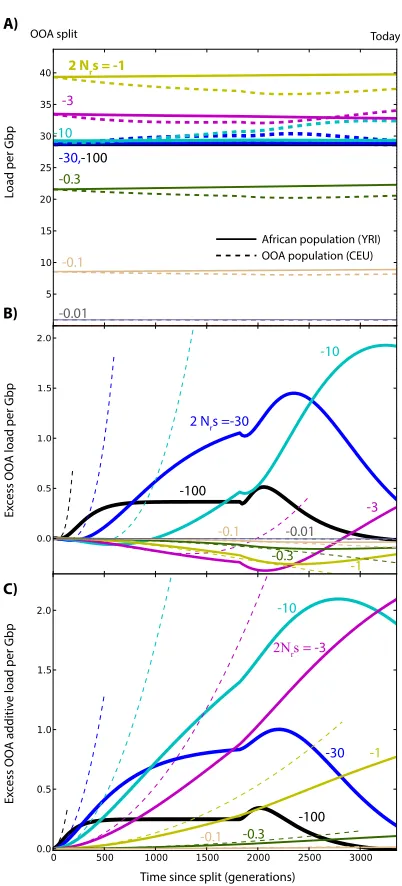
Figure S7 Changes in load after the OOA split model illus-trated in Figure3A, assuming dominant deleterious variants (h = 1), as a function ofsand given ancestral population sizeNr = 11, 930. (A) Overall genetic load evolution. The
-30
2Nrs = -3
-0.3
-100
-10
Asymptote Simulation Today Future, assuming N=20 Nref
OOA split
-1 -0.1-0.01
Figure S8 Changes in load caused by new mutations after the OOA split model illustrated in Figure3A, givenh= 0.5 and ancestral population sizeNr =11, 930. The dashed lines
M
or
ton efficac
y (r
ela
tiv
e t
o L
WK
)
h FIN GBR CEU TSI
JPT CHB CHS Asia Europe
LWK
MXL PUR YRI ASW
CLM Americas Africa A)
FIN GBR CEU TSI
JPT CHB CHS Asia Europe
LWK MXL PUR
YRI ASW CLM Americas
Africa
FIT efficac
y (r
ela
tiv
e t
o L
WK
)
h B)
M
or
ton efficac
y (r
ela
tiv
e t
o L
WK
)
h FIN GBR CEU TSI
JPT CHB CHS Asia Europe
LWK
MXL PUR YRI ASW
CLM Americas Africa
FIN GBR CEU TSI
JPT CHB CHS Asia Europe
LWK
MXL PUR YRI ASW
CLM Americas Africa
FIT efficac
y (r
ela
tiv
e t
o L
WK
)
h B)
Supplementary material for
When is selection effective?by S. Gravel
S1. Analysis of the Fu et al. result
Fu et al presents two different tests for differences in the number of deleterious alleles between individuals. In the first test, a t-test, they compare the average frequency of deleterious alle-les between the two populations and find no significant differ-ences (p=0.82). In the second test (a Mann-Whitney test), they compared the number of deleterious alleles per individual, and found an extremely significant difference (p<10−15). We could reproduce these results using the publicly available ESP 6500 data (National Heart, Lung, and Blood Institute (NHLBI) GO Exome Sequencing Project 2012) using a permutation test. Since the average frequency of deleterious alleles and the number of deleterious alleles per individual are related by a proportionality constant (i.e., the length of the genome), we suspected that the significant difference results from a difference in the underlying null models of each test.
To verify this, we produced simulated datasets in which the allele frequency at each site was randomly permuted between European-Americans and African-Americans, creating a dataset for which there is no meaningful evolutionary difference be-tween the two populations, except for randomly assigned differ-ences in allele frequency. We nevertheless found very significant differences between the average number of deleterious alleles carried by individuals of the two populations for most simula-tions. This effect can even be reproduced by analyzing a single SNP. The Mann-Whitney test used in Fu et al. conditions on the set of SNPs used and therefore does not account for the fact that drift can have affected different SNPs differently. The difference in deleterious allele count observed in Fu et al is therefore real, but it only applies to a particular set of SNPs and it is consistent with the action of genetic drift acting on neutral variation. It does not indicate differences in the action of selection, nor systematic differences in fitness across populations. To assign differences in deleterious allele frequency to the systematic action of selection, one must show that the difference is robust to both finite sample size and finite genome effects. Both can be tested through simple resampling strategies. In the ESP6500 example, resampling over SNPs by bootstrap led to no significant differences in the number of deleterious alleles per individual.
S2. Reduction in heterozygosity (RH) statistic
The reduction in heterozygosity (RH) statistic was recently in-troduced (Hennet al.2016) as a tool to measure the effect of selection on population diversity as an addition to analyses based on Morton’s efficacy. In this section, we show that even thoughRHis an interesting measure of diversity in a popula-tion, its interpretation in terms of the effect of selection can be challenging: First,RHcan be affected by recent mutation and, second, differences in the effect of selection onRHmay reflect rather mundane normalization issues rather than interesting biology.
RHis defined as
RH≡1− π|s
π|n
,
whereπis the average heterozygosity,|sindicates a quantity
measured at selected sites, and|nindicates a quantity measured
at neutral sites. The rate of change in RH is therefore
˙
RH=−π˙|s
π|n
+π|sπ˙|n
π2|n (S2)
Using equation (A4) and (A5) to leading order in N1, we find
˙
π|n=
−π|n
2N +2u|n
˙
π|s=
−π|s
2N +2u|s+ sΓ1,h|s
2 −sΓ2,h|s.
(S3)
whereuis the mutation rate andΓi,his defined in Equation (A5).
The first terms describe the action of drift, the second terms describe the action of mutation, and the last two terms in the second line describe the action of selection. The contributions of drift cancel out in Equation (S2), so that ˙RHonly depends on contributions from selection and mutation:
˙
RH=s2Γ2,h|s−Γ1,h|s
2π|n
+2u|n
π|s
π2|n
−2u|s
π|n
. (S4)
Now consider the rate of change in the difference∆RH be-tween populationsAandB:
˙
∆RH=s∆2Γ2,h|s−Γ1,h|s
2π|n
+2∆ u|n
π|s
π2|n
−u|s
1
π|n !
=s∆2Γ2,h|s−Γ1,h|s
2π|n
+2∆ 1
π|n
u|n(1−RH)−u|s
!
,
(S5)
By contrast with Morton’s efficacy, the mutation term does not cancel out for∆RH.
To show that the selection term can be substantial, we con-sider the case of strong selection, where 1−RH 1. In this case, the contribution of mutation to∆RH˙ is
−2u|s∆
1
π|n
,
while the contribution of selection to∆RH˙ is
s∆2Γ2,h|s−Γ1,h|s
2π|n
' −2hs∆µ1|s
π|n
'2u|s∆
1
π|n
(S6)
where the first approximation uses Equation (A5) and assumes that higher moments are sub-dominant under strong selection because allele frequencies are small. The second approximation uses the mutation-selection balance relationµ1|s '
−u|s
hs (e.g.,
equation 6.2.9 in (Crow and Kimura 2009)). The effects of mu-tation and selection on∆RHcancel out: average frequencies of very deleterious alleles are governed by the mutation-selection balance and are unaffected by population size differences. Mu-tation tends to increase RH in the less diverse population.
Identifying the effect of selection on diversity therefore re-quires picking apart the effects of selection and mutation (if measuring∆RH), or the effect of selection and drift (if measur-ing∆πs). As in the case of fitness, knowing only the present-day
S3. Example of two populations with identical start and end frequency distributions, but different measures of FIT efficacy
Imagine that all alleles all have dominance coefficient 0<h<
1, selection coefficientsand dominanceh, and consider two identical populations with exactlyLsegregating alleles, all at frequencyxoat timeto. The initial fitness in both populations
isWo = Ls 2hxo+ (1−2h)x2o
. Assume no mutation. In the second population, a short bottleneck occurs that increases the variance in allele frequency before selection had time to change mean allele frequencies. The difference in fitness between the two populations after the short bottleneck isδWbottleneck = Ls(1−2h)σ2, whereσ2is the variance in allele frequency in the
second population. The change in fitness in population 2 up to this point is entirely attributed to drift.
After the bottleneck, the population sizes increase to a very large value, so that subsequent effects of drift can be neglected. Selection is left to act until we have approached the maximum fitness state, which has fitnessW = Lsifs >0 andW =0 if
s<0. The change in fitnessW−Wois equal in both populations,
since the initial and final states are exactly the same. The FIT ‘effect of selection’ isW−Woin population 1, since all changes
are due to selection. In population 2, the effect of selection is
W−Wo−δWbottleneck, because a changeδWbottleneck was
caused by drift rather than by selection.
S4. Microscopic and macroscopic efficacy of selection
The main text discusses the effect of selection by averaging over all possible allelic trajectories. Recent work has defined a mi-croscopic ‘rate of adaptation’ (Mustonen and Lassig 2010) as a measure of the effect of selection on individual allele trajectories. Even though it is not possible to attribute specific changes in frequency to the effect of drift or to selection, individual tra-jectories can contain more information than allele frequency distributions.
In this section we explore the relationship between the mi-croscopic and mami-croscopic definitions of the rate of adaptation in the absence of mutation. Consider an individual allelic fre-quency trajectory{xt}t=1,...,T, withtthe time in generations. We
can write the fitness change∆Wtat generationtas
W(xt+∆xt)−W(xt)'W0(xt)∆xt+W00(xt) (∆xt)2
2 ,
where∆xt = xt+1−xt andW0 represents the partial
deriva-tive of the fitness function with respect to frequencyx. In the constant-fitness models discussed above,W0(xi) =2s(h+ (1−
2h)x)andW00(xi) =2s(1−2h). When|s| 1, the expectation
of∆xtis∆xt =sx(1−x)(h+x(1−2h)).
Through direct substitution, we find that the expectation
W0(x
t)∆xt = W0(xt)∆xt is also equal to ˙Ws in (5). The
sec-ond contribution to the change in fitness,W00(xt)(∆xt) 2
2 ,
there-fore corresponds to ˙WN. We therefore define the quantities
σt =W0(xt)∆xtas the microscopic analog to the macroscopic
FIT efficacy ˙Ws, andνt = W00(xt)(∆xt)2 as the analog to the
macroscopic effect of drift on selection ˙WN. These are not the
only possible analogs—for example, we could consider the ex-pectation of the linear termσtas the microscopic effect of
selec-tion, andνt+σt−σtas the microscopic effect of drift, without
changing the expected values.
Mustonen and Lassig define a ‘fitness flux’ φt as a
mea-sure of the rate of adaptation (Mustonen and Lassig 2010).
The fitness flux definition appears identical to our definition for the microscopic FIT efficacy σ = ∑tW0(xt)∆xt, namely
φt = ∑iW0(yi)∆yi, whereyi is an allele frequency trajectory
sampled densely in time. However, there is an important differ-ence in the assumptions about trajectories{x}and{y}. Whereas our trajectory{x}tis labeled by the time in generation, the time steps in{yi}are chosen so that∆yi N1. Because of this
con-straint, time steps in (Mustonen and Lassig 2010) must be finer than one generation, and theyi must be interpolated within
generations. While integrating over this smoothed trajectory, quadratic terms in∆ytcan be neglected: The integrated fitness