ISSN(Online): 2320-9801
ISSN (Print) : 2320-9798
I
nternational
J
ournal of
I
nnovative
R
esearch in
C
omputer
and
C
ommunication
E
ngineering
(An ISO 3297: 2007 Certified Organization)
Vol. 3, Issue 9, September 2015
Big Data Analytics and the Current
Generation
Benjamin Allen
PG Student, Dept. Computer Science, Vels University, Pallavarm, Chennai, India
ABSTRACT:It is obvious that we cannot do without data. Data forms the basis for decision-making process in every
organization, and individual’s life. In current generation, with the advancement in technology, large amount of data is generated which makes it very difficult, or rather impossible to analyze with traditional analytical tools in order to generate a meaning out of it for decision-making process. Big data analytics is an emerging research trend that constitutes a path for organizations and individuals aiming to achieve better customer support and decision-making process across a wide range of content providers. However, only few are aware of the impact of Big Data analytics on individuals and organizations in relation to social and technological transformation from the new age of Cloud Computing and Internet of Things (IoT) environment. This paper aims at exploring the Big Data analytics on individuals and organizations. The paper introduced Hadoop as the emergence powerful analytics tool for big data analytics. The rationale behind choosing Hadoop as a big data analytics tool was explained.
KEYWORDS: Big Data, Hadoop, HDFS, MapReduce.
I. INTRODUCTION
The real value of data lies in its analytics. Data forms the basis for decision-making in any individual’s life, and in every organization or enterprise be it education, health and so on. We reach to any conclusion in life, or make some generalizations based on generated data and the meaning derived from their analytics. Every day we are faced with some decisions to make based on some generated data which their meaning needs to be made know through analytics.
[6] define Big Data as “Datasets whose size is beyond the ability of typical database software tools to capture,
store, manage, and analyze. [5] writes that, “for data to be classified as big, it must possess the three Vs: Volume,
Variety and Velocity.
Big Data encompasses datasets that cannot be processed or are very difficult or rather impossible to be processed using traditional computing techniques. It is a heterogeneous large mix of data both structured (traditional datasets – in rows and columns like RDBMS tables and XLS’s), semi-structured (neither raw, nor typed data in a conventional database, like; Wiki pages, Tweets, Facebook data, and Instant messages), and unstructured data like; E-mail attachments, manuals, videos, audios, contacts, ECG and MRI images, and so on. Big Data is also referred to large datasets whose size is beyond the ability of a typical traditional database software tool to capture, store, manage, and analyze.
We are in an era of Big Data which are beyond the capability of traditional software analytical tool. Gone are the days when little amount of data are generated which traditional analytical tools had the capability of analyzing. Today, opposite is the case. With the advancement in Technology, Big Data is generated through Twitter, Facebook, Instagram, Google, Youtube, Skype, Whatsapp, Ebay and so on. These generated datasets are beyond the capability of traditional software analytical tool to capture, store, manage and analyze for some decisions to be made, or conclusion to be drawn.
ISSN(Online): 2320-9801
ISSN (Print) : 2320-9798
I
nternational
J
ournal of
I
nnovative
R
esearch in
C
omputer
and
C
ommunication
E
ngineering
(An ISO 3297: 2007 Certified Organization)
Vol. 3, Issue 9, September 2015
software analytical tools to generate, store, manage, and analyze. This is where “Hadoop” analytical tool which is
described in later pages comes into play and playing a very vital role in today’s big data analytics.
Big Data. How Big It Is?
[1], calls big data as “datasets that are so large (from Terabyte to Exabyte) and complex (from sensor to social media data) that they require advanced and unique storage, management, analysis, and visualization technologies.
Big Data refers to “all data” which constitute Structured, Semi-Structured, and Unstructured data that grows so large and fast that they are not manageable by traditional relational system (e.g. RDBMS). Due to the advent of new technologies, devices, and communication means like, social networking sites in current generation, the amount of data produced by mankind is growing rapidly every day. into route discovery process. RREQ message will be forwarded when the nodes have sufficient amount of energy to transmit the message otherwise message will be dropped. This condition will be checked with threshold value which is dynamically changing. It allows a node with over used battery to refuse to route the traffic in order to prolong the network life. In [6] Authors had modified the route table of AODV adding power factor field. Only active nodes can take part in rout selection and remaining nodes can be idle. The lifetime of a node is calculated and transmitted along with Hello packets. In [7] authors considered the individual battery power of the node and number of hops, as the large number of hops will help in reducing the range of the transmission power. Route discovery has been done in the same way as being done in on-demand routing algorithms. After packet has been reached to the destination, destination will wait for time δt and collects all the packets. After time δt it calls the optimization function to select the path and send RREP. Optimization function uses the individual node’s battery energy; if node is having low energy level then optimization function will not use that node.
“Big Data is at foundation of the mega trends that are happening today, from social to mobile to cloud to gaming” – Chris Lynch, Vertical Systems.
“There were 5 Exabyte of information created between the dawn of civilization through 2003, but that much is now created every 2 days” – [7]. According to research, the same amount was created in 2 days in 2011 and in every 10 minutes in 2013 and this rate is still growing.
The ever-increasing variety and amount of data been generated and the rate at which such data is generated
allows us to describe Big Data using “4Vs”.
Description Of Data Using 4Vs: Volume:
Volume refers to as the very huge amount of data that is generated every second. We do not longer talk about Terabytes in this current generation but Zeta bytes or Brontobytes. The beginning of time witnessed small amount of data generated measured in terms of bytes to megabytes. This is no longer the case today with advancement in technology where very huge amount of data are been generated in a distributed environment globally through social media such as, Twitter, Facebook, YouTube, and so on. Almost all organizations and enterprises today employ the social media for their business activities. They therefore use big data analytics and metrics to capture, store, manage, and analyze the data for better decisions and improve performance.
Velocity:
This refers to the speed at which new data is generated and at which the data moves around. Advancement in technology through social media witnessed a huge amount of data been generated in seconds. Technology allows us now to analyze the data while it is being generated without ever putting it into databases.
Variety:
ISSN(Online): 2320-9801
ISSN (Print) : 2320-9798
I
nternational
J
ournal of
I
nnovative
R
esearch in
C
omputer
and
C
ommunication
E
ngineering
(An ISO 3297: 2007 Certified Organization)
Vol. 3, Issue 9, September 2015
Veracity:
Veracity refers to the trustworthiness of data. Today, many forms of big data quality and accuracy are less controllable (we think of Twitter posts with hash tags, abbreviations, typos etc.), but technology allows us to work with this types of data.
II. RELATED WORK
Literatures relevant to this research from 2010 – 2015 were reviewed. Detailed description of the literatures is given below:
Big Data Analytics for Security:
Today big data analytics is playing a very vital role in the security sector. Based on Cloud Security Alliance 2013, Big Data Work Group, big data is leveraged to improve Information Security and situational awareness. For instance, big data is employed to analyze financial transactions, log files, and network traffic to identify anomalies and suspicious activities, and to correlate multiple sources of information to a coherent view. Data-driven information security dates back to bank fraud detection and anomaly-based intrusion detection systems. One of the visible uses of big data is fraud detection. Fraud detection was conducted for decade by Credit Card companies. However, the in-built infrastructure to mine data for fraud detection was not economical to adapt for other fraud detection uses. Big data analytics tools are now bringing attention to analytics for fraud detection in healthcare, insurance, and other fields.
Big Data and the Health Sector:
Health sector is another area that big data analytics is playing a vital role. According to research carried out by [3] on Big Data in Science and Healthcare, the benefits of health-related big data have been demonstrated in three areas so far, namely to:
1. Prevent diseases,
2. Identify modifiable risk factors for disease, and 3. Design interventions for health behaviour change.
In this current generation, organization worldwide are recognizing the big data movement and introducing new initiatives for knowledge discovery and data-driven decision-making. For instance, the National Institute of Health (NIH) is establishing the big data knowledge (BD2K) and infrastructure Plus Program which provides a share computational environment (e.g. data standards, ontologies, data catalogues, visualize cloud computing) to facilitate large-scale biomedical data analysis for the NIH community. Specifically, the NIH US library of Medicine hosts an impressive set of data sharing repositories, which primarily accept submissions of bio-medical data and other information sharing systems from NIH-funded investigators.
Big data streams on health can be broadly summarized into three categories:
Traditional medical data is primarily originated from the health system (e.g. EMRs, personal health history, medication history, lab reports, and pathology results). The objective of these analyses is to derive better understanding of disease outcome and risk factors, reduce health system cost and improve its efficiency.
“Omics” data refer to large-scale datasets in the biological and molecular fields (e.g. macrobiotics, metabolomics, genomics, and proteomics), where the aim of these analyses is to understand the mechanisms of medical treatments (e.g. “precision medicine”). As pointed out by [4] in the Stanford Big Data in Biomedicine Conference (2013), genomic testing and mapping could, for example, point to women in high risk of developing breast cancer, which would allow allocating them preventive care, and reduce the need for large scale, potentially hazardous interventions for other low-risk women.
ISSN(Online): 2320-9801
ISSN (Print) : 2320-9798
I
nternational
J
ournal of
I
nnovative
R
esearch in
C
omputer
and
C
ommunication
E
ngineering
(An ISO 3297: 2007 Certified Organization)
Vol. 3, Issue 9, September 2015
Supply Chain and Performance Management:
Supply chain management is another area where big data analytics can be used to forecast demand changes, and accordingly match their supply. Manufacturing, retail, as well as transport and logistics industries can increasingly benefit from this. [8] in their research on Big Data Analytics: Reviewed paper, pointed out that, “decisions on changing suppliers based on quality or price competitiveness can be taken by analyzing supplier data to monitor performance”. Accordingly, big data can lead to the identification of the root cause of cost, and provide for better planning and forecasting.
Another area where big data analytics can be valuable is performance management, where the government and healthcare industry can benefit easily. Staff performance information can be monitored and forecasted by using predictive analytics tools, this stems out from increasing need to improve productivity. This can allow departments link with their strategic objectives with the service or user outcomes, thus leading to increased efficiencies.
Risk Management:
Industries are benefiting from big data analytics in the area of risk management. Since evaluation and bearing of risk is a critical aspect of the industries, big data analytics can help in selecting investments by analyzing the likelihood of gains against the likelihood of loses. Big data can benefit organizations by enabling the quantification of risks.
Big Data Analytics:
As data is easy to be captured and gathered, its real value is in analytics. Data can be meaningless without analytics, and decisions cannot be made or conclusions reached or drawn. “Big data analytics is where advanced techniques operate on big data sets” [5]. It is the use of advance analytics tools and techniques to find hidden patterns in large datasets. It is the process of examining big data to uncover hidden patterns, unknown correlations and other useful information that can be used to make better decisions.
In this paper, Hadoop as a big data analytics tool is described. Hadoop was chosen over other big data analytics tools due to its powerful features. A detailed more description of Hadoop is given below.
Hadoop:
Hadoop was created by Doug Cutting, the creator of Apache Lucene. He named Hadoop after the name of his kid’s elephant.
“Hadoop is an Apache open source framework written in Java that allows distributed processing of large data sets across clusters suing simple programming models” – [9]. Hadoop framework application works in an environment that provides distributed storage and computation across clusters of computers. It is designed to scale up from single server to thousands of machines, each offering local computation and storage.
ISSN(Online): 2320-9801
ISSN (Print) : 2320-9798
I
nternational
J
ournal of
I
nnovative
R
esearch in
C
omputer
and
C
ommunication
E
ngineering
(An ISO 3297: 2007 Certified Organization)
Vol. 3, Issue 9, September 2015
Hadoop framework includes the following four models:
Hadoop Common:These are Java libraries and utilities required by Hadoop modules. These libraries provide
filesystem and OS level abstractions and contains the necessary Java files and script required to start Hadoop.
Hadoop YARN:This is a framework for job scheduling and cluster resource management.
HDFS:HDFS stands for Hadoop Distributed File System. It is a distributed filesystem that provides high
throughput access to application data.
Hadoop MapReduce:This is a YARN-based system for parallel processing of large data sets.
HDFS:
This is a distributed filesystem in Hadoop that hold very large amount of data and provides easier access. To store such huge data, the files are stored across multiple machines. These files are stored in redundant fashion to rescue the system of possible loses in case of failure. It also makes application available to parallel processing. HDFS is fault tolerant and designed using low cost hardware.
Features of HDFS:
It is suitable for distributed storage and processing.
HDFS provides file permission and authentication.
Streaming access to file system.
Hadoop provides a command interface to interact with the HDFS.
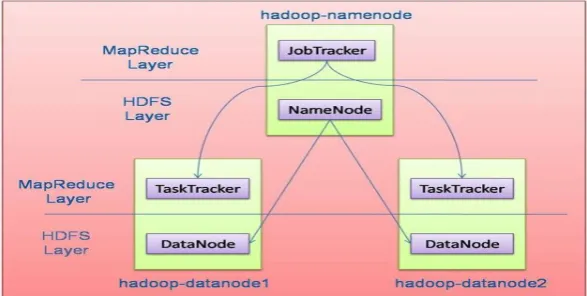
Figure 2: HDFS Archutecture
NameNode:
This is a commodity hardware that contains GNU/Linux operating system and the namenode software. It is software that can be run on commodity hardware. It acts as a master server and performs the following tasks:
Manages the file system namespace
Regulates client’s access to file.
ISSN(Online): 2320-9801
ISSN (Print) : 2320-9798
I
nternational
J
ournal of
I
nnovative
R
esearch in
C
omputer
and
C
ommunication
E
ngineering
(An ISO 3297: 2007 Certified Organization)
Vol. 3, Issue 9, September 2015
DataNode:
This is a commodity hardware that contains GNU/Linux operating system and the namenode software. For every node (Commodity hardware/system) in a cluster, there will be a datanode. The datanode performs the following tasks:
Perform read-write operations on the file systems based on the client’s request.
Also perform operations such as block creation, deletion, and replication according to the instructions of the
namenode.
Block: Segments containing files.
Goals of HDFC:
Fault tolerant and recovery.
Huge data sets.
Hardware at data: a requested task can be done efficiently, when the computation takes place near the data.
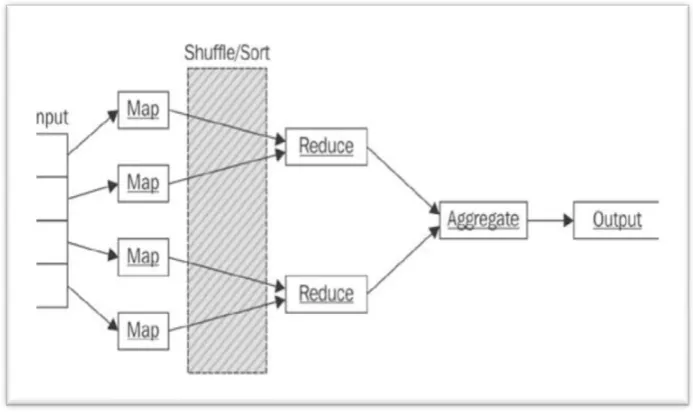
MapReduce:
Historically, data processing was completely done using database technologies. Most of the data had a well-defined structure and was often stored in relational databases. It is a software programming model for processing large
sets of data in parallel. MapReduce is a software framework for easily writing applications which process big amounts
of data in-parallel on large clusters (thousands of nodes) of commodity hardware in a reliable, fault-tolerant fashion. The term MapReduce actually refers to the following two different tasks that Hadoop programs perform:
The Map Task:This is the first task, which takes input data and converts it into a set of data, where individual
elements are broken down into tuples (key/value pairs).
The Reduce Task: This task takes the output from a map task as input and combines those data tuples into a
smaller set of tuples. The reduce task is always performed after the map task.
MapReduce Architecure:
ISSN(Online): 2320-9801
ISSN (Print) : 2320-9798
I
nternational
J
ournal of
I
nnovative
R
esearch in
C
omputer
and
C
ommunication
E
ngineering
(An ISO 3297: 2007 Certified Organization)
Vol. 3, Issue 9, September 2015
Advantages of Hadoop
The advantages of Hadoop over other analytics tools which make me consider it in this finding are given bellow:
Scalable – New nodes can be added without needing to change data formats.
Cost Effective – Hadoop brings massively parallel computing to commodity hardware.
Flexible – Hadoop is schema-less, and can absorb any type of data, structured or not, from any number of
sources.
Fault Tolerant – When you lose a node, the system redirects work to another location of the data and continues
processing without missing a heartbeat.
It’s free! (Open source).
III.CONCLUSION
The current generation has witnessed a very huge data generation in few years due to advancement in technology and social media. The amount of data being generated is ever-increasing every second today. Huge amount of data is generated from diverse sources. The real value of these generated data lies in it analytics. The data needs to be analyzed in other to uncover the hidden meaning for decisions to be taken. Data is useless without analytics. Currently, Hadoop is currently the most powerful analytics tool for big data analytics due to it good and encouraging features.
REFERENCES
1. Chen, H., Chiang, R. H. L., & Storey, V. C. (2012). Business Intelligence and Analytics: From Big Data to Big Impact. MIS Quarterly, 36(4), 1165–1188.
2. Cloud Security Alliance (2013), Big Data working group, Big Data Analytics for Security Intelligence.
3. IMIA and Scattaur GmbH (2014, Big Data in Science and Healthcare: A Review of Recent Literature and Perspective
4. Whittemore A. (2013), Improving Health Systems with Big Data. Big Data Biomedicine conference, Stanford School of Medicine 5. Russom, P. (2011). TDWI Best Practices Report: Big Data Analytics (Best Practices) (pp. 1–35). The Data Warehouse Institute
(TDWI). Retrieved from http://tdwi.org/research/2011/09/best-practices-report-q4-big-data nalytics.aspx?tc=page.
6. Siemens, G., & Long, P. (2011). Penetrating the Fog: Analytics in Learning and Education. EDUCAUSE Review, 46(5), 30–32.
7. Eric Schmidt of Google (2010), Big Data: Using Smart Big Data Analytics and Metrics to make Better Decisions and improve Performance.