ABSTRACT
BAUCOM, JARED NEWTON. Initiation and Evolution of Dynamic Failure Mechanisms in Woven Composite Systems. (Under direction of Professor M. A. Zikry)
The unique reinforcement geometry of three-dimensional orthogonally woven fabric-reinforced composites offers the potential of significantly improved penetration resistance and damage tolerance, in comparison with other composite systems, for a myriad of civilian and military applications at different velocity regimes. However, there has been a lack of understanding and quantification of how energy dissipation, momentum, and failure modes are affected by fiber orientation and distribution, as well as by loading rates that span the quasi-static to the high-velocity regimes. The major objective of this experimental investigation is to obtain a detailed understanding and characterization of damage progression in woven composite panels under transverse impact at three different velocity regimes: quasi-static (10-80 µm/s), low velocity (1-5
m/s), and high velocity (200-500 m/s). The broad classes of glass-fiber-reinforced composite systems that were investigated included two-dimensional plain woven laminates, three-dimensional orthogonally woven monoliths, and three-dimensional orthogonally woven laminates. The unique fabric structure of the three-dimensional orthogonal weave has also been utilized with a recently developed matrix-cellularization processing technique and to investigate how pore formation can be tailored for enhanced energy absorption and crack deflection of carbon-fiber-reinforced cellular-matrix-epoxy composites for quasi-static three-point bending and ballistic impact loading conditions.
dimensional laminates were found to require a higher maximum punch force and absorbed more energy than the two-dimensional laminates and three-dimensional monolithic woven systems.
Low-velocity impact damage progression was investigated by the use of an instrumented drop-weight impactor. Measurements were obtained for impact force and energy dissipation for repeated strikes. The radial spread of damage was smallest for the two-dimensional laminates and largest for the three-dimensional woven composites. The three-dimensional composites had the greatest resistance to penetration and dissipated more total energy than the other systems.
A powder gun was used for the high-velocity experiments to determine energy absorption, to provide approximate ballistic limit, and to identify and characterize failure modes of two-dimensional and three-dimensional composite systems subjected to ballistic impact. The energy absorption was comparable for the two-dimensional and three-dimensional woven composite systems. However, the damage was much more localized for the two-dimensional woven system, which suggests that this system may be more damage-tolerant than the three-dimensional woven systems but less resistant to perforation than the three-dimensional laminate.
by
JARED NEWTON BAUCOM
A thesis submitted to the Graduate Faculty of North Carolina State University In partial fulfillment of the Degree of
Doctor of Philosophy
MECHANICAL ENGINEERING
Raleigh 2002
APPROVED BY:
_________________________________ _________________________________
_________________________________ _________________________________
ABOUT THE AUTHOR
The ideas and assistance of colleagues are greatly appreciated. Many people deserve mention, but two stand out above the rest: Dr. Waeil Ashmawi and Rolin Barrett, Jr., P.E. Dr. Ashmawi has been an endless source of encouragement and advice. Mr. Barrett has contributed an extensive knowledge of interior and exterior ballistics, many insights into electrical circuit design, and photographic expertise.
Dr. Wei Xu provided the samples, 3-point bending data, photographs and SEM micrographs of the carbon/epoxy composites. The E-glass and S2-glass composite systems were provided on behalf of 3TEX by Dr. James Singletary. His cooperative concern to provide materials meeting the requirements of this work is deeply appreciated.
The efficient assistance of Roberto Garcia and Rich Fiore of the NCSU Analytical Instrumentation Facility is gratefully acknowledged. Their help with sample preparation and ESEM operation both accelerated and economized the micrographic characterization. The staff of the MAE Machine Shop (Rufus ‘Skip’ Richardson and Mike Breedlove) is greatly appreciated for its skill and experience. They produced all of the projectiles, most of the newly designed machine elements, and occasionally dissected material samples.
This work was supported under ARO MURI, DAAH-04-96-0018 for Functionally Tailored Textile Systems. That support is gratefully acknowledged.
LIST OF TABLES... viii
LIST OF FIGURES. ... ix
1. INTRODUCTION ...1
1.1 3D Cellular-Matrix Composite Systems...3
1.2 Quasi-Static Perforation of 2D and 3D Composite Systems ...5
1.3 Low-Velocity Impact Damage Progression...6
1.4 High-Velocity Impact and Perforation...7
2. 3D CELLULAR-MATRIX COMPOSITE SYSTEMS ...9
2.1 Material Preparation and Fabrication...9
2.2 Experimental Procedures ...11
2.2.1 Quasi-Static Three-Point Bending Experiments...11
2.2.2 Dynamic Experiments...12
2.3 Results and Discussion ...14
2.3.1 Quasi-Static Results...14
2.3.2 Dynamic Results ...15
2.4 Conclusions...17
3. QUASI-STATIC PERFORATION OF 2D AND 3D COMPOSITE SYSTEMS ...31
3.1 Material Preparation and Fabrication...32
3.1.1 Fabric Architectures...32
3.1.2 Constituent Materials ...33
3.2 Experimental Procedures ...34
3.3 Results and Discussion. ...35
3.4 Conclusions...42
3.5 Figures (Chapter 3) ...43
4. LOW-VELOCITY IMPACT DAMAGE PROGRESSION ...76
4.1 Material Preparation and Fabrication...76
4.1.1 E-Glass Systems...76
4.1.2 S2-Glass Systems...78
4.2 Experimental Procedures ...79
4.3 Results and Discussion: E-Glass Systems ...82
4.4 Results and Discussion: S2-Glass Systems...86
4.5 Conclusions...89
4.5 Figures (Chapter 4) ...91
5. HIGH-VELOCITY IMPACT AND PERFORATION...118
5.1 Material Preparation and Fabrication...118
5.5 Figures (Chapter 5). ...127
6. SUMMARY...146
6.1 Failure Mechanisms ...146
6.2 Energy Dissipation...147
6.3 Damage Progression ...147
6.4 Conclusion ...148
6.5 Figures (Chapter 6). ...151
7. RECOMMENDATIONS FOR FUTURE STUDIES ...153
LIST OF TABLES
Table 2.1 Carbon-Fiber/Epoxy Cellular- and Resin-Matrix Composite
Systems ...11 Table 2.2 Three-Point Bending, Average Results...17 Table 3.1 S2-Glass/Rubber-Toughened-Epoxy-Vinyl-Ester
Composites Systems for Quasi-Static Puncture...34 Table 3.2 Post-Contact Penetrator Displacement at Transition Points
of Quasi-Static Load-Displacement Curves, Corresponding
to Captured Frames from Digital Video ...37 Table 3.3 Peak Force and Work of Perforation, Average Values for
Each Material System ...38 Table 4.1 E-Glass/Vinyl-Ester Composite Systems for Low-Velocity
Impact and Perforation...77 Table 4.2 S2-Glass/Rubber-Toughened-Epoxy-Vinyl-Ester
Composite Systems for Low-Velocity Impact and
Perforation ...78 Table 5.1 S2-Glass/Rubber-Toughened-Epoxy-Vinyl-Ester
Composite Systems for High-Velocity Impact and
Perforation ...120 Table 5.2 Striking Velocity, Residual Velocity, and Energy
Figure 2.1 Three-Dimensional Orthogonal Weave ...21
Figure 2.2 Resin-Matrix Composite...22
Figure 2.3 Cellular Matrix Composite ...22
Figure 2.4 19-mm Powder-Charge Accelerator ...23
Figure 2.5 Flat-Nose Steel 19-mm Projectile (77.8 g) ...23
Figure 2.6 Measurement of Impact Velocity by Velocity-Pin Switches...24
Figure 2.7 Measurement of Residual Velocity by Coil-Type Inductors ...24
Figure 2.8 Target Holder for 19-mm Accelerator ...25
Figure 2.9 Three-Point Bend for Resin-Matrix Composites ...26
Figure 2.10 Three-Point Bend for Cellular-Matrix Composites ...26
Figure 2.11 Post-Perforation Photographs: Left - Resin-Matrix Composite (Rear Face), Right - Cellular-Matrix Composite (Impacted Face) ...27
Figure 2.12 Perforated Resin-Matrix Composite ...28
Figure 2.13 Perforated Cellular Matrix Composite...28
Figure 2.14 Absorbed Energy: Fiber Volume (f) and Porosity Effects...29
Figure 2.15 Normalized Energy Absorption ...29
Figure 2.16 Absorbed Energy as a Function of Areal Density ...30
Figure 3.2 Thick S2-Glass Fabric Architectures: (a) 12-Ply 2D Laminate (2D-S-24x12, 9.77 kg/m2), (b) 3-Ply Laminate (3D-S-93x3, 9.46 kg/m2) of 3D Orthogonally Woven Monoliths (c) 3D Orthogonally Woven Monolith
(3D-S-270, 9.15 kg/m2)...44
Figure 3.3 Displacement-Controlled Quasi-Static Transverse Puncture (INSTRON 4400R)...45
Figure 3.4 Perforator for Quasi-Static Puncture...46
Figure 3.5 Target Fixture for Quasi-Static Puncture...47
Figure 3.6 Perforating Load as a Function of Tup Displacement ...48
Figure 3.7 Perforating Load-Displacement for Thin 2D Laminates (2D-S-24x4) and 3D Monoliths (3D-S-93) at Two Rates of Loading: 10 and 80 µm/s ...49
Figure 3.8 Perforating Load-Displacement for Thick 2D Laminates (2D-S-24x12) at Two Rates of Loading: 40 and 80 µm/s...50
Figure 3.9 Perforating Load-Displacement for Thick 3D Monoliths (3D-S-270) at Two Rates of Loading: 40 and 80 µm/s...51
Figure 3.10 Perforating Load-Displacement for Thick 3-Ply 3D Laminates (3D-S-93x3) at Two Rates of Loading: 40 and 80 µm/s ...52
Figure 3.11 Stages of Quasi-Static Punch Loading and Perforation Failure ...53
Figure 3.12 Representative Video Frames Captured during Quasi-Static Perforation of 2D-S-24x12-2, Near Transition Points ...54
Figure 3.13 Representative Video Frames Captured during Quasi-Static Perforation of 3D-S-270-3, Near Transition Points ...55
Figure 3.14 Representative Video Frames Captured during Quasi-Static Perforation of 3D-S-93x3-3, Near Transition Points ...56
Figure 3.17 Work of Quasi-Static Perforation, Normalized by Target
Areal Density ...58
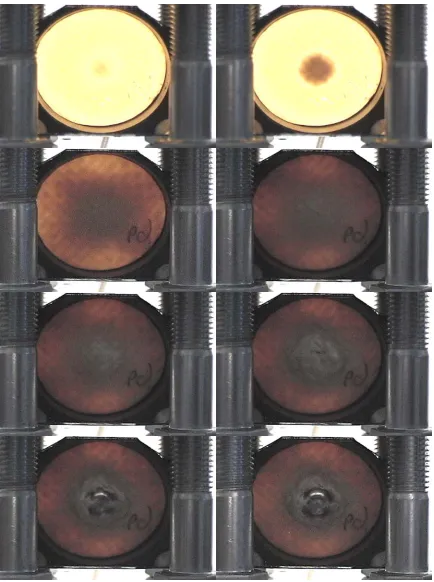
Figure 3.18 Post-Mortem Photographs of 2D-S-24x4-2: (a) Front Face, (b) Rear Face, (c) Rear Face under Back-Lighting...59
Figure 3.19 Closer Views of Front Target Face (2D-S-24x4-2) ...60
Figure 3.20 Closer Views of Rear Target Face (2D-S-24x4-2)...61
Figure 3.21 Post-Mortem Photographs of 3D-S-93-1: (a) Front Face, (b) Rear Face, (c) Rear Face under Back-Lighting...62
Figure 3.22 Closer Views of Front Target Face (3D-S-93-1) ...63
Figure 3.23 Closer Views of Rear Target Face (3D-S-93-1) ...64
Figure 3.24 Post-Mortem Photographs of 2D-S-24x12-1: (a) Front Face, (b) Rear Face, (c) Rear Face under Back-Lighting ...65
Figure 3.25 Closer Views of Front Target Face (2D-S-24x12-1)...66
Figure 3.26 Closer Views of Rear Target Face (2D-S-24x12-1)...67
Figure 3.27 Post-Mortem Photographs of 3D-S-270-2: (a) Front Face, (b) Rear Face, (c) Rear Face under Back-Lighting...68
Figure 3.28 Closer Views of Front Target Face (3D-S-270-2) ...69
Figure 3.29 Closer Views of Rear Target Face (3D-S-270-2) ...70
Figure 3.30 Post-Mortem SEM (3D-S-270) ...71
Figure 3.31 Post-Mortem Photographs of 3D-S-93x3-2: (a) Front Face, (b) Rear Face, (c) Rear Face under Back-Lighting...72
Figure 3.32 Closer Views of Front Target Face (3D-S-93x3-2)...73
Figure 3.33 Closer Views of Rear Target Face (3D-S-93x3-2)...74
Figure 4.1 Surface Crimp of z-Tows in 3D Orthogonally Woven
Preforms...92 Figure 4.2 Instrumented Drop-Weight Impactor...92 Figure 4.3 Representative Impactor Height History for E-Glass
Composite Systems (Sample: 3D-E-96-1)...93 Figure 4.4 Representative Impactor Acceleration History for E-Glass
Composite Systems (Sample: 3D-E-96-1)...93 Figure 4.5 Peak Impact Force of E-Glass Composite Systems as a
Function of Strike Number ...94 Figure 4.6 Energy Dissipation of E-Glass Composite Systems as a
Function of Strike Number ...94 Figure 4.7 Cumulative Energy Dissipation Resulting in Perforation of
E-Glass Composite Systems ...95 Figure 4.8 Post-Perforation Photographs of E-Glass Systems, Rear
Target Faces: 2D-E-24x4 (Left), BRWK (Center),
3D-E-96 (Right) ...95
Figure 4.9 Post-Perforation Photographs of the 2D Plain Woven
Laminate (Sample: 2D-E-24x4-1)...96 Figure 4.10 Post-Perforation Photographs of the Biaxially Reinforced
Warp-Knit (Sample: BRWK-1) ...96 Figure 4.11 Post-Perforation Photographs of the 3D Orthogonally
Woven System (Sample: 3D-E-96-1) ...96 Figure 4.12 Representative Impactor Height History for S2-Glass
Composite Systems (Sample: 2D-S-24x4-1) ...97 Figure 4.13 Representative Impactor Acceleration History for S2-Glass
Composite Systems (Sample: 2D-S-24x4-1) ...97 Figure 4.14 Peak Impact Force of S2-Glass Composite Systems as a
Figure 4.16 Cumulative Energy Dissipation Resulting in Perforation of
S2-Glass Composite Systems ...99 Figure 4.17 Sub-Perforation (1 Strike) Photography of 2D-S-24x4-3:
(a) Front Face, (b) Rear Face, (c) Rear Face under
Back-Lighting...100 Figure 4.18 Closer Views of Front Target Face (2D-S-24x4-3)...101 Figure 4.19 Scanning Electron Micrographs Showing Surface Damage
on Front Target Face near Impact Site (2D-S-24x4-3) ...102 Figure 4.20 Closer Views of Rear Target Face (2D-S-24x4-3)...103 Figure 4.21 Sub-Perforation (5 Strikes) Photography of 2D-S-24x4-4:
(a) Front Face, (b) Rear Face, (c) Rear Face, Oblique...104 Figure 4.22 Scanning Electron Micrographs Showing Surface Damage
on Rear Target Face near Impact Site (2D-S-24x4-4) ...105 Figure 4.23 Post-Perforation (23 Strikes) Photography of 2D-S-24x4-6:
(a) Front Face, (b) Rear Face, (c) Rear Face under
Back-Lighting...106 Figure 4.24 Closer Views of Front Target Face (2D-S-24x4-6)...107 Figure 4.25 Closer Views of Rear Target Face (2D-S-24x4-6)...108 Figure 4.26 Sub-Perforation (1 Strike) Photography of 3D-S-93-3:
(a) Front Face, (b) Rear Face, (c) Rear Face under
Back-Lighting...109 Figure 4.27 Closer Views of Front Target Face (3D-S-93-3) ...110 Figure 4.28 Closer Views of Rear Target Face (3D-S-93-3) ...111 Figure 4.29 Scanning Electron Micrographs Showing Surface Damage
on Front Target Face near Impact Site (3D-S-93-3): Damaged z-Crimp (Top), Closer View of Left Edge
Figure 4.30 Scanning Electron Micrographs Showing Internal Integrity near Impact Site (3D-S-93-3): (a) Sections of z-Tow and
Weft Tows, (b) Sections of Warp and Weft Tows...113 Figure 4.31 Sub-Perforation (5 Strikes) Photography of 3D-S-93-4:
(a) Front Face, (b) Rear Face, (c) Rear Face, Oblique...114 Figure 4.32 Post-Mortem Photography (39 Strikes) of 3D-S-93-7:
(a) Front Face, (b) Rear Face, (c) Rear Face under
Back-Lighting...115 Figure 4.33 Closer Views of Front Target Face (3D-S-93-7) ...116 Figure 4.34 Closer Views of Rear Target Face (3D-S-93-7) ...117 Figure 5.1 19-mm Hemispherical-Nose Steel Projectile, 55.6 g (design
by Rolin F. Barrett, Jr.) ...128 Figure 5.2 Post-Mortem Photography of 3D-S-270-4 (154-m/s
Striking Velocity): (a) Front Face, (b) Rear Face ...129 Figure 5.3 Closer Views of Front Target Face (3D-S-270-4) ...130 Figure 5.4 Post-Mortem SEM (3D-S-270-4)...131 Figure 5.5 Post-Mortem Photography of 3D-S-270-5 (216-m/s
Striking Velocity): (a) Front Face, (b) Rear Face ...132 Figure 5.6 Oblique Views of 3D-S-270-5: (a) Front Face, (b) Rear
Face ...133 Figure 5.7 Closer Views of Rear Target Face (3D-S-270-5) ...134 Figure 5.8 Post-Mortem Photography of 3D-S-270-6 (525-m/s
Striking Velocity): (a) Front Face, (b) Rear Face, (c) Rear
Face, Oblique ...135 Figure 5.9 Post-Mortem Photography of 2D-S-24x12-4 (155-m/s
Striking Velocity): (a) Front Face, (b) Rear Face, (c) Rear
Face, Oblique ...136 Figure 5.10 Post-Mortem Photography of 2D-S-24x12-5 (233-m/s
Face, Oblique ...138 Figure 5.12 Post-Mortem Photography of 3D-S-93x3-4 (152-m/s
Striking Velocity): (a) Front Face, (b) Rear Face, (c) Rear
Face, Oblique ...139 Figure 5.13 Post-Mortem Photography of 3D-S-93x3-5 (227-m/s
Striking Velocity): (a) Front Face, (b) Rear Face ...140 Figure 5.14 Oblique Views of 3D-S-93x3-5: (a) Front Face, (b) Rear
Face ...141 Figure 5.15 Closer Views of Rear Target Face (3D-S-93x3-5)...142 Figure 5.16 Post-Mortem Photography of 3D-S-93x3-6 (508-m/s
Striking Velocity): (a) Front Face, (b) Rear Face ...143 Figure 5.17 Oblique Views of 3D-S-93x3-6: (a) Front Face, (b) Rear
Face, (c) Rear Face, Oblique...144 Figure 5.18 Closer View of Rear Target Face (3D-S-93x3-6) ...145 Figure 6.1 Damage Mechanisms, Unique to 3D Orthogonally Woven
Composites, Evident over a Wide Range of Penetration
1. INTRODUCTION
Advances in composite processing and fiber design have resulted in new
applications for lightweight and high strength composite material systems (Seale et al.
1994; Cheremisinoff and Cheremisinoff 1995). Recently, fiber-reinforced systems have
been found to be uniquely suited for use in certain smart material applications (Sirkis and
Chang 1998; Anastasi and Lopatin 2001; Childers et al. 2001). General overviews of the
current state of manufacturing and application of composite systems are available
(Bogdanovich and Sierakowski 1999). As limits are reached in the specific strength and
moduli of fibers and matrix materials, there is a need to understand how fabric
architectures affect the behavior of composites such that optimal arrangements can be
designed and utilized for specific applications. This investigation focuses on the
characterization of damage initiation and progression in 2D and 3D composite panels
subjected to transverse impact and perforation at various velocity regimes.
There are three basic configurations of reinforcement by continuous fibers:
unidirectional reinforcement, two-dimensional fabrics, and three-dimensional fabrics
(Cox and Flanagan 1997). Frequently, these basic architectures are stacked and then
consolidated to form composite laminates. Laminates whose individual laminae are
reinforced unidirectionally, so-called uniweaves, have been studied extensively and
continue to be the subject of much investigation (Sun and Potti 1996; Schoeppner and
(e.g., plain weave, satin weave, twill, 2D braid, etc.), but they share the common
characteristic of fiber interlacing and undulation. These materials have also received
much attention and continue to do so (O'Donnell 1993; Cunniff 1996; Davies et al. 1996;
Chocron-Benloulo et al. 1997; Espinosa et al. 2000; Gellert et al. 2000; Azouaoui et al.
2001; Khan et al. 2001, accepted for publication). Examples of three-dimensional fabrics
include stitched laminates, 3D orthogonal weaves, 3D braids, and angle-interlock weaves.
Of the three basic architectures, 3D fabrics and composites have received the least
attention (Cox 1995; Jenq and Mo 1996; Jenq et al. 1998; Kuo and Lee 1999; Singletary
and Bogdanovich 2000; Xu 2000; Allix 2001; Qiu et al. 2001). In particular, the
mechanisms of damage and energy transfer for these materials and their dependence upon
striking velocity and energy have not been fully characterized. Moreover, little or no
work has been done to examine the behavior of 3D laminates in comparison with 3D
monolithic architectures.
The ultimate goal of this work is to provide new information about the behavior
of fiber-reinforced composite materials under high rates of loading. It is hoped that the
information will lead to the development of more efficient designs of structures and
lightweight armor employing composite materials. The remainder of the first chapter
includes an overview of the related work of other researchers, as well as a more detailed
1.1 3D Cellular-Matrix Composites
Macroporous polymeric materials are used in applications such as ion exchange,
chromatographic separation, catalysis, and adsorption (Peters et al. 1997). However,
porosity induced during the manufacture or repair of composite structures and
components is generally viewed as a defect that can result in degraded material response
(Guo and Cawley 1994). Significant reductions in elastic moduli and interlaminar shear
strength due to matrix porosity have been observed by several investigators, including
(Daniel et al. 1992; Mouritz and Hutchings 1992; Peters et al. 1995). However, if
porosity can be controlled in such a way as to significantly improve the quasi-static and
ballistic performance of composite systems, then the total weight of the system can be
reduced, a highly desirable characteristic of structural systems that are needed for
high-strength and resilient applications.
The exploration of the control of porosity in polymeric matrix composites has
mainly emphasized the detection and minimization of porosity (Daniel et al. 1992; Guo
and Cawley 1994). Mouritz and Hutchings (Mouritz and Hutchings 1992) induced
porosity in silica-filled epoxy resins by the addition of glass microspheres, which resulted
in a decrease in compressive strength. The low velocity perforation behavior of
composite sandwich panels has been investigated (Mines et al. 1998), with a core
material composed of resin-impregnated non-woven polyester felt with 50%
microspheres, analogous to the creation of a highly porous central section. Peters et al.
fibers within the composite preform. In that study, the presence of porosity appeared to
have a small effect on the tensile modulus, but the transverse shear and compressive
moduli were severely reduced.
The chief modes of failure of fiber-reinforced polymeric matrix composites
subjected to ballistic impact include fiber breakage, matrix cracking, fiber debonding,
delamination, and shear plugging (Backman and Goldsmith 1978; Cunniff 1992; Cunniff
1996; Jenq and Mo 1996; Ellis et al. 1998; Jenq et al. 1998; Kumar and Bhat 1998;
Walsh et al. 1998; Flanagan et al. 1999). Although porosity has been observed to
promote delamination (Daniel et al. 1992), the role of porosity in fiber breakage and
matrix cracking has not been well understood or characterized. Porosity may inhibit or
deflect crack propagation through the matrix, and it may allow fibers to bear the load in
tension rather than in shear. Several researchers (Cunniff 1992; Walsh et al. 1998) have
observed a greater energy absorption capacity of fibers subjected to tension as compared
with fibers subjected to shear.
The objective of the investigation of cellular-matrix composite systems is to
examine the effects of induced porosity on the mechanical response of 3D woven
carbon-fiber reinforced epoxy matrix composite panels subjected to quasi-static and dynamic
loading conditions. Dynamic impact experiments for projectile velocities in the range
from 100 to 200 m/s are used to determine material response as a function of absorbed
1.2 Quasi-Static Perforation of 2D and 3D Composite Systems
The quasi-static loading of fiber-reinforced plastics is a common investigative
tool. The large temporal scale permits easy viewing and measurement of material
response under a wide range of loading conditions, including three-point bending
(Baucom et al. 2000; Qiu et al. 2001), in-plane loading (Zhu et al. 1992; Evans and Zok
1994; Kammerer and Neme 1998; Kuo and Lee 1999), and transverse puncture (Lee and
Zahuta 1991; Zhu et al. 1992; Lee and Sun 1993; Portanova 1995; Jenq and Mo 1996;
Sun and Potti 1996; Jenq et al. 1998; Mines et al. 1998; Walsh et al. 1998; Ying 1998;
Mines et al. 1999). Quasi-static perforation data have also been used to model and
predict material behavior under dynamic impact (Taylor and Vinson 1990; Jenq and Mo
1996; Jenq et al. 1998).
The objectives of this part of the investigation include the measurement of the
requisite force, energy, and transverse displacement for the quasi-static perforation of
glass-fiber-reinforced plastic (GFRP) composite panels. Glass-fiber reinforced plastic
composites have been highly desirable engineering materials, due to their high resistance
to corrosion, ability to withstand relatively high temperatures, high specific strength,
good machineability, and relatively low cost. Many GFRP composites, including the
material systems examined here, are translucent when properly consolidated. Hence,
damaged regions of impacted samples become opaque, and internal damage can be
visually identified. This property is exploited to provide a visual record of damage
energies and damage mechanisms under low- and high-velocity impact.
1.3 Low-Velocity Impact Damage Progression
Low-velocity impact of fiber-reinforced plastics has been the subject of many
experimental and analytical investigations (Bogdanovich and Friedrich 1994; Shen 1997;
Naik and Sekher 1998). This type of loading occurs when tools are dropped onto the
surface of a composite structure or from the impact of debris, fragments, or projectiles.
Experiments can provide quantitative insights and measurements of damage progression
of material systems at higher loading rates (Baucom et al. 2000). Some investigators
have used compression-after-impact and other static tests to obtain measures of damage
tolerance and residual strength after low-velocity impact (Cantwell et al. 1983; Liu et al.
1998; Mahfuz et al. 1998; Zhou 1998).
By subjecting specimens to multiple instrumented impacts, residual strength and
damage progression can be monitored, as well. In a study of the response of stitched and
unstitched E-glass/epoxy laminates subjected to transverse impact (Wu and Wang 1995),
specimens were impacted multiple times to examine the growth of damage, including
delamination and transverse cracking.
The purpose of the present low-velocity impact study is to examine the
progression of damage and capacity for energy-absorption of 2D and 3D woven
composite systems subjected to multiple impacts, until the occurrence of complete
to determine material response as a function of absorbed energy, areal density, and fabric
architecture. Damage progression is assessed by post-mortem photography, scanning
electron microscopy, and the evolution of contact force.
1.4 High-Velocity Impact and Perforation
For obvious reasons, high-velocity impact on structures and armor systems is a
vital concern. This type of loading can be the result of impact by aircraft runway debris,
small arms fire, flak and other fragmentation explosives, projectiles driven by high
winds, and so on. As new material systems have been developed, the subject of the
ballistic response of fabrics and composites has continued to provide fertile ground for
research (Vinson and Zukas 1975; Taylor and Vinson 1990; Cunniff 1992; Cate 1993;
Zee and Hsieh 1993; Bodner and Rajendran 1997; Vinson and Walker 1997; Gellert et al.
1998; Kumar and Bhat 1998; Navarro 1998; Baucom 1999; Mines et al. 1999; Mahfuz et
al. 2000; Singletary and Bogdanovich 2000; Mouritz 2001; Okafor et al. 2001; Fujii et al.
2001, article accepted for publication; Tarim et al. 2002).
Examining the effects of reinforcement geometry on the ballistic response of
composite laminates and fabrics, some researchers have compared and contrasted
uniweave fabrics and laminates against 2D-plain-weave fabrics and laminates (Mines et
al. 1999; Morye et al. 2000; Fujii et al. 2001, article accepted for publication). Others
have looked at the effects of 3D braiding or stitching (Flanagan et al. 1999; Mines et al.
compared (Balasundharam 1999).
For this investigation, ballistic impact experiments are conducted on 2D
plain-weave laminates and 3D orthogonal-plain-weave laminates and monoliths to determine the
dynamic material response and to characterize and compare damage mechanisms as
functions of absorbed energy, impact velocity, and fabric architecture. The projectile and
target-holder have been designed to provide a boundary condition and impactor geometry
that are comparable to those of the quasi-static and low-velocity experiments mentioned
2. 3D CELLULAR-MATRIX COMPOSITE SYSTEMS
The objective of this investigation is to examine the effects of induced porosity on
the mechanical response of 3D woven carbon-fiber reinforced epoxy matrix composite
panels subjected to quasi-static and dynamic loading conditions. Porous samples were
synthesized by a new foaming technique that is specialized to three-dimensionally woven
composites. Three-point bending experiments were used to determine strength and
flexural resistance under quasi-static loading conditions. Dynamic impact experiments
for projectile velocities in the range from 100 to 200 m/s were used to determine material
response as a function of absorbed energy, areal density, and perforation resistance. This
chapter is organized as follows: the details of the foaming process and sample preparation
are given in Section 2.1, a description of the experimental procedures in Section 2.2, a
discussion of the results in Section 2.3, and concluding remarks in Section 2.4.
2.1 Material Preparation and Fabrication
Porosity may be induced in epoxy matrix composites by a method of controlled
nitrogen pressurization. This method was developed by Qiu et al. (Qiu et al. 2001) to
reduce the density of 3D woven composites and to fabricate 3D fiber-reinforced cellular
polymer matrix composites (3DCPMC). A schematic of the fiber preform is shown in
Figure 2.1. An environmental scanning electron microscope (ESEM) micrograph of a
woven carbon fiber preforms with epoxy resin and then pressurizing the system with
nitrogen gas. After three hours of gas saturation, the temperature was elevated until the
resin had cross-linked to a desired stiffness. The gas pressure was then released to induce
cells (material voids) of various sizes. Cell nucleation and growth were triggered by the
sudden quenching of the applied pressure at specific time intervals. Through careful
control of process variables, a reduction in density by approximately 30% (1.0 g/cm3)
was attained.
Four types of sample materials were produced, as shown in Table 2.1. Samples of
similar areal density, but different fabric preforms, were made both with and without the
pore-induction technique. This variation and control of properties provided a framework
to understand and differentiate of the effects of fiber volume fraction and porosity on
Table 2.1 Carbon-Fiber/Epoxy Cellular- and Resin-Matrix Composite Systems
Sample Description
Fiber-Volume Fraction
Areal Density (kg/m2)
TM Low fiber-volume, cellular-matrix 0.41 4.3 TS High fiber-volume, cellular-matrix 0.46 4.8
TMR Low fiber-volume, resin-matrix 0.36 6.7
TSR High fiber-volume, resin-matrix 0.42 7.2
2.2 Experimental Procedures
The effects of porosity on the mechanical response of 3D woven fiber-reinforced
epoxy panels were investigated and characterized for quasi-static and dynamic loading
conditions. Quasi-static behavior was examined by three-point bending experiments,
such that maximum and failure loads could be determined for porous and non-porous 3D
woven composite systems. The energy absorption, dynamic response, and perforation
resistance of the composite systems were investigated for impact velocities of 120 and
220 m/s.
2.2.1 Quasi-Static Three-Point Bending Experiments
Flexural stiffness and strength were determined under three-point bending,
pursuant to ASTM standard D790-97. Six rectangular coupons, 13 mm x 200 mm, were
the material ruptured.
2.2.2 Dynamic Experiments
A 19-mm powder-charge accelerator (Figure 2.4) was used to examine the
perforation resistance of various composite systems at ballistic velocity regimes. The
gun was designed with a barrel length of 2.2 m, which can accelerate a variety of 19-mm
projectiles to velocities approaching 1 km/s. A flat-nose, cylindrical steel projectile
(Figure 2.5) with a mass of 77.8 g was designed for this series of experiments. The
projectile velocity was measured before and after perforation of the target, and the energy
absorbed by the target was calculated by a balance of the incident and residual kinetic
energy of an essentially rigid projectile. This experimental apparatus has been used
successfully by other investigators in the examination of various material systems,
including woven and braided composites (Flanagan 1997). The ability to measure the
residual velocity of the projectile permits an estimate of the absorbed energy of the target
at projectile speeds significantly above the ballistic limit. The understanding and
characterization of energy absorption and damage mechanisms, at impact speeds well
above the ballistic limit, can provide important insights into the performance of structural
composite systems (Cunniff 1992; Cunniff 1996; Schonberg 1998).
The impact velocity of the projectile, as well as its residual velocity, are measured
for each impact. The impact velocity is determined by monitoring the response of two
first switch, the projectile triggers an oscilloscope, which monitors the status (high or low
voltage) of the second switch (Figure 2.6). The velocity is inferred from the known
switch spacing and the measured time between closings of the switches. The residual
velocity of the projectile is measured with inductive coils (Figure 2.7). The ferritic steel
projectile passes through each coil, inducing a voltage as it passes. This residual velocity
sensor detects only the ferritic projectile, but it is unaffected by the debris of ejected
target material and the exhaust cloud of burned powder both ahead of and behind the
projectile. The target is clamped along a circular boundary (Figure 2.8), and the energy
absorbed by the target is estimated through a simple balance of translational kinetic
energy of the projectile,
(
2 2)
2 1 r i V V mE= − (2.1)
where E is the energy absorbed by the target, m is the mass of the projectile, Vi is the
incident projectile velocity, and Vr is the residual projectile velocity.
Each projectile is a right-circular cylinder with a diameter of 19 mm, 38-mm
length, and 78-g mass. Mild ferritic steel was chosen for its machineability, its relatively
high hardness, and its iron content, so that the residual-velocity sensor can detect it. In
the energy balance of Equation (2.1), the plastic work of projectile deformation is
neglected, since the projectiles are essentially rigid. The projectiles are placed in
diameter and 152-mm outer diameter, and tightened to prevent slippage. The target is
held at a fixed distance (90 mm) from the muzzle and normal to the line of trajectory of
the projectile. The frame of the target holder was designed to prevent rearward motion of
the grip.
2.3 Results and Discussion
Quasi-static three-point bending and dynamic impact experiments were used to
understand how the variation of porosity and fiber-volume fraction affect the material
response of 3D orthogonally woven composite systems as a function of different velocity
regimes and loading conditions.
2.3.1 Quasi-Static Results
Six samples of each type (Table 2.1) were subjected to quasi-static three-point
bending. The resulting load-deflection curves for the resin-matrix and cellular composite
systems with higher fiber-volume-fractions are shown in Figures 2.9 and 2.10. The
load-deflection curves for the porous and non-porous samples with the lower
fiber-volume-fraction were analogous in shape but with maximum loads of approximately one-half of
the maximum load corresponding to the high fiber-volume-fraction samples.
All three-point bending load-deflection curves exhibit an initial nonlinear loading
region through a deflection of about 0.5 mm. This is followed by a linear load path and
stiffness based upon the linear loading region, and the deflection at peak load is shown in
Table 2.2.
Beyond the peak load, the behavior of porous systems differs from that of
non-porous systems. In the case of non-non-porous systems, the peak load is followed by rupture
of the sample. For the porous systems, an abrupt drop follows the maximum load to a
value that is approximately 25% of the peak load. The load then increases in an
essentially linear fashion, at a lower rate than the first linear loading, until a second peak
value is reached. The second peak load is followed by rupture of the specimen.
These results indicate that porosity may mitigate damage progression by the pores
acting as sites that can deflect failure surface propagation with a strength that is
comparable to non-porous systems. Furthermore, as the results indicate, the porosity
results in a gradual unloading to rupture, which would be a desirable characteristic for an
indication and control of material failure.
2.3.2 Dynamic Results
Ballistic impact tests were conducted at two nominal velocities, 120 and 220 m/s,
for the four sample types listed in Table 2.1. As can be seen in the post-perforation
photographs of resin-matrix and cellular-matrix samples (Figure 2.11), the material
deformation and damage are confined to a much smaller area for the non-porous system.
In contrast, the cellular matrix systems had substantially more transverse deflection and
2.12 and 2.13, further indicate significant differences in the vicinity of the perforation
edge. The non-porous systems appear to have failed in a manner similar to
shear-plugging (Flanagan et al. 1999), with little damage beyond the edge of the hole.
However, the cellular matrix systems exhibited extensive debonding and relative motion
of fiber tows, resulting in greater dispersion of the impact energy over a larger area.
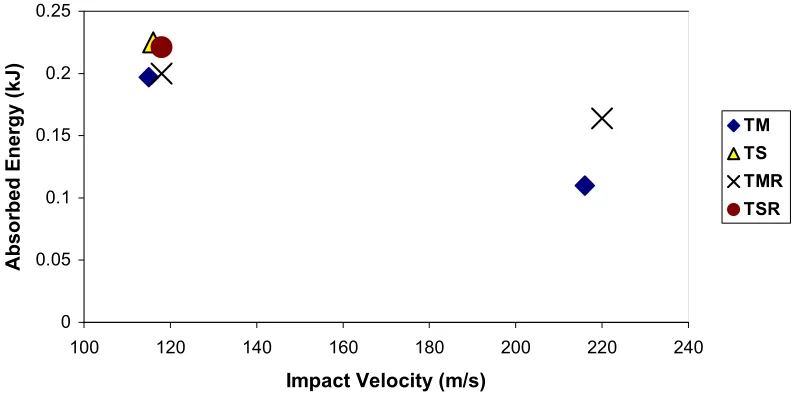
The energy absorbed by the target was calculated from Equation (2.1), based on
the incident and residual projectile velocities. A plot of the absorbed energy, as a
function of projectile velocity, is given in Figure 2.14. At lower velocities, both the
porous and non-porous samples with higher fiber volumes absorbed about 10% more
energy than the samples with lower fiber-volume fractions. Only the low fiber-volume
samples were tested at the higher velocity. At higher velocities, the samples with induced
porosity absorbed approximately 60% less energy than the non-porous samples. These
results indicate that higher fiber volume fractions and non-cellularization enhance
ballistic perforation resistance of composite materials.
However, if the absorbed energy is normalized by the areal density, material
response can be clearly delineated for a direct comparison between systems of different
areal densities. This would provide an indication of the relative performance of
composite systems of comparable areal densities. Figure 2.15 shows a plot of the
normalized absorbed energy as a function of projectile velocity. As these results indicate,
the impact response is segregated by porosity, not fiber-volume fraction. Per unit of areal
When the absorbed energy is plotted as a function of the target areal density
(Figure 2.16) the potential advantage of induced porosity becomes even more apparent.
The samples with induced porosity absorbed energy comparable to the non-porous
samples. These results suggest that it may be possible to substantially decrease the
weight of composite systems through the induction of porosity without degradation of
ballistic performance, if the fiber volume fraction is not below a critical threshold value.
Furthermore, the ESEM micrographs and post-mortem analysis indicate that the pores
can be sites for the dissipation of energy over a large area.
Table 2.2 Three-Point Bending, Average Results
Series Peak Load
(kN) Flexural Stiffness(kN/mm) Deflection at Initial Yield(mm)
TM 0.68 0.19 4.0
TS 0.74 0.27 3.2
TMR 1.2 0.20 6.4
TSR 1.5 0.32 5.2
2.4 Conclusions
Quasi-static and dynamic experiments were conducted to investigate how
porosity, fiber-volume fraction, absorbed energy, and strength affect the mechanical
weight reduction, while structural performance and durability are maintained and energy
is dissipated.
For quasi-static three-point bending, the pore sites may act as sites where the
failure surfaces are deflected and mitigated. The force unloading beyond the
post-maximum load behavior was gradual until rupture. In contrast, the non-porous samples’
behavior beyond the maximum load was abrupt and rupture occurred rapidly after the
maximum load. This further suggests that failure can be controlled in the porous samples
without significant strength differences between the porous and non-porous samples.
For dynamic loading conditions at different impact velocities, the normalization
of the absorbed energy by the areal density of the target provided a direct comparison of
the ballistic performance of panels with different areal densities. By normalizing the
absorbed energy, the sample response segregated by porosity and not by fiber volume
fraction. Per unit of areal density, the more highly porous samples absorbed more energy
than the non-porous materials. As in the three-point bending experiments, this may be
due to the deflection of transverse cracks by pores, thereby inhibiting and dissipating
failure under ballistic impact over large radial areas. Furthermore, a higher density of
matrix material in non-porous composites may serve to confine the damage area and,
hence, limit the energy absorption capacity of the material over small radial areas. The
weak interfaces between pores and the matrix material can act as failure surfaces that can
areal densities, but it also results in substantially different failure and dissipative energy
1 mm
Figure 2.2 Resin-Matrix Composite
Residual Velocity Measurement Target
Holder
0.9 m 2.2 m
Trigger or Laser-Based Target-Alignment/Orientation Housing
Impact Velocity Measurement
Figure 2.4 19-mm Powder-Charge Accelerator
-2.5E+07 -2.0E+07 -1.5E+07 -1.0E+07 -5.0E+06 -12 -10 -8 -6 -4 -2 0 Displacement (mm) Load/Area (Pa) -1.4E+07 -1.2E+07 -1.0E+07 -8.0E+06 -6.0E+06 -4.0E+06 -2.0E+06 0.0E+00 -10 -8 -6 -4 -2 0 Displacement (mm)
Load/Area (Pa) .
Figure 2.9 Three-Point Bend for Resin-Matrix Composites
1 mm
0 0.05 0.1 0.15 0.2 0.25
100 120 140 160 180 200 220 240
Impact Velocity (m/s)
Absorbed Energy (kJ)
TM TS TMR TSR
Figure 2.14 Absorbed Energy: Fiber Volume (f) and Porosity Effects
0 5 10 15 20 25 30 35 40 45 50
100 120 140 160 180 200 220 240
Impact Velocity (m/s)
Normalized Energy Absorption
(J m 2 /kg) TM TS TMR TSR
1 mm
0 0.05 0.1 0.15 0.2
4 4.5 5 5.5 6 6.5 7 7.5
Areal Density (kg/m2)
Absorbed Energy (kJ)
TM TS TMR TSR
3. QUASI-STATIC PERFORATION OF 2D AND 3D COMPOSITE SYSTEMS
This part of the investigation examines how the variation of fabric architecture in
composite systems with comparable areal densities affects perforation resistance,
strength, energy dissipation, and damage mechanisms of GFRP composite panels
subjected to quasi-static perforation, at velocities in the range from 10 to 80 µm/s. Five
woven architectures were chosen as the fabric preforms: two 2D plain-woven laminates,
two 3D orthogonally woven monoliths, and a 3-ply laminate of 3D orthogonally woven
laminae. The composite fibers were chosen as S2-glass, and a rubber-toughened
vinyl-ester/epoxy resin was selected for the matrix material. These materials were produced to
compare systems of similar areal-density and constituent material but varying
fiber-architecture (Table 3.1).
The 3D systems are orthogonally woven. For the 3D laminates (3D-S-93x3), two
through-the-thickness planes are introduced which break the z-reinforcement. These 3D
laminates also have three times the number of sites of crimp in the z-yarns. The
remainder of the chapter is organized as follows: the details of the material preparation
and fabrication are given in Section 3.1, a description of the experimental apparatus and
method is presented in Section 3.2, the results are discussed in Section 3.3, and
Five composite systems were examined, with different fabric architectures but
with comparable areal densities, fiber-volume fractions, and thicknesses. Glass-fiber
reinforced plastics have been widely accepted for use as engineering materials, due to
their superior properties and affordability. Many GFRP composites are translucent when
consolidated, but material damage, such as the separation of fibers and matrix material,
results in a reduction of the transmissivity of visible light. Hence, damaged interior
regions of impacted samples become opaque, and internal damage can be visually
identified under back-lighting (Baucom et al. 2001). This property is exploited to
provide a record of internal damage progression.
3.1.1 Fabric Architectures
Fabric preforms were selected to provide samples of various fabric architectures
but common areal density. The fabric architecture of the first system was a conventional
2D plain-woven laminate with 4 layers (2D-S-24x4). A similar, but thicker, 2D laminate
was produced with 12 layers of plain woven fabric (2D-S-24x12); this laminate may be
considered as the consolidation of 3 layers of 2D-S-24x4. The fabric preform of the next
material system was a monolithic 3D orthogonal weave (3D-S-93) of approximately the
same areal density as the 4-layer 2D laminate (Figure 3.1). Three layers of the 3D-S-93
preform were consolidated to yield the next material system (3D-S-93x3), a 3-layer
laminate of laminae with 3D orthogonally woven fabric reinforcement. The preform of
(3D-S-270), such that the total areal density was nearly the same as for systems 2D-S-24x12 and
3D-S-93x3 (Figure 3.2).
3.1.2 Constituent Materials
All composite systems were derived from S2-glass fiber rovings in a matrix of
Dow Derakane 8084 rubber-toughened epoxy/vinyl-ester. The fiber-volume-fraction
ranged from 0.49 to 0.58. Hence, this selection of material systems permitted an isolation
of the effects of fabric architecture, especially the effects of orthogonal z-reinforcement.
A listing of the material systems is provided in Table 3.1, including the composite areal
density, fiber-volume-fraction, and average measured thickness of each system. In Table
3.1, the fraction of fiber volume is estimated in the following manner:
nom f f t AD FVF ρ = (3.1)
where FVF is the estimated fiber-volume-fraction for a particular sample, ADf is the areal
density of the fabric reinforcement, ρf is the volumetric density of the fibers, and tnom is
the nominal thickness of the panel. Consolidation was achieved by vacuum-assisted
Composite System DesignationSample Areal Density(kg/m2)
Fiber Volume
Fraction Thickness(mm)
2D-S-24x4
(4-ply, 2D Laminate)
2D-S-24x4-1 2D-S-24x4-2 4.60 4.62 0.532 0.491 2.44 2.64 2D-S-24x12
(12-ply, 2D Laminate)
2D-S-24x12-1 2D-S-24x12-2 13.7 13.6 0.509 0.526 7.65 7.65 3D-S-93
(3D Monolith) 3D-S-93-1
4.41 0.556 2.26
3D-S-93x3
(3-Ply, 3D Laminate) 3D-S-93x3-13D-S-93x3-2 3D-S-93x3-3 13.2 13.3 12.7 0.519 0.517 0.536 7.26 7.29 7.04 3D-S-270 (3D Monolith) 3D-S-270-1 3D-S-270-2 3D-S-270-3 12.7 12.5 12.7 0.522 0.530 0.520 6.99 6.88 7.01
3.2 Experimental Procedures
An Instron 4400R universal testing machine (Figure 3.3) was used to subject the
composite samples to quasi-static transverse central puncture and to collect
load-deflection data. The crosshead was driven along one axis under displacement rate
control, and a 9.0-kN load cell was used to monitor the compressive force between the
cell data is used to generate load-displacement curves, yielding the total work of the
cross-head required for perforation of the panel.
A specialized penetrator (tup) and target fixture were designed to adapt the
universal testing machine for quasi-static perforation. The tup developed for these
experiments was a steel cylinder with a 19-mm diameter and a hemispherical nose
(Figure 3.4). This geometry was chosen for comparison of results obtained for other
quasi-static, low-velocity, and high-velocity impact and perforation in this report, as well
as from other studies (Cantwell et al. 1983; Jang et al. 1990; Jenq and Mo 1996; Jenq et
al. 1998; Liu et al. 2000). Square target panels (edge-lengths of 13 cm) were clamped
between steel plates with central circular apertures, 76.2 mm in diameter (Figure 3.5).
The clamps were supported by four 20-mm steel legs, which rested upon the load cell.
An angled mirror was placed in the open space between the legs of the target holder,
permitting a view suitable to capture video of the rear target-face. To provide
backlighting for the video, the tup was surrounded by a circular fluorescent light tube and
mounted to the crosshead. This arrangement provided a record of internal damage
initiation and progression throughout the quasi-static event.
3.3 Results And Discussion
Displacement-controlled quasi-static transverse puncture of 2D laminates, 3D
composite monoliths, and 3D laminates was performed while monitoring the puncture
velocity impacts.
The crosshead speed, rate of data sampling, and load history were used to derive a
load-deflection curve. The load-deflection curve was integrated from the point of
contact, until the moment of perforation, to yield the work required for the perforation of
the target as
∫
=f s
p Fds W
0
(3.2)
where Wp is the total work of perforation by the tup, F is the force measured by the load
cell, ds is the incremental displacement of the perforator, and sf is the displacement at
which perforation has been achieved. The condition, s = 0, corresponds to the moment at
which the penetrator contacts the target and was identified by the positive increase of
load-cell output.
When perforation occurs, the target continues to resist through frictional sliding of
the cylindrical penetrator which creates a widening hole in the target, and it is difficult to
determine the displacement corresponding to the onset of perforation. In this report, the
target was considered to be perforated when the post-contact displacement of the tup
reaches a value that is equal to the sum of the target thickness and the diameter, 19 mm,
of the hemispherical nose. This condition determined the integration limit, sf, in Equation
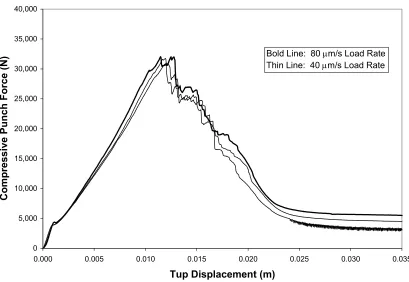
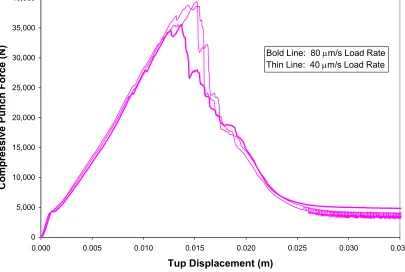
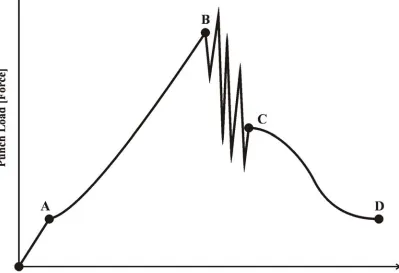
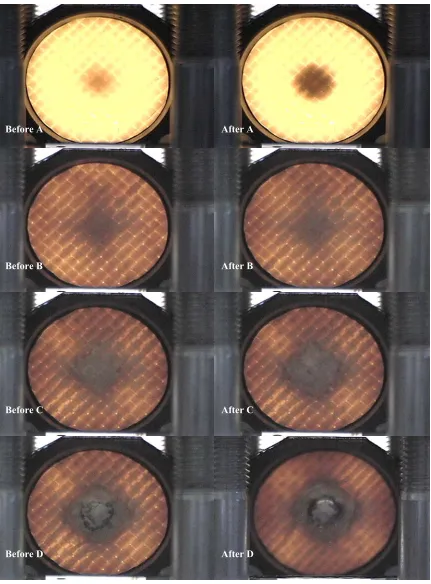
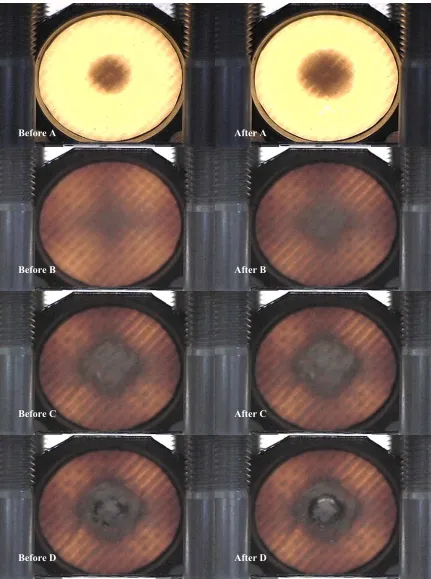
The punch load is plotted in Figures 3.6-10 as a function of tup displacement.
Certain general trends were observed, and a representative load-displacement curve was
developed (Figure 3.11). The curve is divided at four points, labeled A, B, C, and D.
The tup-displacements corresponding to these points of transition are listed in Table 3.2
for the experiments in which a video recording was made (Figures 3.12-14). Each video
was synchronized with the load-cell data through the audio track of the audio/video
recording, at the moment of contact. Frames of the video recording, captured in
proximity to each transition point, support the description of the general penetration
process for the composite systems under investigation.
Table 3.2 Post-Contact Penetrator Displacement at Transition Points of Quasi-Static Load-Displacement Curves
Specimen
Point A
(mm) B (mm) C (mm) D (mm) 2D-S-24x12-2 (2D Laminate)
1.27 10.25 15.75 30.32
3D-S-270-3
(3D Monolith)
1.23 10.42 17.28 30.57
3D-S-93x3-3
(3D Laminate)
internal damage, as indicated by the appearance of a dark spot under the point of contact.
The damaged area grows to reach the boundary, at which time a sudden increase in
damaged area is observed (point B). Point C marks the time at which the penetrator has
ruptured the panel and begins to appear, widening the rupture site as it continues.
Finally, point D marks the moment at which the passage of the shank has reached a
steady state.
Table 3.3 Peak Force and Work of Perforation, Average Values for Each Material System
Composite System Peak Force(kN)
Normalized Peak Force (kN ·m2/kg)
Perforation Work (J) Normalized Perforation Work (J ·m2/kg)
3D-S-93
(3D Monolith) 10.2 2.31 105 23.9
2D-S-24x4
(4-ply, 2D Laminate) 11.3 2.44 89.5 19.5
3D-S-270
(3D Monolith) 32.0 2.48 410 32.1
3D-S-24x12
(12-ply, 2D Laminate)
37.5 2.74 434 31.7
3D-S-93x3
(3-Ply, 3D Laminate)
As shown in Figures 3.6-10, the load-displacement curves were very repeatable.
Average values for peak force and punch work are listed in Table 3.3. Of the thin panels,
3D-S-93 and 2D-S-24x4, the peak punch force was 14% higher for the 2D laminate. The
peak force for the thick 2D and 3D laminates was about the same and exceeded the peak
of the 3D monolith by 16%. After normalizing these values by target areal density, the
peak force of the 3D laminate was highest, followed by the thick 2D laminate
(2D-S-24x12), the thick 3D monolith (3D-S-270), and then the thin panels. The normalized
punch force (Figure 3.16) was comparable for all systems, the highest and lowest peak
values differing by only 23%.
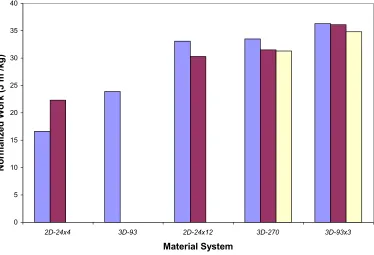
The work of perforation was calculated according to Equation 3.2 and is plotted in
Figure 3.15. Average values of the punch work are given in Table 3.3. For the thin
panels, the 3D system absorbed an average of 16% more energy than the 2D laminate.
For the thick panels, the 3D laminate absorbed the most energy (467 J), followed by the
2D laminate (434 J) and the 3D monolith (410 J). This trend is magnified when the
punch work is normalized by panel areal density (Figure 3.17).
Photography was used to identify and record post-perforation damage. Internal
damage was revealed under backlighting. Photographs of the thin 2D laminate
(2D-S-24x4) are shown in Figures 3.18-20. For this material system, the internal and external
appear to be delamination and fiber fracture.
Photographs of the thin 3D monolith (3D-S-93) are shown in Figures 3.21-23. As
in the case of the thin 2D laminate, the most heavily damaged region is in proximity to
the hole. The shape of this darkest region, however, is more rectangular (Figure 3.21c).
Fiber-debonding has occurred throughout the circular area exposed by the aperture of the
target clamp. In contrast with the 2D laminate, less damage appears to have occurred
along radial bands, in the warp and weft directions, intersecting the rupture site. On each
side these bands of minimal damage the rear-face weft has delaminated beyond the
boundary of the target clamp. Damage also has been clearly incurred by the surface
crimp of z-tows retaining the delaminated rear-face weft.
Photographs of the thick 2D laminate (2D-S-24x12) are shown in Figures 3.24-26.
Reflective lighting showed that surface damage had extended to the clamp boundary on
both sides of the panel (Figure 3.24a,b). However, backlighting revealed that internal
delamination had grown beyond the clamp boundary in the warp and weft directions
(Figure 3.24c). As in the case of the thin 2D laminate, an intensification of damage was
observed in a cross-shape pattern along warp and weft directions (Figure 3.25). Some
delamination was also evident at the edges of the panel (Figure 3.26).
Photographs of the thick 3D monolith (3D-S-270) are shown in Figures 3.27-29.
Similar to the thick 2D laminate, damage has extended to the edge of the clamp and
beyond (Figure 3.27). On the front face (Figure 3.28) only fiber debonding and matrix
were more complex. These modes included large straining of z-tows, debonding of
surface weft extending to the edge of the panel, and sliding of the surface weft through
the crimp of z-tows toward the perforation site.
Photographs of the 3D laminate (3D-S-93x3) are shown in Figures 3.30-32.
Again, backlighting revealed internal delamination and fiber-debonding that had grown
beyond the clamp boundary (Figure 3.30c). Similar to the 3D monolith, the front face of
the panel exhibited the same dominant failure modes: fiber debonding and matrix
cracking (Figure 3.31). Examination of the rear target face showed that one of the rear
surface weft tows had been pulled inward through z-tow crimps, some of which had been
broken near the perforation site (Figure 3.32). The residual transverse dishing of the
panel was noticeably greater in comparison with the other material systems.
Through-the-thickness damage was inspected by environmental scanning electron
microscopy (Hitachi S-3200). This mode of SEM uses low-pressure helium to alleviate
sample charging for electrically nonconductive samples and avoids the necessity of
coating the sample surface with gold. A hacksaw was used to cut the perforated panels
into strips that were approximately 1 cm in width and 2 cm in length. The cut faces were
then smoothed using 400-grit sandpaper and rinsed with water. Interesting micrographs
are presented for the thick 3D monolith and the 3D laminate (Figures 3.33-34). The
plane of the displayed cut face is normal to the weft direction for each micrograph. In the
case of the 3D monolith (Figure 3.33) extensive internal fiber-debonding was observed.
This investigation examined how variations of fabric architecture in GFRP
composite systems with comparable areal density, thickness, and fiber-volume-fraction
affected perforation resistance, strength, and distributions of energy dissipation of panels
subjected to quasi-static perforation. Three woven fabric preforms were investigated: a
24-ply 2D plain-weave laminate, a monolithic 3D orthogonal weave, and a 3-ply 3D
orthogonally woven laminate. The material consisted of a
rubber-toughened-epoxy-vinyl-ester reinforced by S2-glass fibers. Coupons were subjected to transverse
quasi-static puncture at fixed rates from 10 to 80 µm/s. The penetration load was recorded and
a novel view of internal damage progression was obtained by backlit videography.
Distinctions in failure modes of the various material systems were observed.
Matrix cracking, delamination or fiber debonding, and fiber fracture were observed in all
systems. Damage mechanisms unique to the 3D systems included the straining and
fracture of z-reinforcement tows. Also, the radial spread of damage was larger for the 3D
systems than for the 2D laminates; often, fiber debonding of the 3D systems extended to
the edges of the test panel.
Considering the thicker material systems, load data indicated that the strength and
capacity to absorb energy under transverse puncture were comparable for the 2D and 3D
laminates and superior to the 3D monolith. Normalization by areal density magnified the
superiority of the 3D laminate. This is attributed to the damage mechanisms unique to
these geometries. Furthermore, the introduction of two planes in the 3D laminates
4.5 Figures
(3D-S-93, 3.15 kg/m )
0 5,000 10,000 15,000 20,000 25,000 30,000 35,000 40,000
0.000 0.005 0.010 0.015 0.020 0.025 0.030 0.035
Tup Displacement (m)
Compressive Punch Force (N)
2D-24x12 3D-270 3D-93x3 3D-93 2D-24x4
0 2,000 4,000 6,000 8,000 10,000 12,000 14,000
0.000 0.005 0.010 0.015 0.020 0.025
Tup Displacement (m)
Compressive Punch Force (N)
3D-S-93 2D-S-24x4
Bold Line: 80 µm/s Load Rate
Thin Line: 10 µm/s Load Rate
0 5,000 10,000 15,000 20,000 25,000 30,000 35,000
0.000 0.005 0.010 0.015 0.020 0.025 0.030 0.035
Tup Displacement (m)
Compressive Punch Force (N)
Bold Line: 80 µm/s Load Rate
Thin Line: 40 µm/s Load Rate
0 5,000 10,000 15,000 20,000 25,000 30,000 35,000 40,000
0.000 0.005 0.010 0.015 0.020 0.025 0.030 0.035
Tup Displacement (m)
Compressive Punch Force (N)
Bold Line: 80 µm/s Load Rate
Thin Line: 40 µm/s Load Rate
0 5,000 10,000 15,000 20,000 25,000 30,000 35,000
0.000 0.005 0.010 0.015 0.020 0.025 0.030 0.035
Tup Displacement (m)
Compressive Punch Force (N)
Bold Line: 80 µm/s Load Rate
Thin Line: 40 µm/s Load Rate
Figure 3.10 Perforating Load-Displacement for Thick 3-Ply 3D Laminates
Before A
After D Before D
After C Before C
Before B After B
After D Before D
After C Before C
Before B After B
0 50 100 150 200 250 300 350 400 450 500
2D-S-24x4 3D-S-93 2D-S-24x12 3D-S-270 3D-S-93x3
Composite System
Work of Perforation (J)
0 500 1,000 1,500 2,000 2,500
0.000 0.005 0.010 0.015 0.020 0.025 0.030 0.035
Tup Displacement (m)
Normalized Punch Force (N m
2 /kg) 2D-24x12 3D-270 3D-93x3 3D-93 2D-24x4
Figure 3.16 Load-Displacement Behavior, Normalized by Target Areal Density 0 5 10 15 20 25 30 35 40
2D-24x4 3D-93 2D-24x12 3D-270 3D-93x3
Material System
Normalized Work (J m
2 /kg)
Before A
After D Before D
After C Before C
Before B After B
After A
(a) (b)
(c)
(a) (b)
(c)
(a) (b)
By subjecting specimens to repeated instrumented impacts, residual strength and
damage progression can be monitored. The purpose of the low-velocity impact
experiments is to examine the progression of damage and capacity for energy-absorption
of 2D and 3D woven GFRP composite systems subjected to multiple impacts. Dynamic
impact experiments for incident velocities from 2 to 4 m/s are conducted to determine
material response as a function of absorbed energy, areal density, and fabric architecture.
Photography, scanning electron microscopy, and analysis of contact force evolution are
used to assess the progression of damage.
4.1 Material Preparation And Fabrication
Five composite systems were examined. Various fabric architectures and
constituent materials were selected. In an effort to isolate the effects of reinforcement
geometry, samples were produced with comparable areal densities and thicknesses. Two
types of fiber were used: E-glass (density, ρE ≈ 2590 kg/m3) and S2-glass (density,
ρS2≈ 2510 kg/m3).
4.1.1 E-Glass Systems
Three reinforcement geometries were employed in the construction
E-glass-reinforced vinyl-ester composite panels. The fabric architecture of the first material
of the preform. The second material system (2D-E-24x4) was a conventional 2D
plain-weave laminate. The fabric preform of the third system consisted of a commercially
available, biaxially reinforced warp-knit (BRWK). All three composite systems have
E-glass fiber rovings and a vinyl-ester resin matrix, Reichhold Hydrex® 100.
Consolidation was achieved by vacuum-assisted resin-transfer molding, with a four- to
eight-hour post-cure at 85°C. A listing of the material systems is given in Tables 4.1 and
4.2. The areal density of each sample was determined by dividing the mass of each
sample by its area, taken to be the product of the two-point averages of the width and
length of each square coupon. The stated thickness is a four-point average.
Table 4.1 E-Glass/Vinyl-Ester Composite Systems for Low-Velocity Impact
Composite System
Sample Designation
Areal Density (kg/m2)
Fiber Volume Fraction Average Thickness (mm) 2D-E-24x4
(4-Ply, 2D Laminate)
2D-E-24x4-1 2D-E-24x4-2 4.45 4.53 0.52 0.53 2.44 2.39 BRWK (Biaxially-Reinforced Warp-Knit)
BRWK-E-1 3.99 0.58 2.34