INFLUENCE OF SPECTRUM-COMPATIBLE GROUND MOTIONS ON
NONLINEAR SITE RESPONSE
Manuel E. Rosario1, Luis E. Suárez2, and Luis A. Montejo3
1
Structural Engineer, Bechtel Nuclear Security & Environment, Reston, VA (formerly at the University of Puerto Rico at Mayagüez)
2
Professor, Dept. of Civil Engineering and Surveying, University of Puerto Rico at Mayagüez 3
Associate Professor, Dept. of Eng. Science and Materials, University of Puerto Rico at Mayagüez
ABSTRACT
Performance of seismic transmission wave analysis is specified in Appendix E of the Regulatory Guide 1.208 of the US Nuclear Regulatory Commission when subsurface shear wave velocities at nuclear power plant sites are less than those for generic rock conditions (2800 m/sec for central and eastern US). To determine the uniform hazard response spectrum at the ground surface, the use of seed-based spectrally-matched ground motions is specified as input; the use of synthetic motions is not allowed.
This paper investigates the variability of the surface response spectra for soil deposits ranging from rock (B) to stiff soil (D) according to the NEHRP classification system when using spectrum-compatible ground motions. Both the 1-D frequency domain equivalent-linear and time domain nonlinear methods are explored. Three batches of 47 ground motion records corresponding to increasing expected levels of site response (i.e., elastic, moderate, and nonlinear) were developed for scaled and spectrum compatible ground motions to quantify the site response variability at the ground surface. The results from 2,256 site response analyses indicated that site response variability is strongly dependant on soil stiffness and ground motion intensity. The mean response at the surface, as measured by the surface response spectra, was very similar when using scaled and compatible record but the variability in the spectra obtained both set of records was noticeable.
INTRODUCTION
To define the uniform hazard response spectra (UHRS) at the free-field ground surface, Appendix E of the 2007 Regulatory Guide 1.208 of the US Nuclear Regulatory Commission (US NRC 2007) specifies that a seismic wave transmission analysis (i.e., site response analysis) must be carried out when subsurface shear wave velocities at nuclear power plant sites are less than those for generic rock conditions (e.g. 2800 m/s for the Central and Eastern US). Dynamic site response is permitted through analyses based either on time-history or random vibration theory. If time-history based analyses are chosen, actual recorded earthquake ground motions should be used; synthetic ground motions (i.e., those not based on using recorded accelerograms as seed records) are not allowed.
The use of spectrum-compatible ground motions to perform dynamic analyses is a controversial topic in the earthquake engineering community because, among other factors, the characteristics of the resulting modified records may largely differ from those found in the original ground motions. Nevertheless, significant research effort was aimed at modifying existing so that the stationary and transient characteristics of the original record are preserved (e.g., Al Atik and Abrahamson 2010; Montejo and Suárez 2013; Gao et al. 2014). Despite their limitations, spectrally-matched ground motions display some advantages over linearly-scaled records. For instance, for a given design ground motion, spectrum-compatible earthquakes display less variability from one another than scaled records and thus the number of dynamic nonlinear analyses needed to characterize the mean response of the soil deposit is smaller.
Rather than focusing on the ground motion characteristics of the time series computed at the surface, the objective of the present paper is to investigate the influence of seed-based spectrum-compatible ground motions in the site response variability of different soil deposits using the 1-D frequency domain equivalent-linear (EL) and time domain nonlinear (NL) methods. In particular, the variability in the response spectra at the free surface calculated with 1-D site response analysis is investigated using both linearly-scaled and spectrally-matched time series, and considering soil deposits with different stiffness and several ground motion intensities. The CWT spectral-matching technique developed by Montejo and Suárez (2013) was used.
KIK-NET VERTICAL ARRAY STATIONS
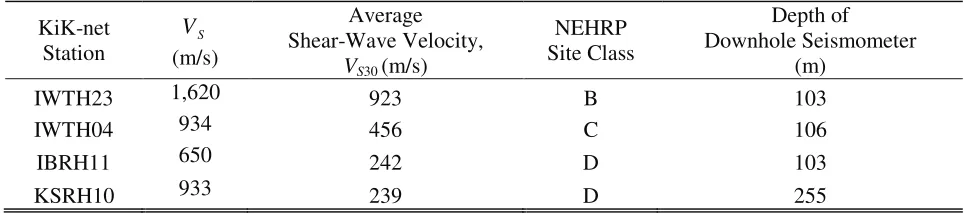
Four vertical array stations from the well-characterized KiK-net strong motion database in Japan (http://www.kik.bosai.go.jp/) were used in this study to investigate the influence of spectrum-compatible ground motions in nonlinear site response. The soil deposits were chosen such that sites with different levels of stiffness could be studied. Table 1 shows the average shear-wave velocity for the entire soil deposit (VS in the second column), the average shear wave velocity in the top 30m (VS30), the NEHRP site class according and the depth of the downhole seismometer in each KiK-net vertical array. Figure 1 shows the shear-wave velocity profile for each of the four KiK-net stations.
Table 1: Summary of KiK-net stations used
KiK-net Station
S
V (m/s)
Average Shear-Wave Velocity,
VS30 (m/s)
NEHRP Site Class
Depth of Downhole Seismometer
(m)
IWTH23 1,620 923 B 103
IWTH04 934 456 C 106
IBRH11 650 242 D 103
KSRH10 933 239 D 255
The KiK-net vertical array database was chosen because of the availability of a wide range of high-intensity ground motions recorded. Vertical array stations permit to assess the capability of current seismic site response methods in capturing the deposit’s surface response. Using the software DeepSoil (Hashash et al. 2012), both the 1-D frequency-domain equivalent-linear method (EL) and the time-domain nonlinear method (NL) were used to characterize the linear and nonlinear site response of the four KiK-net stations using the downhole seismometers’ recordings as input. Only a summary of the results will be presented in this paper. For a complete account of the characterization of all site response models, the reader is referred to Rosario (2014).
)
(
)
(
)
(
AF
rock , surface ,
T
S
T
S
T
a a=
(1)0 1000 2000
0
50
100
150
200
250
D
ep
th
(
m
)
IWTH23 (B)
VS30 = 923 m/s
VS(m/s)
0 1000 2000
IWTH04 (C)
VS30 = 456 m/s
VS(m/s)
0 1000 2000
IBRH11 (D)
VS30 = 242 m/s
VS(m/s)
0 1000 2000
KSRH10 (D)
VS30 = 239 m/s
VS(m/s)
Figure 1:Shear wave velocity (VS) profile of KiK-net stations used in this study (from
http://www.kik.bosai.go.jp/)
5 10 15
IWTH23 (B), V
S30 = 923 m/s
AF(
T
)
2 4 6 8 10 12
IWTH04 (C), V
S30 = 456 m/s
0.01 0.1 1
2 4 6 8 10 12
IBRH11 (D), V
S30 = 242 m/s
AF(
T
)
Period (sec)
0.01 0.1 1
2 4 6 8 10 12
KSRH10 (D), V
S30 = 239 m/s
Period (sec)
Measured Computed (EL) Computed (NL)
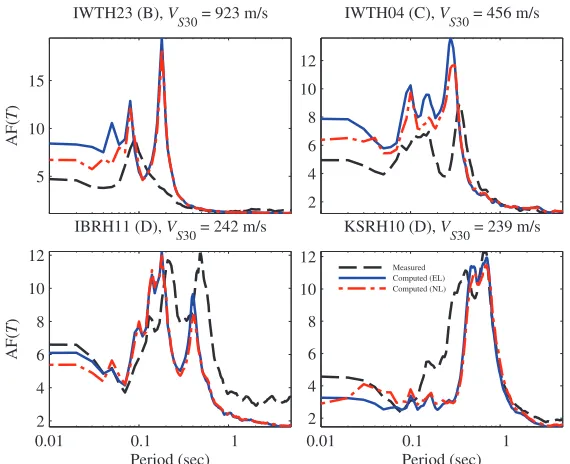
Figure 2: Empirical (i.e., measured) and computed mean site amplification function for all four KiK-net sites using the EL and NL methods
The number of high-intensity ground motions (including both EW and NS components) to compute the mean AF found in the KiK-net database (as of Fall of 2013) were 22, 11, 7, and 11 for stations IWTH23, IWTH04, IBRH11, and KSRH10 respectively.
the empirical linear-elastic transfer function (ETF), only 18 of 100 KiK-net stations studied were found to have a stable correlation based on the alignment of the resonances.
As shown in Figure 2, particularly for KiK-net station IWTH23 (with VS30 = 923 m/s), the fundamental frequency (fs) is not predicted accurately. According to Thompson et al. (2012), this is a limitation of the
SH1D model shared by most nonlinear codes. Although the 1-D soil models have shown limitations when compared to the data measured in vertical arrays, we will use these models to investigate the influence of spectrum-compatible records in site response analysis. The soils in the KiK-net site have been carefully characterized with their properties studied in labs. Moreover, because it is not the purpose of this paper to carry out a validation but a rather a simulation, it will be made the assumption that the predicted response is sufficiently accurate.
GROUND MOTION SELECTION AND SPECTRAL MATCHING
The uniform hazard response spectra (UHRS) defined at generic rock, having an annual return period of 10-5, developed for the Diablo Canyon Power Plant (DCPP) was used (PG&E, 2011). Figure 3 shows a plot of the target spectra for the DCPP which is located in central coastal California.
0.01 0.1 1
0.5 1 1.5 2 2.5 3 3.5 4
Period (sec)
S
p
ec
tr
al
A
cc
.,
Sa
(
g
)
Figure 3: 10-5 Uniform Hazard Response Spectra for the Diablo Canyon Power Plant
This spectrum is developed from probabilistic seismic hazard analysis (PSHA), which already considers the variability at all spectral periods of interest. Because of this, no additional variance is associated with this type of spectrum (Jayaram et al. 2011). This fact is important when considering the methodology to be used for ground motion selection. Therefore, it is appropriate in this case to select ground motions such that the mean spectrum of the suite of records matches the target spectrum.
The PEER Ground Motion Database (PGMD) (PEER 2010) was used as the platform for ground motion selection. The PGMD quantitatively selects the ground motions based on the smallest mean squared error (MSE) over a specified period range such that the ground motions having the closest spectral shape relative to that of the target spectrum are chosen. Given that the design spectrum is for rock site conditions, ground motion selection was narrowed to events measured on stations having an average shear wave velocity VS30 from 750 to 2800 m/s. Thirty events with the lowest MSE were selected from the PGMD (with no pulse records). Only the fault normal and fault parallel components were considered.
Appendix F of the US NRC Regulatory Guide 1.208 (2007) specifies the criteria for developing time-histories suitable for site response analysis. Ground motions generated to “match” or “envelope” the target design spectrum should comply with six requirements, five of which are considered in this study:
(1) Minimum record duration, Tmin = 20 sec; minimum Nyquist frequency, fNy 50 Hz.
(2) 5% damping response spectra must be computed with a minimum of 100 points per frequency decade in a uniformly spaced log frequency scale.
(3) Sa
comp.
(Ti) > 0.90.Sa
TARGET (Ti).
(4) Sa
comp.
(Ti) < 1.30.Sa
TARGET (Ti).
The sixth condition evaluates the consistency between the transient and stationary properties of the modified records and those found in the controlling earthquake events that define the uniform hazard response spectra. Because none of the controlling events were available, this step was not verified.
Each of the 30 ground motion records selected was evaluated according to the above criteria and when necessary, the record duration or the sampling rate were modify to comply with the provisions. Moreover, when necessary the sampling rate of the records were modified following the recommendations of Phillips et al. (2012). The use of Fourier transform zero padding interpolation to up-sample records with a ¨t > 0.005 s to a maximum ¨t = 0.005 s was proven satisfactory for both the computation of the response spectra of the ground motions and the surface response of the soil columns. Although criteria no. 1 of Appendix F specifies a minimum Nyquist frequency of 50 Hz (i.e., ¨t = 0.01 s), all ground motions having a ¨t > 0.005 s were up-sampled using the Fourier transform zero padding interpolation which, unlike other interpolation methods does not add additional frequencies to the signal above the original Nyquist frequency (Phillips et al., 2012). The response spectra for all ground motions were computed using the frequency-domain method. Screening the ground motions selected, 47 ground motions were found to satisfy the Appendix F criteria. Figure 4 displays the design spectrum and the mean response spectrum for both the scaled (left) and compatible (right) ground motion suites.
10-2 100
100
S
p
ec
tr
al
A
cc
el
.,
Sa
(
g
)
Period, T (sec)
Scaled records
T arget Spectrum Geom. Mean
10-2 10-1 100
0.5 1 1.5 2 2.5 3 3.5 4 4.5 5
Period, T (sec)
S
p
ec
tr
al
A
cc
el
.,
Sa
(
g
)
Target Spectrum
90% and 130% of Target spectrum Arithmetic Mean
Figure 4: Suite of PGMD records for Diablo Canyon target spectra: (a) scaled and (b) compatible records
SPECTRUM-COMPATIBLE RECORDS AND SITE RESPONSE ANALYSIS
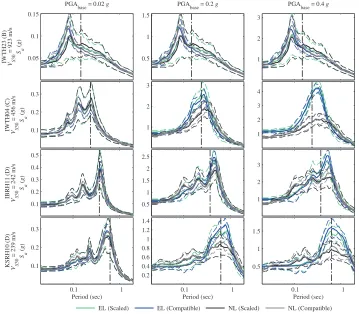
The variability of the surface response spectra obtained using spectrum-compatible and scaled ground motions computed with the EL and NL methods was investigated. The surface response spectrum for the four KiK-net sites was computed using three ground motion suites with increasing PGAbase for each of the 47 selected ground motions. Each ground motion suite was generated such that increasing expected levels of site response (i.e., elastic, weakly nonlinear and nonlinear) would be obtained at the free-field surface. For each soil deposit and batch case, the mean, standard deviation, and coefficient of variation of the surface response spectra were computed.
Figure 5 compares the mean surface response spectra ± one standard deviation of each suite of 47 ground motions, for scaled and compatible records, for all KiK-net sites, three ground motion intensities, and two site response methods. A vertical black dotted line indicates the fundamental period of the soil deposit (Ts) computed from the linear-elastic analytical transfer function. The spectra for the four deposits are
presented in descending order of VS30 values (i.e., from stiffer to softer deposits).
In general, for sites under low-intensity ground motions (i.e., the graphs in the first column) or for high-stiffness soil deposits experiencing mid-to-high ground motion intensities (e.g., station IWH23 in the first row) compatible ground motions display a higher mean surface response spectrum than that of scaled
records. Because nonlinear effects are not significant, the EL and NL methods predict very similar responses. For these same cases, the variability of the scaled ground motion suites at the free-field, as measured by the standard deviation, is significantly greater than those for the compatible records.
As nonlinear effects become significant (i.e., mid-to-low stiffness deposits experiencing mid-to-high intensity records), the mean response spectra at the free-field surface obtained from the EL method deviate pointedly from those computed with the NL method. This behavior was expected because of the formulation of the two methods. Also as expected, due to the nonlinear effects, the predominant period (Td) of the mean surface response spectra increases and moves away from Ts with the build-up of the
input ground motion intensity. Except for the higher spectral accelerations, station IWTH23 shows little response variation with changes in the ground motion intensity. Because of the high stiffness of the soil deposit (VS30= 923 m/s), no significant nonlinear behavior is experienced, and thus the site response predictions from the EL and NL methods are similar.
0.05 0.1 0.15
PGAbase = 0.02 g
IWTH23 (B) VS30
= 923 m/s Sa
( g ) 0.5 1 1.5
PGAbase = 0.2 g
1 2 3
PGAbase = 0.4 g
0.1 0.2 0.3
IWTH04 (C) VS30
= 456 m/s Sa
( g ) 1 2 3 1 2 3 4 0.1 0.2 0.3 0.4 0.5
IBRH11 (D) VS30
= 242 m/s Sa
( g ) 0.5 1 1.5 2 2.5 1 2 3
0.1 1
0.1 0.2 0.3
KSRH10 (D) VS
30
= 239 m/s Sa
(
g
)
Period (sec)
0.1 1
0.2 0.4 0.6 0.8 1 1.2 1.4 Period (sec)
0.1 1
0.5 1 1.5
Period (sec)
EL (Scaled) EL (Compatible) NL (Scaled) NL (Compatible)
Figure 5: Mean Surface Response Spectra (solid) ± ı. (dashed) using 3 suites of 47 scaled and compatible ground motions for all 4 KiK-net sites calculated with the EL and NL methods. The vertical black dotted
line denotes the fundamental site period Ts
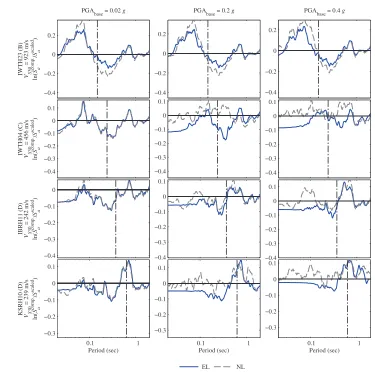
To quantify the difference between the mean surface response spectra using compatible and scaled records, a bias (R) was computed with the following equation:
( )
( )
( )
»»¼ º « « ¬ ª = T S T S T R a a scaled comp. ln (2)where Sacomp. and Sascaled are the compatible and scaled mean surface response spectra respectively. Figure
−0.4 −0.2 0 0.2
PGAbase = 0.02 g
IWTH23 (B) VS30
= 923 m/s
ln( Sa com p./ Sa sc al ed) −0.4 −0.2 0 0.2
PGAbase = 0.2 g
−0.4 −0.2 0 0.2
PGAbase = 0.4 g
−0.4 −0.3 −0.2 −0.1 0 0.1
IWTH04 (C) VS30
= 456 m/s
ln( Sa com p./ Sa sc al ed) −0.4 −0.3 −0.2 −0.1 0 0.1 −0.4 −0.3 −0.2 −0.1 0 0.1 −0.4 −0.3 −0.2 −0.1 0
IBRH11 (D) VS30
= 242 m/s
ln( Sa com p./ Sa sc al ed) −0.4 −0.3 −0.2 −0.1 0 0.1 −0.4 −0.3 −0.2 −0.1 0 0.1
0.1 1
−0.3 −0.2 −0.1 0 0.1
KSRH10 (D) VS30
= 239 m/s
ln( Sa com p./ Sa sc al ed) Period (sec)
0.1 1
−0.3 −0.2 −0.1 0 0.1 Period (sec)
0.1 1
−0.3 −0.2 −0.1 0 0.1 Period (sec)
EL NL
Figure 6: Bias between the compatible and scaled mean surface response spectra using the EL and NL site response methods.
No specific trend can be observed when the surface response spectra of scaled and compatible records are compared. As mentioned earlier, the presence of nonlinear effects has a significant effect in the response obtained with the EL and NL methods (e.g., compare the first vs. the third column). For stations IWTH04, IBRH11 and KSRH10 with earthquake intensities of 0.2g and 0.4g, it can be seen that the bias in the surface response spectra for the NL method is closer to zero than that of the EL method along the range of spectral periods considered. In those cases, the surface response spectra with obtained with compatible records is generally greater than those obtained with scaled records.
0 0.2 0.4
PGAbase = 0.02 g
IWTH23 (B) VS30
= 923 m/s
Coeff. Var., COV
0 0.2 0.4
PGAbase = 0.2 g
0 0.2 0.4
PGAbase = 0.4 g
0 0.2 0.4
IWTH04 (C) VS30
= 456 m/s
Coeff. Var., COV
0 0.2 0.4
0 0.2 0.4
0 0.2 0.4
IBRH11 (D) VS30
= 242 m/s
Coeff. Var., COV
0 0.2 0.4
0 0.2 0.4
0.1 1
0 0.2 0.4
KSRH10 (D) VS30
= 239 m/s
Coeff. Var., COV
Period (sec)
0.1 1
0 0.2 0.4
Period (sec)
0.1 1
0 0.2 0.4
Period (sec)
EL (Scaled) EL (Compatible) NL (Scaled) NL (Compatible)
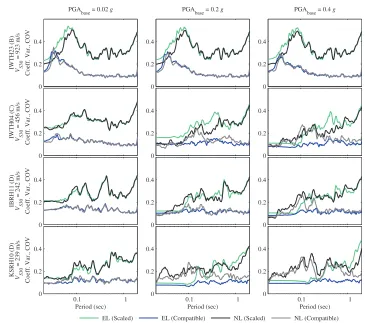
Figure 7: Coefficient of Variation of the mean surface spectra using 47 scaled and compatible ground motions with increasing PGA for the four KiK-net sites with the EL and NL methods
It can be clearly seen that the variability of the surface response spectra, as measured by the COV, is greater for scaled records than for compatible ground motions. When the effect of the ground motion intensity on the site response variability is examined, the EL method displays relatively consistent COV values for a given soil deposit. That is, regardless of the ground motion intensity and for a particular soil deposit, the variability of the surface response spectra seems to be consistent across all periods. For scaled ground motions however, the variability increases as the ground motions intensity builds up. The results in Figure 8 also exposes that the surface response spectra variability using the NL method displays a significant dependence on nonlinear effects, i.e. for soft soil layers with high levels of strain.
CONCLUSIONS
The influence of ground motion type (i.e., scaled vs. compatible) and intensity in 1-D nonlinear site response analysis was investigated. As expected, the results showed that the surface response of soil deposits is strongly dependant on ground motion intensity and soil stiffness. However, the selection of ground motion type (i.e., scaled vs. compatible) does not have a significant effect on the mean surface response of the soil deposit, but it does so in its variability. Because of the different nature of the methodologies for the modification of the accelerograms, the use of scaled records yields greater variability in the surface response spectra of a soil deposit than compatible records. Additionally, it is shown that the magnitude of this variability is not strongly dependant on ground motion intensity if the nonlinear effects are not very significant.
The factor that requires most consideration in site response analysis is the selection of the method to calculate the time response. As it was shown, there are significant discrepancies between the results predicted by the EL and NL method if the inelastic demand at the surface layer is high. It should be noted that although the results from scaled and compatible record were similar, suites of 47 ground motions were used for each case. Hence, the use of less number of records could produce more pronounced differences between the predictions of the two methods.
ACKNOWLEDGEMENTS
This work was performed under awards NRC-HQ-12-G-38-0018 and NRC-HQ-84-14-G-0057 from the US Nuclear Regulatory Commission. The statements, findings, conclusions, and recommendations are those of the authors and do not necessarily reflect the view of the US Nuclear Regulatory Commission.
REFERENCES
Al Atik, L. and Abrahamson, N. (2010). An Improved Method for Nonstationary Spectral Matching. Earthquake Spectra. Vol. 26, No. 3, pp. 601-617.
Gao, Y., Wu, Y., Li, D., Zhang, N., and Zhang, F. (2014). An Improved Method for the Generating of Spectrum-Compatible Time Series Using Wavelets. Earthquake Spectra, Vol. 30, No. 4, pp. 1467-1485.
Hashash, Y.M.A., Groholski, D.R., Phillips, C.A., Park, D., Musgrove, M. (2012) “DEEPSOIL 5.1, User Manual and Tutorial.” University of Illinois at Urbana-Champaign, 107 pp.
Jayaram, N., Lin, T., and Baker J.W. (2011). A Computationally Efficient Ground-Motion Selection Algorithm for Matching a Target Response Spectrum Mean and Variance. Earthquake Spectra, Vol. 27, No. 3, pp. 797-815
Kim, B. and Hashash, Y.M.A. (2013). Site Response Analysis Using Downhole Array Recordings during the March 2011 Tohoku-Oki Earthquake and the Effect of Long-Duration Ground Motions.
Earthquake Spectra, Vol. 29, No. S1, pp. S37-S54.
Kaklamanos, J., Bradley, B.A., Thompson, E.M., and Baise, L.G. (2013). Critical Parameters Affecting Bias and Variability in Site-Response Analyses Using Kik-Net Downhole Array Data. Bulletin of the Seismological Society of America, Vol. 103, No. 3, pp.1733-1749.
KiK-net. Kiban-kyoshin network. URL http://www.kik.bosai.go.jp/.
Kottke, A.R. (2010). A Comparison of Seismic Site Response Methods, Ph.D. Dissertation, Department of Civil, Architectural and Environmental Engineering, University of Texas at Austin, 302 pp. Montejo, L.A. and Suárez, L.E. (2013). An Improved CWT-Based Algorithm for the Generation of
Spectrum-Compatible Records. Int. Journal of Advances in Structural Engineering, pp. 5-26. PEER: Pacific Earthquake Engineering Research Center (2010). Ground Motion Database,
(http://peer.berkeley.edu/peer_ground_motion_database).
PG&E: Pacific Gas and Electric Company (2011). Report on the Analysis of the Shoreline Fault Zone, Central Coastal California, U.S. Nuclear Regulatory Commission
Phillips, C., Kottke, A.R., Hashash, Y.M.A., and Rathje, E.M. (2012). Significance of Ground Motion Time Step in One Dimensional Site Response Analysis. Soil Dynamics and Earthquake Engineering, Vol. 43, pp. 202- 217.
Rathje, E.M. and Kottke, A.R. (2008). A Semi-Automated Procedure for Selecting and Scaling Recorded Earthquake Motions for Dynamic Analysis. Earthquake Spectra, Vol. 24, No. 4, pp. 911-932.
Rosario, M.E. (2014). “Influence of Spectrum-Compatible Ground Motions on Nonlinear Site Response”. M.Sc. Thesis, Department of Civil Engineering,University of Puerto Rico at Mayagüez, 270 pp. Smerzini, C., Carmine, G., Iervolino, I. and Paolucci R. (2014). Ground Motion Record Selection Based
on Broadband Spectral Compatibility. Earthquake Spectra, Vol. 30, No. 4, pp. 1427-1448 Stewart, J.P., Kwok, A.O-L, Hashash, Y.M.A., Matasovic, Y.M., Pyke, R., Wang, Z., and Yang, Z.
Thompson, E.M., Baise, L.G., Tanaka, Y., and Kayen, R.E. (2012). A Taxonomy of Site Response Complexity.Soil Dynamics and Earthquake Engineering, Vol. 41, pp. 32–43.