| INVESTIGATION
Detecting Recent Positive Selection with a Single Locus
Test Bipartitioning the Coalescent Tree
Zongfeng Yang,*,†Junrui Li,*,‡Thomas Wiehe,§and Haipeng Li*,1
* Key Laboratory of Computational Biology, Chinese Academy of Sciences-Max Planck Gesellschaft (CAS-MPG) Partner Institute for Computational Biology, Shanghai Institutes for Biological Sciences, Chinese Academy of Sciences, Shanghai 200031, China, †University of Chinese Academy of Sciences, Beijing 100049, China,‡Howard Hughes Medical Institute, University of California, San Francisco, California 94143, and§Institut für Genetik, Universität zu Köln, 50674 Germany ORCID IDs: 0000-0001-9477-6843 (Z.Y.); 0000-0001-7856-4488 (H.L.)
ABSTRACT Many population genomic studies have been conducted in the past to search for traces of recent events of positive selection. These traces, however, can be obscured by temporal variation of population size or other demographic factors. To reduce the confounding impact of demography, the coalescent tree topology has been used as an additional source of information for detecting recent positive selection in a population or a species. Based on the branching pattern at the root, we partition the hypothetical coalescent tree, inferred from a sequence sample, into two subtrees. The reasoning is that positive selection could impose a strong impact on branch length in one of the two subtrees while demography has the same effect on average on both subtrees. Thus, positive selection should be detectable by comparing statistics calculated for the two subtrees. Simulations demonstrate that the proposed test based on these principles has high power to detect recent positive selection even when DNA polymorphism data from only one locus is available, and that it is robust to the confounding effect of demography. One feature is that all components in the summary statistics (Du) can be computed analytically. Moreover, misinference of derived and ancestral alleles is seen to have only a limited effect on the test, and it therefore avoids a notorious problem when searching for traces of recent positive selection.
KEYWORDSpositive selection; adaptation; demography
D
ETECTING recent events of positive selection and iden-tifying beneficial alleles is of continued high interest in evolutionary biology. During the last two decades, many methods for this purpose have been proposed. Recent pos-itive selection can alter the polymorphism pattern of a neutral locus which is partially or completely linked to a selected locus (i.e., the locus carrying the beneficial allele). The altered site frequency spectrum can be detected if it differs significantly from the expectation under the standard neutral model (Tajima 1989b; Fu and Li 1993; Fay and Wu 2000; Zeng et al.2006; Achaz 2009; Ferrettiet al.2010). Recent positive selection may also reduce genetic diversity around the selected locus due to genetic hitchhiking (MaynardSmith and Haigh 1974; Kim and Stephan 2002; Li and Stephan 2005; Nielsenet al.2005), and result in an elon-gation of haplotype blocks (Sabeti et al. 2002). Several excellent reviews (Sabetiet al.2006; Jensenet al.2007; Fu and Akey 2013) provide more insights into the details of selection detection algorithms. Recently, also machine
learning techniques have been proposed (Pavlidis et al.
2010; Lin et al. 2011; Ronen et al. 2013; Pybus et al.
2015; Schrider and Kern 2016). However, it still remains a challenging task to distinguish positive selection from de-mographic events since the amount and pattern of DNA polymorphism in samples from a population is typically af-fected not only by recent positive selection but also by de-mography (Neiet al.1975; Watterson 1986; Tajima 1989a; Jensenet al.2005; Teshimaet al.2006). The confounding effect of demography cannot be neglected when scanning genomes for candidate loci of recent positive selection (MacCallum and Hill 2006; Akey 2009; Hermisson 2009; Scheinfeldt and Tishkoff 2013; Vitti et al. 2013; Adrion et al.2015).
Copyright © 2018 by the Genetics Society of America doi:https://doi.org/10.1534/genetics.117.300401
Manuscript received October 14, 2017; accepted for publication December 1, 2017; published Early Online December 7, 2017.
Supplemental material is available online atwww.genetics.org/lookup/suppl/doi:10. 1534/genetics.117.300401/-/DC1.
1Corresponding author: Laboratory of Evolutionary Genomics, CAS-MPG Partner
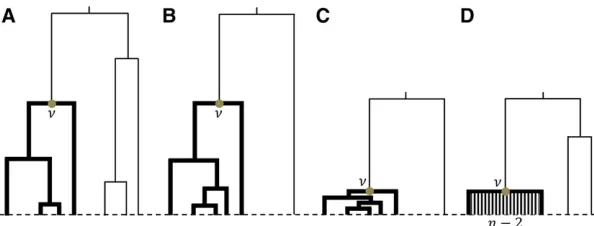
Recent positive selection may produce a coalescent tree which is different from that under neutral evolution (Kaplan et al.1989; Barton 1998; Fay and Wu 2000). Let us consider a locus partially linked to the selected locus, which means that a few recombination events happened during the selected phase. While selection operates, a lineage could escape from the selective sweep by recombination (Kaplanet al.1989; Fay and Wu 2000; Kim and Nielsen 2004). In the tree topology this is reflected by one particularly long branch emerging from the root of the tree (Figure 1). Such tree topology is often calledunbalanced(Sibertet al.2002; Blumet al.2006b; Li 2011; Li and Wiehe 2013). The unbalancedness of trees has been well studied (Kirkpatrick and Slatkin 1993; Blum et al.2006a), and can also be measured as the distribution of the average length of the base branches that emanate from the root (Uyenoyama 1997).
Let us consider the tree of a sample collected from a random mating population. It is known that the probability for a tree to be unbalanced is independent of changes in population size (Tajima 1983; Hudson 1991). However, the probability of an unbalanced tree increases substantially when the neutral locus is partially linked to a positively selected site (Kaplan et al. 1989; Fay and Wu 2000). In this case, the majority of lineages fail to escape the selective sweep, so they will coalesce as a star-like subtree, and the internal branches are very short (Galtier et al. 2000) (Figure 1C). We found that the ratio between the lengths of two subtrees under the selective sweep model departs from the expecta-tion under the standard neutral model (Figure 1). Therefore, hitchhiking also biases the average number of mutations in the two subtrees.
Recently, several groups proposed to detect selection using the information of coalescent tree, including topology of the tree (Li 2011; Disantoet al.2013; Li and Wiehe 2013; Ferretti et al.2017), and the distribution of coalescent times (Hunter-Zinck and Clark 2015; Ronen et al.2015). Following those studies, we proposed a new test statistic,Du, to detect recent positive selection in a varying size population. The tree can be partitioned into two parts, denoted as major and minor branches (Figure 1). Based on the infinite-sites model and the number of mutations occurred on the major and minor branches, we can calculate^umajorand^uminor:Under the stan-dard neutral model, we expect the balanced tree, and Eð^umajorÞ ¼Eð^uminorÞ ¼Eð^uwÞ; where uw is Watterson’s u (Watterson 1975), and estimated as the number of segregat-ing sites divided by the tree length. However, under the selective sweep model, we expect an unbalanced tree, and Eð^umajorÞ,Eð^uminorÞ;since positive selection has a stronger impact on the major branches than on the minor branches. Thus, the unbalanced tree and a normalized difference be-tween^umajorand^uminor(denoted asDu) is proposed as a sta-tistic to test for recent positive selection.
To measure the robustness of this statistic with respect to different confounding factors, we examined its false positive rate. Here, the false positive rate is defined as the probability to reject the standard neutral model (the null hypothesis) when
actually no positive selection happened (Przeworski 2002; Jensenet al.2005; Li 2011). A high false positive rate indi-cates that confounding factors should be taken into consid-eration when searching for loci under positive selection. We also compared our new method with other single locus tests for selection [see reviews by Sabetiet al.(2006), Fu and Akey (2013)]. Many of the available methods consider DNA poly-morphism data from multiple loci, tofirst obtain an empirical background distribution, and then to perform genome scans
for selective sweeps (Akey et al. 2002; Kim and Stephan
2002; Li and Stephan 2005, 2006; Nielsen et al. 2005;
Sabetiet al. 2007). Generally, those methods require much more information than a single locus. Therefore, to conduct a fair comparison, we consider here only single locus based methods.
Methods
Statistical test
Unbalanced bifurcating trees have been introduced before (Purvis and Agapow 2002; Holman 2005; Li 2011; Li and Wiehe 2013). Here, we make a modification so that the
unbalancedness can be defined for small samples. Let c1
andc2 be the number of left- and right-descendants of the two branches that originate from the root node of the tree, respectively, wherec1þc2¼n;andnis the number of sam-pled chromosomes. Furthermore, letG¼maxfc1;c2g;such thatGmay take integer values from⌈n=2⌉toðn21Þ;where ⌈z⌉means the smallest integer $ z:Under neutrality, it is known that, whennis oddPðG¼xÞ ¼ 2
n21for 1#x# n21
2 ; and, whennis even,
PðG¼xÞ ¼ 2
n21; 1#x, n 2 1
n21; x¼ n 2
ðTajima1983Þ:
8 > > < > > :
To bound the number of false positives produced by random topologies, we setgn¼minfn21;
⌈
0:95nþ0:05⌉
gWe call a tree unbalanced ifn$20 and 10% probability that the treeis more unbalanced (i.e., G$gn) under the standard
Wright-Fisher neutral model. For smaller sample size, one
can only take G¼n21; violating the 10% probability
criterion.
that 1 unit corresponds to 2Ngenerations, whereNis the effective size of a diploid population.EðLmajorÞis the expected total length of the major branches under neutrality.EðLmajorÞ and EðLminorÞ are calculated under the standard neutral model, andEðLtreeÞ ¼EðLmajorÞ þEðLminorÞ;whereLtreeis the tree length. Moreover, it is well-known thatu(¼4Nm) can be estimated from the number of mutations on the tree since EðuwÞ ¼2EðKÞ=EðLtreeÞ (Watterson 1975; Hudson 1991), wheremis the mutation rate per generation,Kthe number of segregating sites (i.e., the number of mutations occurred on the tree). Similarly,umajoranduminorcan also be estimated from the number of mutations on the major branches (Kmajor) and minor branches (Kminor), respectively, and we have K¼KmajorþKminor:To calculateumajor;uminor;andDu;details are given as follows:
LetTk(2#k#n) be the time duration required fork se-quences to coalesce to (k21) sequences,i.e., the so-called k-coalescent time. Following the standard coalescent pro-cess (Hudson 1991), we have
EðTkÞ ¼
2
kðk21Þ; (1)
VarðTkÞ ¼
4
k2ðk21Þ2; (2)
ETk2
¼VarðTkÞ þE2ðTkÞ ¼
8
k2ðk21Þ2: (3)
Furthermore, we can derive the expectation and variance of the branch lengths of the treeLtree(Hudson 1991) from Equa-tions (1) and (2):
EðLtreeÞ ¼E
Xn
i¼2iTi
¼Xn
i¼2iEðTiÞ ¼
Xn
i¼2
2 i21; (4)
VarðLtreeÞ ¼Var
Xn
i¼2iTi
¼Xn
i¼2i 2VarðT
iÞ
¼Xn
i¼2
4 ði21Þ2:
(5)
Wefirst takeG¼n21 as an example to derive the statistical properties of an unbalanced tree. More general results for unbalanced trees withG#n21 are given in the Appendix. WhenG¼n21;the expectation and variance ofLminorand Lmajor can be obtained from Equations (1)–(3) as follows:
EðLminorÞ ¼E
T2þ
Xn
i¼2Ti
¼EðT2Þ þ
Xn
i¼2EðTiÞ
¼1þXn
i¼2
2
iði21Þ ¼32 2
n; (6)
VarðLminorÞ ¼Var
T2þ
Xn
i¼2Ti
¼4VarðT2Þ þ
Xn
i¼3VarðTiÞ
¼Xni¼2 8 i22
n228nþ4
n2 ; (7)
EðLmajorÞ ¼E
Xn
i¼3ði21ÞTi
¼Xn
i¼3ði21ÞEðTiÞ
¼Xn
i¼3
2
i; (8)
VarðLmajorÞ ¼Var
Xn
i¼3ði21ÞTi
¼Xn
i¼3ði21Þ 2
VarðTiÞ ¼
Xn
i¼3
4
i2: (9)
Equation (6) holds becauseLminoris equal to the sum of the tree height and the branch length between the root and the nodey(Figure 1). Since
VarðLtreeÞ ¼VarðLmajorþLminorÞ
¼VarðLmajorÞ þ2CovðLmajor;LminorÞ
þVarðLminorÞ; (10)
we can get the covariance ofLmajorandLminor
CovðLmajor;LminorÞ ¼
VarðLtreeÞ2VarðLmajorÞ2VarðLminorÞ
2
¼1 2
Xn
i¼2
4 ði21Þ22
Xn
i¼3
4 i2242
Xn
i¼3
4 i2ði21Þ2
!
¼224 n2
Xn
i¼3
4
i2: (11)
For a general value ofG; we have
⌊
n=2⌋
,G#n21;whereðn22Þ coalescent events excluding the last one (from pre-sent to past). If we denote coalescent events that happen on
major branches with“1,”and those that happen on minor
branches with“0,”the sequence of coalescent events, from present to past, is a binary vector with ðG21Þ “1”s and ðx21Þ “0”s. Thus, there areC¼
n22
G21
possible binary
vectors Bm;m¼1; 2;. . .;C:As an example, Figure 2 illus-trates all the possible coalescent event vectors when n¼5 andG¼3:We useBto denote the set of binary vectors. Each element inB represents a set of trees having the same se-quence of coalescent events. Each set of trees occur with the same probability (1=C), since tree topology is independent of coalescent time, and trees with the same topology have the same probability. In other word pðm¼iÞ ¼1=C for all i2 f1;2;. . .;Cg
For convenience, we introduced a series of indicese2;e3;. . ., en2x:Each indexeicorresponds to a coalescent event on major branches. The subscriptiineidenotes the number of lineages in major branches right before this coalescent event (from pre-sent to past), and the value ei represents the number of lineages in the whole tree at the same time (Figure 2). With these indices, the expectation of lmajor can be calculated following the law of total expectation (details are given in the Appendix):
EðLmajorÞ ¼E
EðLmajorjmÞ
¼1 C
Xn
k¼3
2dk
kðk21Þ; (12)
where
dk¼ X xþ2
i¼3
X n2x21
j¼1;k2x21#j#k2iþ1
k2i j21
n2k n2x2j21
ðjþ1Þ
andm¼1;2;. . .;C:SinceLtree¼LmajorþLminor;we can eas-ily obtain the expectation ofLminorfrom Equations (4) and (12),
EðLminorÞ ¼EðLtreeÞ2EðLmajorÞ ¼
Xn
i¼2
2
i212EðLmajorÞ: (13)
Similar to the derivation ofEðLmajorÞ;we derived the variance ofLmajorandLminor(details are presented in the Appendix),
VarðLmajorÞ ¼1
C
Xxþ2
e2
Xxþ3
e3¼e2þ1⋯
Xn
en2x¼en2x21þ1
3Xni¼e
2
Xn
j¼i
8aiaj
ijði21Þðj21Þ
2E2ðLmajorÞ;
(14)
whereaiis determined by:ai¼kifek#i,ekþ1 (k2 f2;3;. . .;n2xganden2xþ1¼nþ1).
VarðLminorÞ ¼
1 C
Xxþ2
e2¼3
Xxþ3
e3¼e2þ1⋯
Xn
en2x¼en2x21þ1
3Xni¼2Xnj¼i 8bibj
ijði21Þðj21Þ
2E2ðLminorÞ;
(15)
wherebiis determined bybi¼
i; 2#i,e2
i2k; ek#i,ekþ1;where
2#k#n2x; en2xþ1¼nþ1:The covariance of Lmajor and Lminoris
CovðLmajor;LminorÞ ¼
VarðLtreeÞ2VarðLmajorÞ
2VarðLminorÞ
=2; (16)
where VarðLtreeÞ;VarðLmajorÞ;andVarðLminorÞ are given by Equations (5), (14), and (15), respectively.
Defineu¼4Nm;wheremis the mutation rate of the locus,
and let Kminor be the number of mutations on the minor
branches. Then, we haveEðKminorÞ ¼EðLminorÞu=2:Similarly, we haveEðKmajorÞ ¼EðLmajorÞu=2;whereKmajoris the number of mutations on the major branches. Thus, under the infinite-sites model, the population parameter u can be estimated fromKminorandKmajorseparately as
^
uminor ¼2Kminor=EðLminorÞ; (17)
^
umajor¼2Kmajor=EðLmajorÞ: (18)
Similar to Tajima’sD(Tajima 1989b), we denote the normal-ized difference between^umajorand^uminorasDu:That is,
Du¼ ^
umajor2^uminor
ffiffiffiffiffiffiffiffiffiffiffiffiffiffiffiffiffiffiffiffiffiffiffiffiffiffiffiffiffiffiffiffiffiffiffiffiffiffiffiffiffi
Varð^umajor2^uminorÞ
q : (19)
Figure 2 Illustrations of possible coalescent event vectors
for a sample whenn¼5 andG¼3:There are
3 2
¼3
Then, we haveVarð^umajor2^uminorÞ ¼Varð^umajorÞ22Covð^umajor; ^
uminorÞþ Varð^uminorÞ; where Varð^uminorÞ; Varð^umajorÞ and Covð^umajor;^uminorÞcan be expressed as functions of expectation, variance, and covariance ofLminorandLmajor(Equations 12–16). From Equation (16), the variance of^uminoris obtained as
Varð^uminorÞ ¼
VarðKminorÞ
E2ðL
minor=2Þ¼
2uEðLminorÞ þu2VarðLminorÞ
E2ðL
minorÞ ;
(20)
where u is estimated by Watterson’s method (Watterson
1975), that is, ^uw¼K=
Pn21 i¼1
1
i:Similarly, we have the vari-ance of^umajor
Varð^umajorÞ ¼
2uEðLmajorÞ þu2VarðLmajorÞ
E2ðL
majorÞ :
(21)
Calculation ofCovð^umajor;^uminorÞis given in the Appendix. The result is
Covð^umajor;^uminorÞ ¼u2
CovðLmajor;LminorÞ
EðLmajorÞEðLminorÞ:
(22)
Following previous studies (Tajima 1989b; Fu and Li 1993),
u2was estimated byKðK21Þ=Pn21 i¼11i
2
þPn21 i¼1i12
Under
the standard neutral model, we haveEð^umajorÞ ¼Eð^uminorÞ ¼u; thus EðDuÞ 0: However, it is expected that recent positive selection has stronger impact onLmajorthanLminor(Figure 1, C and D), which reducesEðLmajorÞ=EðLminorÞ:This results in
a stronger reduction of Kmajor than of Kminor: Thus
Eð^umajorÞ,Eð^uminorÞ,u;andEðDuÞ,0:
To get the inferred value of G for the locus, which is denoted by G^ (i.e., the branching pattern of the root), an unweighted pair group method with arithmetic mean (UPGMA) tree (Sneath and Sokal 1973) was reconstructed based on nucleotide differences. Here, only the information on the root of the UPGMA tree was collected. UPGMA was chosen in this study because it is an effective tree-construction al-gorithm, and can naturally determine the root. There are also other algorithms based on nucleotide differences that has similar efficiency, for instance neighbor-joining (Saitou and Nei 1987), but the latter is unable to infer the root without the information of outgroup. Moreover, in contrast to between-species phylogenetics, rate-variation of the muta-tion rate along branches is not a major concern in populamuta-tion genetic genealogies. A similar tree-bipartition algorithm was developed to estimate coalescent times (Tanget al.2002; King and Wakeley 2016).
To calculateDu^ ;let the sampled sequences be numbered
from 1 to n, assuming that the sample consists of n
se-quences. Thus, S¼ f1;2;⋯;ngrepresents the whole sam-ple. Without loss of generality, denote the descendants of the left branch originating from the root asf1;⋯;G^g;and the descendants of the right branch originating from the root as fG^þ1;⋯;ngThen, under the infinite sites model,
^
Kmajor is the number of segregating sites in the subsample f1;⋯;G^g (Supplemental Material, Figure S1 in File S1), andK^minor¼K^2K^major;whereK^minorandK^majorare the ob-served number of mutations on minor branches and major branches, respectively. Therefore, we do not infer the ancestral and derived status of alleles to estimateKminor andKmajor;and the outgroup is only used to root the tree. Following Equations (18) and (19),^uminorand^umajorcan be calculated.
Finally, to test whether the data differ significantly from the expectation under the standard neutral model (one tail test), the p-value of the test is given by PðG$gn; Du#Du^ jj^1; ^j2;^j3þÞ;
where Du^ is the estimated value of the statistic of the studied locus, andf^j1; ^j2;^j3þgis the observed compact site frequency
spectrum of the locus (Li and Stephan 2005). When an outgroup is available, the compact site frequency spectrum is polar-ized, and ^j1 is the number of singletons observed in the sample, ^j2 the number of doubletons, and ^j3þ¼Pni¼231^ji (Li and Stephan 2005). When an outgroup is not available, the compact site frequency spectrum is unpolarized.
The test can only be performed if the sample size is not extremely small (i.e., at least 10 diploid individuals, or the number of chromosomesn$20) since it requires to infer an unbalanced tree (i.e., G^$gn). This restriction reduces the power because positive selection may not always produce an unbalanced tree. However, for the sake of keeping the false positive rate under control, we accept somewhat less sensitivity. We estimate theP-value of the test by generating 104samples of polymorphism data under the standard neu-tral model, and choosing the significance level of 0.05.
Simulation data
To examine the performance of theDutest, single-locus DNA polymorphism data were simulated in different demographic scenarios. Then, the root branching pattern of tree (G) was estimated by the UPGMA method to partition each simulated sample into major and minor parts. Simulations for neutrality were done according to the procedures described previously (Hudson 1991). Positive selection was assumed to be direc-tional with codominant alleles: denotingbas the wild-type allele andBas the favored allele on the selected locus, the three genotypes,bb,bB, andBB, have the relativefitness 1, 1+s, and 1+2s, respectively. The dynamics of the selected locus follow a deterministic approximation for the selective stage, where the frequency of the beneficial allele increases from e to 12e;where e¼1=2N (Kim and Stephan 2002; Li and Stephan 2006). We did not use time-forward simula-tions to generate the trajectory of the selected allele (Ewing and Hermisson 2010), and it is beyond the topic of this study to compare with the two trajectories.
Data availability
selection on the maize genome (Tian et al.2009; Linet al. 2011). We also randomly selected and analyzed three chro-mosomal regions as neutral controls.
The software to perform theDutest is platform indepen-dent. It requires a preinstalled standard Java environment (version 1.5 or higher). The software for calculating Du can be freely downloaded from Zenodo (http://doi.org/ 10.5281/zenodo.835226) and our institutional website (http://www.picb.ac.cn/evolgen/softwares/).
Results
The distribution of Du
Wefirst examined the distribution ofDuunder the standard neutral model without recombination (Figure S2 inFile S1).
when there is recombination within the locus. This agrees with the previousfindings that recombination affects the dis-tribution of summary statistics for detecting selection (Wall 1999).
Moreover, the infinite-sites model could be invalid due to multiple hits and homoplasy, although it is popularly used when detecting recent positive selection. We expect that the effects should be similar to recombination (Hudson 2001; McVean et al.2002) and make the test more conservative, as discussed above.
False positive rates under neutrality
Population size expansion and bottleneck may result in the incorrect inference of positive selection when there is none (Neiet al.1975; Watterson 1986; Tajima 1989a; Jensenet al. 2005). As many researchers pointed out (Akey 2009; Hermisson 2009), this problem cannot be underestimated, in particular in genome-wide scans. To investigate the robust-ness of theDu test, the false positive rate is the probability that the null hypothesis (i.e., the standard neutral model) is rejected when the neutral data are simulated under different demographic scenarios (Przeworski 2002; Jensenet al.2005; Li 2011).
Population size expansion:We examined the robustness of
the tests under recent and old population size expansions
(Figure 3E). The maximum false positive rate of Tajima’s Dtest, Fu and Li’sDtest is60–85% in the cases examined (Figure 3A). It agrees with the previousfindings that Tajima’s Dand Fu and Li’sDtest are sensitive to population size ex-pansion (Tajima 1989a; Fu and Li 1993). In contrast to these tests, but similar to the MFDM test, theDutest remains robust under all the examined expansion scenarios, no matter whether the outgroup is available or not. Fay and Wu’sHtest performs comparably to theDu test in this model. We shall also point out that the false positive refers only to the case that the tests falsely identify the signal of positive selection in a neutral evolved sample. If we are interested with detecting population size expansion, the false positive rate would be indicated as power (Tajima 1989a; Fu 1997; Pluzhnikovet al. 2002).
Bottleneck: We examined the population bottleneck model
the intermediate age events. Additional simulations suggest that the robustness of theDutest holds when the number of sampled chromosomes is very small (i.e., 10 diploids or n¼20) (Figure S3 inFile S1).
Moreover, the examined bottleneck scenarios are particu-larly severe in so far as they produce particuparticu-larly large false positive rate of Tajima’s D test (Tajima 1989b) and the selective sweep based approach (Li and Stephan 2005), since they enlarge the variance of different summary statis-tics, for example p and Watterson’suw:As has been noted before (Wallet al.2002; Wieheet al.2007), bottlenecks with an extreme effect on the false positive rate have a severity of t1N0=N11;wheret1is the duration of the bottleneck,N0 the current effective population size, and N1 the effective population size during the bottleneck. For such range of pa-rameter values, in some loci, all the lineages coalesce rapidly during the bottleneck, while, in other loci, some lineages survive the bottleneck and have much older MRCA with other lineages (Depaulis et al. 2003). Bottlenecks with such an order of severity should be carefully examined whenever de-termining the false positive rate of a test for recent positive selection (Xiang-Yuet al.2016).
Population structure:We also examined the effects of
pop-ulation subdivision under the symmetric island model (Figure 3G). Population subdivision has a profound effect on tree topology (Wakeley and Aliacar 2001). It was known that when the migration rate is intermediate, a lineage may mi-grate from one subpopulation to another, and the mimi-grated lineage may not coalesce with any others before the most recent common ancestor. In such a case, the tree is unbal-anced. In some cases, the migrated lineage causing unbalanc-edness can be detected by a simple phylogenetic method with sampling of an additional individual (known as migrant-detector, MD) (Li 2011) since the MD would coalesce with the migrated lineagefirst before coalescing with any others. Overall, the examined population structure scenario does not affect the Du test while Tajima’s D test and Fay and Wu’sHtest are sensitive to this confounding factor (Figure
3C). Fu and Li’s D test is also robust to most migration parameters.
Then, we examined the population divergence model (Figure 3H), which is similar to the finite island model, but the subpopulations have a recent common ancestral population. All the tests are insensitive to the examined population divergence event for different migration parameters (Figure 3D). Moreover, an incomplete MD-sampling prob-lem may occur in practice, since population structure often remains unknown. We investigated this by assuming that MDs are only sampled from several randomly chosen demes (Figure S4 inFile S1). TheDutest is not completely robust to the effect of population structure, although the false positive rate of theDutest is generally lower than that of Fay and Wu’sHtest (max 0.25vs.0.46). When there are no MDs available, the false positive rate of the Du test varies with migration rate. It ranges between 0.05 and 0.25, and reaches the maximized value when 4Nm¼0:4: The false positive rate of theDu test decreases when the number of MDs increases. The false positive rate of theDu test remains below 0.05 when MDs are available from about one-half of the demes. The hidden population struc-ture may also lead to an unequal sampling problem. Fol-lowing the previous studies (Przeworski 2002; Li 2011), we explored this problem with a wide range of migration
parameters. We found that the Du test performed better
than Fay and Wu’sH test, and is robust with respect to
the unequal sampling problem in the most of cases (Figure S5 inFile S1).
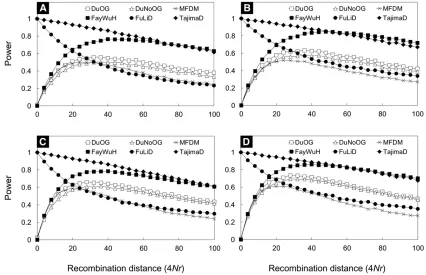
Power
We examined the sensitivity of theDu test under a selective sweep. Our simulations suggested that the power of the
Du test can be above 60% whenn$100 (or the number of
sampled diploid individuals is $50) (Figure 4A). As
expected, the power increases when sample size and/or the number of observed polymorphic sites increase (Figure 4). Generally, the power (slightly) increases when an outgroup is available. Interestingly, when recombination occurs within the locus, the power of the Du test remains similar to that without recombination within the locus (Figure 4 and Figure S6 inFile S1). This suggests that recombination may not have an adverse effect on the power ofDumuch, because selection reduces the total length of the coalescent tree, and, hence, reduces the opportunity for recombination (Sabeti et al. 2002).
We also investigated the effect of the population size expansion and bottleneck models on the power of Du test, including old and recent demographic events. It has suffi-ciently high power to identify a selective sweep even when population size varied in the past (Figure S7 inFile S1). We also surveyed the effect of differentt in detecting positive selection under the constant population size model and the bottleneck model, wheretis the time back to the completion of the selective substitution (in units of 2N generations, whereN is the effective population size) (Figure S8 inFile Table 1 The presumptive signatures of positive selection on the
chromosome 10 of maize
Win start Win end G K Kminor Du P-value
84,631,154 84,651,154 81 185 94 21.3858 0.0122
84,633,154 84,653,154 81 198 100 21.3665 0.0078
84,635,154 84,655,154 81 210 108 21.4343 0.0096
84,637,154 84,657,154 81 213 112 21.5171 0.0070
84,639,154 84,659,154 81 234 123 21.5190 0.0107
84,641,154 84,661,154 81 229 122 21.5690 0.0095
84,643,154 84,663,154 81 244 131 21.6007 0.0074
84,645,154 84,665,154 81 225 122 21.6361 0.0080
84,647,154 84,667,154 81 220 118 21.5934 0.0089
84,649,154 84,669,154 81 244 128 21.5128 0.0082
S1). It is expected that the power is lowered when t in-creases. Simulations suggest that theDutest is able to detect positive selection whent,0:1:
Robustness to model misspecification
Next, we checked the dependence of the false positive rate on background selection (Charlesworthet al.1993). Similar to the previous analysis (Fu 1997; Li 2011), we considered here a partially linked gene pair that, as a pair, is subject to puri-fying selection, with a neutral DNA segment placed in be-tween. Background selection typically leads to an excess of singletons, but does not affect the high frequency derived mutations (Fu 1997). As expected, the false positive rate of theDu test under background selection remains below the significance level of the test (Figure S9 inFile S1). Among the three classical statistical tests, Fay and Wu’sH test is also robust to background selection.
Application to experimental data from maize
Previous studies (Tianet al.2009; Linet al.2011) identified a selective sweep in a core region 83.5–86 Mb on chromo-some 10 of the maize genome in a data set containing 28 sequences (Goreet al.2009). It is a subset of data that we used in this study (n = 84) (Chiaet al.2012). Following these studies we conducted an analysis on the core region in the latest maize data set using the Du test. Ten windows were analyzed, and theP-values of the test were obtained
by analyzing 104 simulated data (Table 1). After false
discovery rate (FDR) correction for multiple testing (Benjamini and Hochberg 1995), test results in all windows
were significant (FDR,0.05). The examined consecutive
windows are largely overlapped, thus, the FDR correction is rather conservative. It indicates that a putative beneficial allele may have occurred near, or within, the core region, which agrees with previous studies (Tian et al.2009; Lin et al.2011). We also randomly selectedfive 20-kb regions as controls and found no inferred unbalanced trees (Table S2 in File S1). This indicates that the significant results of the core region may not be due to hidden population structure.
Discussion
Unlike the demography-adjusted tests of neutrality (Li and Stephan 2006; Rafajlovi´cet al. 2014), theDu test does not need prior information on the demography of the species. The demography can be inferred (Li and Stephan 2006;
Gutenkunst et al. 2009; Li and Durbin 2011; Liu and Fu
2015), and used as the null hypothesis when detecting recent positive selection (Li and Stephan 2006). Or an empirical background frequency spectrum can be used for identifying sites in the genome that were affected by recent positive selection (Nielsen et al.2005; DeGiorgioet al.2016). This is indeed an efficient means to reduce the false positive rate, due to the confounding effect of demography, and to increase the power (Pavlidis et al. 2008); however, these methods usually require genome-wide polymorphism data. Thus, we have developed the single-locus approach, which is robust against the most confounding effects of demography.
Employing a tree-based approach (Li 2011; Disantoet al. 2013; Li and Wiehe 2013; Hunter-Zinck and Clark 2015; Ronenet al.2015), we propose theDutest for recent positive selection at a single locus. It requires DNA polymorphism data obtained from a single locus (1–50 kb chromosomal region) when randomly selected sequences (at least 10 dip-loid individuals) are available. It may not be suitable for genome-wide scans for positive selection because of the mul-tiple-testing problem. Our analysis has demonstrated that it is robust to varying population size models, and most popu-lation structure scenarios examined. To further reduce the false positive rate of the population structure, we recommend to implement the MD approach (but it requires more sam-pling) (Li 2011), and to analyze a few randomly selected control loci, since population structure is detectable on a genome-wide scale.
Moreover, the varying read mapping coverage among lineages may affect the test. If some lineages have higher coverage than others, those lineages may falsely appear to be longer branches than others. Thus, we recommend further confirming the DNA polymorphism data within candidate regions, or that randomly chosen controls could be applied to examine this confounding issue.
Figure 5 Illustration of the effects of misinferred ancestral (upper cases) and derived (lower cases) status of single nucleotide polymorphism. (A) The true case. The open circles represent two mutations occurred on the minor and major branches. (B) The case that the ancestral and derived status of alleles is misinferred. The misinference does not affect the estimation ofKminorandKmajor;since ^
Tree unbalancedness
Previously, tree unbalancedness has usually been examined for species tree (Uyenoyama 1997; Purvis and Agapow 2002;
Holman 2005; Ford et al. 2009). Here, we focus on tree
unbalancedness within a species. The main forces to produce unbalanced trees are random drift (Tajima 1983), selection (Kaplanet al.1989; Fay and Wu 2000; Sibertet al.2002; Kim and Nielsen 2004; Blumet al.2006b), and population struc-ture (Wakeley and Aliacar 2001; Przeworski 2002). Popula-tion structure affects the whole genome, whereas the effects of selection are always restricted to individual loci located near the selected allele.
To measure tree unbalancedness, we used the maximum value of the left and right subtree sizes of the inferred UPGMA tree, denoted byG:Here,Grepresents the branching pattern of the root, thus, no complete tree needs to be inferred in this study.Gis also different with other summary statistics of tree unbalancedness, such as Colless’indexC(Colless 1982), the total cophenetic index (Miret al.2013), and Matsen’s index (Matsen 2006), mainly becauseGcontains only limited in-formation of the tree.
Overview of the Dutest
Our method aims at comparing the summary statistics (^umajor and^uminor) calculated for the two subtrees of the unbalanced tree. It is expected that the mutation rate on the two subtrees is the same, and that^umajor and^uminorare comparable. We have shown that positive selection typically imposes a strong impact on branch length in one of the two subtrees, while population size change affects the branch lengths of both subtrees. Thus,Du tends to be more negative under positive selection, while EðDuÞ 0 under neutral scenarios. Espe-cially, an unbalanced tree is expected to occur when a neutral locus is partially linked to a beneficial allele. Therefore, a significantPof theDutest indicates that the locus is at close genetic distance from the beneficial allele (Figure 3). More-over, our results show that the Du test has high power to detect positive selection in an expanded or bottlenecked pop-ulation (Figure S8 inFile S1).
In this study,^umajorand^uminorare estimated based on the average tree, similar with Watterson’s^uw:It has been shown that^uUPBLUE is more precise than^uw since the former inte-grates the phylogenetic information (Fu 1994). Thus, the estimates of^umajor and^uminor could be improved further in the future.
Moreover, to infer the branching pattern of the root (G), the UPGMA method may a poor estimator under certain con-ditions. We recommend to root the tree by an outgroup whenever it is possible. However, we also note that the per-formance of theDu test depends only slightly on the avail-ability of an outgroup in all the examined cases. This is of practical importance since an outgroup may not easily be available.
It is known that tests such as Fay and Wu’sH, are sensitive to misinference of derived and ancestral variants of segregating
sites by using outgroup (Baudry and Depaulis 2003; Hernandez et al.2007a), and such misinference is an annoying problem
when searching for positive selection (Hernandez et al.
2007b). In contrast, the misinference of derived and ances-tral alleles does not affect theDutest, sinceK^minorandK^major remain unchanged (Figure 5).
A previous study has shown that, based on simulated data across 400 kb, the selective sweep (multiple-loci) approach has power to detect positive selection whent#0:2 (Li and Stephan 2005). Another independent study demonstrated that long-haplotype based methods can detect much younger positive selection than do selective sweep approaches (Sabeti et al.2006). Therefore, it is a useful and reasonable time scale (t,0:1) that is suitable for our approach.
We applied theDu test to a well characterized genomic region on the maize genome. The data set we used contains different populations from domesticated improved maize lines and traditional landraces (Chia et al. 2012; Hufford et al. 2012). It was proposed that maize experienced a bottleneck (Wright et al.2005; Tianet al.2009). Despite the complex history and population structure of the con-sidered sample, theDutest identified the selective sweep in the core region, but not in the randomly selected control regions.
To summarize, we have demonstrated that theDutest not only remains robust to a wide range of parameters of demog-raphy, but also has high power to detect positive selection. It possesses improvements compared to the existing single locus methods. Nicely, all the components in the summary statistics (Du) can be computed analytically.
Acknowledgments
We would thank Martin Lascoux for his comments. J.L., Z.Y., and H.L. were supportedfinancially by the Strategic Priority Research Program of the Chinese Academy of Sciences (XDB13040800) and the National Natural Science Founda-tion of China (nos. 91531306, 91731304). T.W. acknowl-edgesfinancial support by the German Research Foundation (DFG-SFB680).
Literature Cited
Achaz, G., 2009 Frequency spectrum neutrality tests: one for all and all for one. Genetics 183: 249–258.
Adrion, J. R., M. W. Hahn, and B. S. Cooper, 2015 Revisiting classic clines inDrosophila melanogasterin the age of genomics. Trends Genet. 31: 434–444.
Akey, J. M., 2009 Constructing genomic maps of positive selection in humans: where do we go from here? Genome Res. 19: 711– 722.
Akey, J. M., G. Zhang, K. Zhang, L. Jin, and M. D. Shriver, 2002 Interrogating a high-density SNP map for signatures of natural selection. Genome Res. 12: 1805–1814.
Barton, N. H., 1998 The effect of hitchhiking on neutral geneal-ogies. Genet. Res. 72: 123–133.
Benjamini, Y., and Y. Hochberg, 1995 Controlling the false dis-covery rate: a practical and powerful approach to multiple test-ing. J. R. Stat. Soc. Ser. B Stat. Methodol. 57: 289–300. Blum, M. G. B., O. Francois, and S. Janson, 2006a The mean,
variance and limiting distribution of two statistics sensitive to phylogenetic tree balance. Ann. Appl. Probab. 16: 2195–2214. Blum, M. G. B., E. Heyer, O. Francois, and F. Austerlitz,
2006b Matrilineal fertility inheritance detected in hunter-gatherer populations using the imbalance of gene genealogies. PLoS Genet. 2: e122.
Charlesworth, B., M. T. Morgan, and D. Charlesworth, 1993 The effect of deleterious mutations on neutral molecular variation. Genetics 134: 1289–1303.
Chia, J. M., C. Song, P. J. Bradbury, D. Costich, N. de Leonet al., 2012 Maize HapMap2 identifies extant variation from a ge-nome influx. Nat. Genet. 44: 803–807.
Colless, D. H., 1982 Review of“phylogenetics: the theory and practice of phylogenetic systematics”. Syst. Zool. 31: 100– 104.
DeGiorgio, M., C. D. Huber, M. J. Hubisz, I. Hellmann, and R. Nielsen, 2016 SWEEPFINDER2: increased sensitivity, robust-ness andflexibility. Bioinformatics 32: 1895–1897.
Depaulis, F., S. Mousset, and M. Veuille, 2003 Power of neutrality tests to detect bottlenecks and hitchhiking. J. Mol. Evol. 57: S190–S200.
Disanto, F., A. Schlizio, and T. Wiehe, 2013 Yule-generated trees constrained by node imbalance. Math. Biosci. 246: 139–147. Ewing, G., and J. Hermisson, 2010 MSMS: a coalescent
simula-tion program including recombinasimula-tion, demographic structure and selection at a single locus. Bioinformatics 26: 2064–2065. Fay, J. C., and C.-I. Wu, 2000 Hitchhiking under positive
Darwin-ian selection. Genetics 155: 1405–1413.
Ferretti, L., M. Perez-Enciso, and S. Ramos-Onsins, 2010 Optimal neutrality tests based on the frequency spectrum. Genetics 186: 353–365.
Ferretti, L., A. Ledda, T. Wiehe, G. Achaz, and S. E. Ramos-Onsins, 2017 Decomposing the site frequency spectrum: the impact of tree topology on neutrality tests. Genetics 207: 229–240. Ford, D., F. A. Matsen, and T. Stadler, 2009 A method for
inves-tigating relative timing information on phylogenetic trees. Syst. Biol. 58: 167–183.
Fu, W., and J. M. Akey, 2013 Selection and adaptation in the human genome. Annu. Rev. Genomics Hum. Genet. 14: 467– 489.
Fu, Y. X., 1994 A phylogenetic estimator of effective population size or mutation rate. Genetics 136: 685–692.
Fu, Y.-X., 1997 Statistical tests of neutrality of mutations against population growth, hitchhiking and background selection. Ge-netics 147: 915–925.
Fu, Y.-X., and W.-H. Li, 1993 Statistical tests of neutrality of mu-tations. Genetics 133: 693–709.
Galtier, N., F. Depaulis, and N. H. Barton, 2000 Detecting bottle-necks and selective sweeps from DNA sequence polymorphism. Genetics 155: 981–987.
Gore, M. A., J. M. Chia, R. J. Elshire, Q. Sun, E. S. Ersozet al., 2009 Afirst-generation haplotype map of maize. Science 326: 1115–1117.
Gutenkunst, R. N., R. D. Hernandez, S. H. Williamson, and C. D. Bustamante, 2009 Inferring the joint demographic history of multiple populations from multidimensional SNP frequency data. PLoS Genet. 5: e1000695.
Hermisson, J., 2009 Who believes in whole genome scans for selection? Heredity 103: 283–284.
Hernandez, R. D., S. H. Williamson, and C. D. Bustamante, 2007a Context dependence, ancestral misidentification, and spurious signatures of natural selection. Mol. Biol. Evol. 24: 1792–1800.
Hernandez, R. D., S. H. Williamson, L. Zhu, and C. D. Bustamante, 2007b Context-dependent mutation rates may cause spurious signatures of afixation bias favoring higher GC-content in hu-mans. Mol. Biol. Evol. 24: 2196–2202.
Holman, E. W., 2005 Nodes in phylogenetic trees: the relation between imbalance and number of descendent species. Syst. Biol. 54: 895–899.
Hudson, R. R., 1991 Gene genealogies and the coalescent pro-cess, pp. 1–44 in Oxford Surveys in Evolutionary Biology, Vol. 7, edited by D. Futuyma, and J. Antonovics. Oxford University Press, New York.
Hudson, R. R., 2001 Two-locus sampling distributions and their application. Genetics 159: 1805–1817.
Hufford, M. B., P. Bilinski, T. Pyhajarvi, and J. Ross-Ibarra, 2012 Teosinte as a model system for population and ecolog-ical genomics. Trends Genet. 28: 606–615.
Hunter-Zinck, H., and A. G. Clark, 2015 Aberrant time to most recent common ancestor as a signature of natural selection. Mol. Biol. Evol. 32: 2784–2797.
Jensen, J. D., Y. Kim, V. Bauer DuMont, C. F. Aquadro, and C. D. Bustamante, 2005 Distinguishing between selective sweeps and demography using DNA polymorphism data. Genetics 170: 1401–1410.
Jensen, J. D., A. Wong, and C. F. Aquadro, 2007 Approaches for identifying targets of positive selection. Trends Genet. 23: 568–577.
Kaplan, N. L., R. R. Hudson, and C. H. Langley, 1989 The“ hitch-hiking effect”revisited. Genetics 123: 887–899.
Kim, Y., and R. Nielsen, 2004 Linkage disequilibrium as a signa-ture of selective sweeps. Genetics 167: 1513–1524.
Kim, Y., and W. Stephan, 2002 Detecting a local signature of ge-netic hitchhiking along a recombining chromosome. Gege-netics 160: 765–777.
King, L., and J. Wakeley, 2016 Empirical Bayes estimation of co-alescence times from nucleotide sequence data. Genetics 204: 249–257.
Kirkpatrick, M., and M. Slatkin, 1993 Searching for evolutionary patterns in the shape of a phylogenetic tree. Evolution 47: 1171–1181.
Li, H., and R. Durbin, 2011 Inference of human population history from individual whole-genome sequences. Nature 475: 493– 496.
Li, H.-P., 2011 A new test for detecting recent positive selection that is free from the confounding impacts of demography. Mol. Biol. Evol. 28: 365–375.
Li, H.-P., and W. Stephan, 2005 Maximum likelihood methods for detecting recent positive selection and localizing the selected site in the genome. Genetics 171: 377–384.
Li, H.-P., and W. Stephan, 2006 Inferring the demographic history and rate of adaptive substitution inDrosophila. PLoS Genet. 2: e166. Li, H.-P., and T. Wiehe, 2013 Coalescent tree imbalance and a
simple test for selective sweeps based on microsatellite varia-tion. PLoS Comput. Biol. 9: e1003060.
Lin, K., H.-P. Li, C. Schlötterer, and A. Futschik, 2011 Distinguishing positive selection from neutral evolution: boosting the perfor-mance of summary statistics. Genetics 187: 229–244.
Liu, X., and Y.-X. Fu, 2015 Exploring population size changes using SNP frequency spectra. Nat. Genet. 47: 555–559. MacCallum, C., and E. Hill, 2006 Being positive about selection.
PLoS Biol. 4: e87.
Matsen, F. A., 2006 A geometric approach to tree shape statistics. Syst. Biol. 55: 652–661.
Maynard Smith, J., and J. Haigh, 1974 The hitch-hiking effect of a favourable gene. Genet. Res. 23: 23–35.
Mir, A., F. Rossello, and L. Rotger, 2013 A new balance index for phylogenetic trees. Math. Biosci. 241: 125–136.
Nei, M., T. Maruyama, and R. Chakraborty, 1975 The bottleneck effect and genetic variability in populations. Evolution 29: 1–10. Nielsen, R., S. Williamson, Y. Kim, M. J. Hubisz, A. G. Clarket al., 2005 Genomic scans for selective sweeps using SNP data. Ge-nome Res. 15: 1566–1575.
Pavlidis, P., S. Hutter, and W. Stephan, 2008 A population geno-mic approach to map recent positive selection in model species. Mol. Ecol. 17: 3585–3598.
Pavlidis, P., J. D. Jensen, and W. Stephan, 2010 Searching for footprints of positive selection in whole-genome SNP data from nonequilibrium populations. Genetics 185: 907–922.
Pluzhnikov, A., A. Di Rienzo, and R. R. Hudson, 2002 Inferences about human demography based on multilocus analyses of Non-coding sequences. Genetics 161: 1209–1218.
Przeworski, M., 2002 The signature of positive selection at ran-domly chosen loci. Genetics 160: 1179–1189.
Purvis, A., and P.-M. Agapow, 2002 Phylogeny imbalance: taxo-nomic level matters. Syst. Biol. 51: 844–854.
Pybus, M., P. Luisi, G. Dall’Olio, M. Uzkundun, H. Laayouniet al., 2015 Hierarchical boosting: a machine-learning framework to detect and classify hard selective sweeps in human populations. Bioinformatics 31: 3946–3952.
Rafajlovi´c, M., A. Klassmann, A. Eriksson, T. Wiehe, and B. Mehlig, 2014 Demography-adjusted tests of neutrality based on ge-nome-wide SNP data. Theor. Popul. Biol. 95: 1–12.
Ronen, R., N. Udpa, E. Halperin, and V. Bafna, 2013 Learning natural selection from the site frequency spectrum. Genetics 195: 181–193. Ronen, R., G. Tesler, A. Akbari, S. Zakov, N. A. Rosenberg et al., 2015 Predicting carriers of ongoing selective sweeps without knowledge of the favored allele. PLoS Genet. 11: 27.
Sabeti, P. C., D. E. Reich, J. M. Higgins, H. Z. P. Levine, D. J. Richter
et al., 2002 Detecting recent positive selection in the human genome from haplotype structure. Nature 419: 832–837. Sabeti, P. C., S. F. Schaffner, B. Fry, J. Lohmueller, P. Varillyet al.,
2006 Positive natural selection in the human lineage. Science 312: 1614–1620.
Sabeti, P. C., P. Varilly, B. Fry, J. Lohmueller, E. Hostetter et al., 2007 Genome-wide detection and characterization of positive selection in human populations. Nature 449: 913–919. Saitou, N., and M. Nei, 1987 The neighbor-joining method: a new
method for reconstructing phylogenetic trees. Mol. Biol. Evol. 4: 406–425.
Scheinfeldt, L. B., and S. A. Tishkoff, 2013 Recent human adap-tation: genomic approaches, interpretation and insights. Nat. Rev. Genet. 14: 692–702.
Schrider, D. R., and A. D. Kern, 2016 S/HIC: robust identification of soft and hard sweeps using machine learning. PLoS Genet. 12: e1005928.
Sibert, A., F. Austerlitz, and E. Heyer, 2002 Wright-Fisher revisited: the case of fertility correlation. Theor. Popul. Biol. 62: 181–197.
Sneath, P. H., and R. R. Sokal, 1973 Numerical Taxonomy. W. H. Freeman and Co., San Francisco.
Tajima, F., 1983 Evolutionary relationship of DNA sequences in finite populations. Genetics 105: 437–460.
Tajima, F., 1989a The effect of change in population size on DNA polymorphism. Genetics 123: 597–601.
Tajima, F., 1989b Statistical method for testing the neutral mu-tation hypothesis by DNA polymorphism. Genetics 123: 585– 595.
Tang, H., D. O. Siegmund, P. D. Shen, P. J. Oefner, and M. W. Feldman, 2002 Frequentist estimation of coalescence times from nucleotide sequence data using a tree-based partition. Ge-netics 161: 447–459.
Teshima, K. M., G. Coop, and M. Przeworski, 2006 How reliable are empirical genomic scans for selective sweeps? Genome Res. 16: 702–712.
Tian, F., N. M. Stevens, and E. S. Buckler, 2009 Tracking foot-prints of maize domestication and evidence for a massive selec-tive sweep on chromosome 10. Proc. Natl. Acad. Sci. USA 106: 9979–9986.
Uyenoyama, M. K., 1997 Genealogical structure among alleles regulating self-incompatibility in natural populations offl ower-ing plants. Genetics 147: 1389–1400.
Vitti, J. J., S. R. Grossman, and P. C. Sabeti, 2013 Detecting natural selection in genomic data. Annu. Rev. Genet. 47: 97– 120.
Wakeley, J., and N. Aliacar, 2001 Gene genealogies in a metapo-pulation. Genetics 159: 893–905.
Wall, J. D., 1999 Recombination and the power of statistical tests of neutrality. Genet. Res. 74: 65–79.
Wall, J. D., P. Andolfatto, and M. Przeworski, 2002 Testing mod-els of selection and demography inDrosophila simulans. Genet-ics 162: 203–216.
Watterson, G. A., 1975 On the number of segregating sites in genetic models without recombination. Theor. Popul. Biol. 7: 256–276.
Watterson, G. A., 1986 The homozygosity test after a change in population size. Genetics 112: 899–907.
Wiehe, T., V. Nolte, D.ˇZivkovi´c, and C. Schlötterer, 2007 Identifi ca-tion of selective sweeps using a dynamically adjusted number of linked microsatellites. Genetics 175: 207–218.
Wright, S. I., I. V. Bi, S. G. Schroeder, M. Yamasaki, J. F. Doebley
et al., 2005 The effects of artificial selection of the maize ge-nome. Science 308: 1310–1314.
Xiang-Yu, J., Z. Yang, K. Tang, and H.-P. Li, 2016 Revisiting the false positive rate in detecting recent positive selection. Quant. Biol. 4: 207–216.
Zeng, K., Y.-X. Fu, S. Shi, and C.-I. Wu, 2006 Statistical tests for detecting positive selection by utilizing high-frequency variants. Genetics 174: 1430–1439.
Appendix
Statistical Properties ofLmajor;Lminor and other Components ofDu:
For a general tree topology, where⌊n=2⌋,G#n21;the expectations and variances of major and minor branch lengths can be analytically computed. Letx¼n2G; thus, there areC¼
n22 n2x21
possible binary vectorsBm;m¼1;2;. . .;C:EachBm
represents an array of coalescent events of the tree. The expectation ofLmajoris as follows:
EðLmajorÞ ¼E
EðLmajorjmÞ
¼1 C
X xþ2
e2¼3
X xþ3
e3¼e2þ1
. . . X
n
en2x¼en2x21þ1
E 2X
e321 i¼e2
Tiþ3 X e421 i¼e3
Tiþ. . .þ ðn2xÞ
Xn
i¼en2x
Ti !
Following this logic,EðLmajorÞcan then be rewritten as follows:
EðLmajorÞ ¼ 1
C
Xn
k¼3 X xþ2
i¼3
X n2x21
j¼1;k2x21#j#k2jþ1
k2i
j21
!
n2k
n2x2j21
!
ðjþ1ÞEðTkÞ
¼1 C
Xn
k¼3
dkEðTkÞ ¼
1 C
Xn
k¼3
2dk
kðk21Þ
wheredk¼Pxi¼þ32 Pn2x21
j¼1;k2x21#j#k2iþ1
k2i j21
n2k n2x2j21
ðjþ1Þ;andkdenotes the number of lineages (counting both
the major and the minor subtrees) during the coalescent time periodTk;andithe number of lineages (counting both the major and the minor subtrees) at a time right before the most recent common ancestor for the major subsample,ðjþ1Þthe number of
lineages in the major subtree during the coalescent time periodTk(Figure 2). As one of components indk;
n2k n2x2j21
means that there areðn2kÞcoalescent events before the time periodTk;among whichðn2x2j21Þevents occur in the major
subtree, and
k2i j21
indicates that there areðk2iÞcoalescent events between the time periodTkand the time of the most
VarðLmajorÞ ¼EðLmajor2EðLmajorÞÞ2¼E
E
ðLmajor2EðLmajorÞÞ2m
¼1 C
XnT
m¼1
E
ðLmajor2EðLmajorÞÞ2m
¼1 C
XnT
m¼1
EL2majorm22EðLmajorjmÞEðLmajorÞ þE2ðLmajorÞ
¼1 C
XnT
m¼1
EL2majorm
22EðLmajorÞ
1 C
XnT
m¼1
EðLmajorjmÞ þ
1 C
XnT
m¼1
E2ðLmajorÞ
¼1 C
XnT
m¼1
EL2majorm2E2ðLmajorÞ
¼1 C
Xxþ2
e2¼3
X xþ3
e3¼e2þ1
. . . X
n
en2x¼en2x21þ1 E
2X
e321 i¼e2
Tiþ3 X e421 i¼e3
Tiþ. . .þ ðn2xÞ
Xn
i¼en2x
Ti
2
2E2ðLmajorÞ
¼1 C
Xxþ2
e2¼3
X xþ3
e3¼e2þ1
. . . Xn en2x¼en2x21þ1
0
@Xn
i¼e2 a2iE
Ti2
þ X
i6¼j;e2,i;j#n
aiajEðTiÞEðTjÞ 1
A2E2ð
LmajorÞ
¼1 C
Xxþ2
e2¼3
X xþ3
e3¼e2þ1
. . . Xn en2x¼en2x21þ1
0
@Xn
i¼e2 8ai2
i2ði21Þ2þ X
i6¼j;e2,i;j#n
4aiaj
ijði21Þðj21Þ
1
A2E2ðLmajorÞ
¼1 C
Xxþ2
e2¼3
X xþ3
e3¼e2þ1
. . . X
n
en2x¼en2x21þ1
Xn
i¼e2
Xn
j¼i
8aiaj
ijði21Þðj21Þ
!
2E2ðLmajorÞ
whereai¼
k; ek#i,ekþ1
0; otherwise ;k2 f2;3;. . .;n2xganden2xþ1 ¼nþ1: VarðLminorÞ ¼
1 C
XnT
m¼1
E
L2minorm
2E2
Lminor
¼1 C
Xxþ2
e2¼3
X xþ3
e3¼e2þ1
. . . X
n
en2x¼en2x21þ1
E X
e221 i¼2
iTiþ X e321 i¼e2
ði22ÞTiþ X e421 i¼e3
ði23ÞTiþ. . .þ
Xn
i¼en2x
ði2nþxÞTi
!2
2E2ðLminorÞ
¼1 C
Xxþ2
e2¼3
X xþ3
e3¼e2þ1
. . . X
n
en2x¼en2x21þ1
Xn
i¼2
bi2E
Ti2
þ X
i6¼j;2,i;j#n
bibjEðTiÞEðTjÞ
2E2ðLminorÞ
¼1 C
Xxþ2
e2¼3
X xþ3
e3¼e2þ1
. . . X
n
en2x¼en2x21þ1
0
@Xn
i¼2
8bi2
i2ði21Þ2þ X
i6¼j;2,i;j#n
4bibj
ijði21Þðj21Þ
1
A2E2ðLminorÞ
¼1 C
Xxþ2
e2¼3
X xþ3
e3¼e2þ1
. . . Xn en2x¼en2x21þ1
Xn
i¼e2
Xn
j¼i
8bibj
ijði21Þðj21Þ
!
2E2ðLminorÞ
wherebiis determined by:
bi¼
i; 2#i,e2
i2k; ek#i,ekþ1;
EðKmajorKminorÞ ¼E h
EKmajorKminorjLmajorLminor i
¼E
h
EKmajorj Lmajor
EKminorjLminor i
¼E u 2Lmajor
u
2Lminor
! ¼u2
4E LmajorLminor
!
;
we have
Cov
^
umajor;^uminor
¼Cov 2Kmajor EðLmajorÞ;
2Kminor
EðLminorÞ !
¼4CovðKmajor;KminorÞ
EðLmajorÞEðLminorÞ
¼4
EKmajorKminor
2EKmajor
EKminor
ELmajor
ELminor
¼
4 u
2
4E
LmajorLminor
2u
2E
Lmajor
u
2E
Lminor !
EðLmajorÞEðLminorÞ
¼u2CovðLmajorLminorÞ
ELmajor