Application of Statistical Quality Control in
Manufacturing Process
Resmi. R
1, K. Pradeepa Veerakumari
2Ph.D Research Scholar, Dept. of Statistics, Bharathiar University, Coimbatore, Tamil Nadu, India1
Assistant Professor, Dept. of Statistics,Bharathiar University, Coimbatore, Tamil Nadu, India2
ABSTRACT: This paper discusses an attempt to perk up the quality and productivity of white cement production. The major problems faced in cement industry was the proportion of mixing the raw materials for the proportion of clinker ( main ingredient of cement) was dissimilar and inconsistent leads to varied output each day. The statistical tools used for the study was the Design of Experiments. A solution for determining the optimum mixture combination for the raw materials to improve the productivity was necessary to find. Design of Experiments was used to determine an optimum mixture for clinker production. This problem belongs to Mixture Designs and here each component has a lower and upper constrained limit. So the problem was a Constrained Mixture Design, which was used for analysis. Before designing the experiments, assumptions of DOE can be verified using various statistical techniques. After the analysis, the experiment was verified with the optimum settings. It was estimated that an amount approximately 18 lakhs could be saved from the optimum mixture obtained from the design of experiments.
KEYWORDS:Design of Experiments, Mixture Design Extreme Vertices Design, Optimum Mixture
I. INTRODUCTION
This project work is done at Travancore Cements Ltd, Nattakom, Kottayam, a pioneer in white cement manufacturing in India. The Travancore Cements Ltd is the only manufacture (perhaps) in the whole world, producing white cement from lime shell other than conventional lime stone. This project work focuses on the applications of Design of Experiments and SPC the quality & productivity of White Cement. In this chapter we discuss briefly about the organization and its functions. Subsequent chapters deal with the problem statement, literature review, analysis of the problem faced by the industry and conclusion. An overview of this project is given in the last section of this chapter.
1.1 ABOUT THE ORGANISATION
The Travancore Cements Ltd is a company under the management of government of Kerala. The Company was incorporated in the year 09-10-1946. The date of its commencement of Business was on 07-12-1946. The company became a Government company on 28-04-1989. 1989.The company started manufacturing of grey cement in the 1949 by adapting wet process. The equipment and machinery for the above plant was supplied by M/s F.L Smidth & Co, Denmark. F.L. Smidth process now is used for the manufacture of white cement. The installed capacity of the white plant is rated by M/s F.Smidth & Co, Denmark was 30,000 tpu. Till 1974 the company was manufacturing both white cement and grey cement in the same plant distributing production of the two for certain specified period. From 1975, the company manufactures only white cement. The company would successfully absorb the technology and how acquired from M/s F. Smidth & Co, Denmark for the production of white cement and improve upon the same. With internal modification indigenously affected on the core equipment and through continuous improvement in plant R&D works. The company could produce white cement the rapid capacity and the production during 1985-1986 was 45.239 tons.
production of cement plant is installed at Kakkanadu, near Ernakulam. The above plant with installed capacity of 1,200 tpu (single shift) started commercial production during March 1986, and the unit was closed on m28-04-1988 and shifted the employees on 29-04-1988.The cement plant of TCL is situated on the ban k of the Kodoor River and on the side of the State Highway MC road, 3 Kilometre away from Kottayam. The typical location of the plant makes it accessible by road as well as by water. The Travancore Cements Ltd is the only manufacture (perhaps) in the whole world, producing white cement from lime shell other than conventional lime stone. The company management is maintaining a good customer and supplier relationship. The company has always keeping the quality aspects as the prime objective. The company management is trying to achieve continuous improvement through operates training programs and other similar measures. The company had got certifications on ISO 9001:2000 for Quality Management System (QMS) in the year 1989.As per the requirements of the ISO 9001 certification the company has a definite Quality policy and the company are keeping all the three types of quality documentation, that is the Quality Manual, the Department Manual for all the departments, and the Work Instruction Manual. The quality policy of the company is as given below.
1.2 Products
Vembananad White Portland Cement is manufactured at Nattakam unit. It is the best white cement available in the country and its quality is the best among the other cement in the world market. It is the only cement plant in India and perhaps in the whole world, based on lime shell as its principal raw material. It is manufactured by the wet process using rotary kilns and special units by a process patented by M/s F.L. Smidth & Co, Denmark the renowned cement and machinery manufactures.
1.3 Raw Materials
The main raw material lime shell is dredged from Vembanad Lake. The other raw materials are silica sand, china clay & gypsum, which are received from neighbouring costal areas of Alleppy, Thiruvananthapuram and Tuticorin respectively.
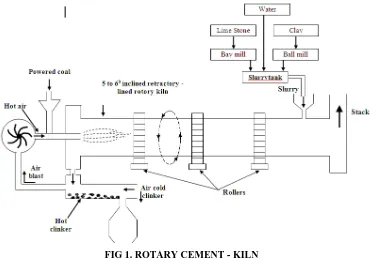
II. PROCESSDESCRIPTION
Limestone or lime shell, sand, clay and white gypsum are the four raw materials used for the manufacture. Lime shell as under water deposit available in Vembanad Lake near kumarakom and Vaikom is dredged and brought to the factory by means of power barges ,Silica sand from the coastal areas of kerala and China clay from the southern regions of Kerala namely Kundra, Sasthavattom, Chavara and Chathannur are brought to the factory and stored in the respective yards. The production process consists of grinding the raw materials to a fine stage, bending then to the point incipient fusion where clinker is formed. The Portland cement is the product obtained by cooling and grinding the clinker thus formed with gypsum to a fix powder. The production process can be mainly divided into three stages:
1. Slurry preparation
2. Clinker making
3. Clinker grinding
2.1 Specification Limits
The specification limits for the quality characteristics of the White Cement are
i. Content of Fe2O3
Upper Specification limit = 1%
ii. Content of MgO
Upper Specification limit = 6%
iii. Content of SO3
Upper Specification limit = 2.75% iv. Final Setting Time
Lower Specification limit = 80min Upper Specification limit = 100
iv. Compressive Strength for 3Days
III. PROBLEMSTATEMENT
In each day clinker production, the proportion of mixing components (raw materials) is different and therefore the response (amount of clinker produced) is also different. Also a slight variation in the response causes a large amount of loss in the production. Therefore the problem is to determine the best mixture proportion so that the proportions will produce the highest amount of Clinker [1].
The main objective of the study involves: a). To learn the Production process.
b). To find out an optimum mixture for clinker production using the techniques of Design of Experiments. c). To verify the results using the optimum settings.
FIG 1. ROTARY CEMENT - KILN
IV. METHADOLOGY The methodology used in this study includes
1. Designing an optimization experiment [3] to identify the best process performance.
2. Conducting a verification experiment to verify that the predicted solution works in practice.
V. OPTIMIZATION
An optimum mixture combination of raw materials for clinker production was determined using the techniques of Design of Experiments. The following gives the procedure used for performing the experiment [6].
Objective: The objective of the experiment is to find an optimum mixture combination for the raw materials.
Response: Clinker is the response variable. i.e for each day, the amount of clinker produced was varying due to the difference in mixing proportions of raw materials.
Factors and Levels: The factors of the experiment are lime, clay and sand. Here each factor has 3 levels.
Constrained Mixture problem. The percentage of lime varies from 79 to 82, sand varies from 9 to 16 and clay varies from 1 to 10.
Perform the experiment: For designing the experiment, the extreme points and centroid point were taken from the statistical package Minitab by putting only the constrained limits. Ten extreme points and centroid point were used for the experiment and each experiment was repeated 3 times. The amount of clinker obtained for each experiment was noted. The following table gives the extreme points used for the analysis. In this table, standard order and run order of extreme points are also given.
5.1 Mixed Experiments
Many products, such as textile fiberblends, explosives, etc., are made by mixing two or more ingredients together. The quality of the product is not dependent upon the total amount of the ingredients in the mixture, but only on the relative proportions in which they are present. If the proportion of the ith component is Xi and there are k components in the mixture, then the proportions must satisfy the constraints 0 < Xi < 1.0 for each component, and 𝑘𝑖=1𝑋𝑖 =1.In a two-component mixture problem, 0 < X1< 1.0 0 < X2 < 1.0 and X1+X2=1.0, the experimental region is all the points on the line X1=1-X2. For the three component mixture problem, the experimental region consists of a two-dimensional surface of the triangular plane [5]. The recommended experimental designs for mixture experiment differ depending on the purpose.
5.2 Extreme Vertices Design
In many mixture problems there are both upper and lower constraints on each component, i.e, Li < Xi< Ui for each component Xi. This design is desirable to determine what mixture proportions will produce the highest response. When there are three mixture components, the experimental region is irregular and the pseudo components cannot be used to define an experimental design [7]. A useful experimental design for this situation is the extreme Vertices designs .This design is used only for a constrained mixture problem. Unconstrained mixture problems are encountered when studying mixtures which may be 100 percent one component. For this type of problem, the best experimental designs available are the simplex designs. In some mixture problems it is impossible to have a product which is 100 percent pure in one component and the proportion of the three components can be varied, but must remain within certain constraints. Such problems are called Constrained Mixture Problems.
Std Order
Run Order
Lime Sand Clay Res
15 1 81 9 10 .6430
10 2 81 11 8 .6360
23 3 82 9 9 .6417
24 4 78 16 6 .6200
17 5 80 12 8 .6350
33 6 79 12 9 .6300
18 7 81 11 8 .6360
14 8 82 16 2 .6402
13 9 78 16 6 .6200
29 10 81 11 8 .6390
21 11 81 11 8 .6415
9 12 81 14 5 .6340
31 13 81 14 5 .6338
Source DF Seq SS Adj SS Adj MS F P
Regression 5 .001435 .001435 .000287 48.84 0.000
Linear 2 .001270 .000168 .000084 14.29 0.000
Quadratic 3 .000165 .000165 .000055 9.36 0.000
Residual Error
27 .000159 .000159 .000006
LackofFit 5 .000095 .000095 .000019 6.6 0.713
Ure Error 22 .000063 .000063 .000003
Total 32 .001593
Table 2: Analysis of variance for clinker ((Component proportions)
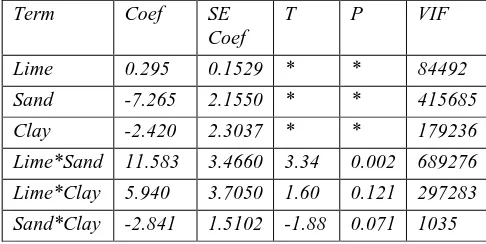
Term Coef SE Coef
T P VIF
Lime 0.295 0.1529 * * 84492
Sand -7.265 2.1550 * * 415685
Clay -2.420 2.3037 * * 179236
Lime*Sand 11.583 3.4660 3.34 0.002 689276
Lime*Clay 5.940 3.7050 1.60 0.121 297283
Sand*Clay -2.841 1.5102 -1.88 0.071 1035
Table 3: Significance of Regression model
Here R-Sq = 90.04% R-Sq (pred) = 86.78% R-Sq(adj) = 88.20%
The high R2value confirms the statistical validity of the fitted model. The model adequacy checking is also carried out for the residuals and ensured that all assumptions are satisfied. From the analysis the R2value is 8802, which means 88.2% of the information can be obtained from this model [4].
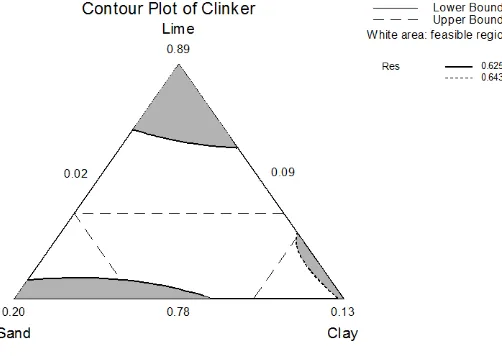
5.3RESPONSE OTIMIZATION
Parameters
Fig 2: Contour Plot of Clinker
VI. VERIFICATIONEXPERIMENT
The final step in the statistical problem solving process is to verify that the predicted solution works in practice. In order to accomplish this, a production run at the indicated settings was made. The production run at the indicated setting produced the following output.
Lime = 80% Sand = 9% Clay = 10%
Clinker = .643 Ton.
VII. CONCLUSIONSANDSUGGESTIONS
From the analysis, we find an optimum mixture for clinker production. The feasible region for the response with desirability 1 occurs when the amount of lime is 80%, Sand is 9% and Clay is 10% and the amount of Clinker is .643 Ton. On choosing these combinations every day, an amount of approximately 18 lakhs could be saved from this mixture every year.
REFERENCES
1. Cox, D.R., and Reid, N., The Theory of Design of Experiments, Chapman & Hall/CRC, New York, 2000. 2. Darper, N.R., and Smith, H., Applied Regression Analysis, John Wiley, New York, 1980.
3. Gosh, S., Statistical design and analysis of industrial experiments, md, New York, 1990.