ABSTRACT
YAO, SHANSHAN. Liquid Breakup and Atomization of Pressure Jet and Swirl Atomizers. (Under the direction of Dr. Tiegang Fang).
Liquid spray and atomization systems are widely used in industrial, commercial, and household applications. For example, pressure jet and swirl atomizer are found in liquid dispensing systems from fuel injectors in large scale power generation engines to small scale liquid sprayers, mainly due to their good atomization characteristics, low costs, and simple geometries. Therefore, it is of practical importance to understand the breakup and atomization processes in these systems.
tension is not a critical parameter that determines the primary breakup process, but it affects the downstream droplet size and distribution significantly, namely the secondary breakup or atomization process.
Liquid film thickness inside the swirl atomizer nozzle plays an important role in controlling the initial sheet thickness and primary breakup. In order to study the internal flow of swirl atomizers, a transparent swirl atomizer was designed. The liquid film thickness was measured using a high speed camera under different injection pressures. Fluids with different viscosities were applied to study their influences on the film thickness. Results show that higher pressures lead to thinner initial film thickness and as the viscosity increases, film thickness becomes thicker.
In addition, there are many practical processes involving liquid evaporation during the breakup and atomization process. In order to study the effect of evaporation on liquid jet breakup, experiments were conducted using circular and rectangular orifice nozzles under low pressures. Five ambient temperatures and ten injection pressures were used to study the liquid jet breakup length and wavelength on the jet surface. Correlations between non-dimensional number and liquid jet characteristics were developed. This work reveals that the ambient temperature has a strong influence on liquid jet breakup length under low jet velocity conditions. But as the jet velocity increases, its influence becomes weak. The surface wavelength was found in a linear relationship with jet velocity under different ambient temperatures.
Liquid Breakup and Atomization of Pressure Jet and Swirl Atomizers
by Shanshan Yao
A dissertation submitted to the Graduate Faculty of North Carolina State University
in partial fulfillment of the requirements for the degree of
Doctor of Philosophy
Mechanical Engineering
Raleigh, North Carolina 2013
APPROVED BY:
_______________________________ ______________________________
DEDICATION
BIOGRAPHY
Shanshan Yao was born in Tianjin, China. As the only child in the family, she was raised with all the love from her parents. In 2003, she left home and went to Huazhong University of Science and Technology in Wuhan, China for her undergraduate study. She received her bachelor degree of engineering in energy and power engineering and a dual bachelor degree of art in English language in 2007 before coming to the NC states for Ph.D. study.
She joined Dr. Tiegang Fang’s research group in the Department of Mechanical and Aerospace Engineering in August 2008. Her research projects are focused on liquid spray breakup and atomization. During her Ph.D. study, she designed and developed the experiment systems and studied the spray characteristics experimentally. She has gained a lot of training and experience in the process of solving challenging problems. She also practiced a half year internship with Cummins Emission Solutions in Madison, Wisconsin, where she gained valuable industrial experience.
ACKNOWLEDGMENTS
I would like to express my sincere gratitude to my supervisor, Dr. Tiegang Fang, for
letting me join his research group in 2008. I very much appreciate his expertise, understanding, and patience on coaching me during my Ph.D. study. Without his guidance and support, my research work would not have been possible.
I would like to express my gratitude to Dr. Xiaoning Jiang , Dr. William Roberts and Dr. Jack Edwards for taking the time to serve in my committee and their advices. I would like to thank Dr. Xiaoning Jiang for allowing me using his ultrasonic equipments to explore the feasibility of measuring the film thickness.
I am grateful to Mr. Rufus Richardson (Skip) and Mr. Rick Lamy for their support during my five years research. They always finished all the machine shop requests within a short time. This research cannot be finished without their help.
I am really glad that I had the opportunity to work with a lot of great people. I would like to thank Dr. Ji Zhang, Wei Jing, and Thomas Powell for their help on my research projects. Ji helped me a lot during my first year in Raleigh. Tommy assisted me on doing the experiment of film thickness measurement. Wei provided a lot of help on building the experiment facility. I really enjoy the time working with them.
After five years long-distance relationship and marriage, we will finally reunite and establish family in Oklahoma. I believe there will be a bright new life for us.
TABLE OF CONTENTS
LIST OF TABLES ... x
LIST OF FIGURES ... xi
1. INTRODUCTION ... 1
1.1. Motivation ... 1
1.2. Research objective and approaches ... 2
2. LITERATURE VIEW ... 6
2.1. Atomization process ... 6
2.1.1. Swirl atomizer ... 8
2.2. External spray characteristics ... 9
2.2.1. Spray pattern ... 10
2.2.2. Spray angle... 10
2.2.3. Breakup length ... 11
2.3. Internal flow characteristics ... 12
2.3.1. Measurement methods of liquid film thickness ... 12
2.3.2. Conductance method ... 13
2.3.3. Optical method ... 13
2.3.4. Laser-induced fluorescence/ planar laser-induced fluorescence method ... 15
2.3.5. Ultrasonic methods ... 17
2.3.6. Capacitance methods ... 18
2.3.7. Liquid film thickness inside swirl atomizer ... 19
2.4. Droplet size and distribution ... 21
2.4.1. Measurement methods ... 22
2.4.2. Representative diameters ... 25
2.4.3. Mathematical distribution function ... 25
2.5. Instability of liquid jet ... 26
2.6. Instability of liquid sheet ... 28
2.6.1. Inviscid liquid sheet ... 29
2.6.2. Viscous liquid sheet ... 30
2.7.1. Drop evaporation ... 31
2.7.2. Liquid jet evaporation ... 32
2.8. Summary ... 37
2.9. Table and figures ... 39
3. EXPERIMENTAL SYSTEM AND METHOD ... 43
3.1. Optical measurement system ... 43
3.1.1. High speed camera ... 43
3.1.2. Backlit system ... 43
3.2. Data acquisition system ... 44
3.2.1. Sensors ... 44
3.2.2. Hardware and software configuration ... 44
3.3. Droplet size measurement system ... 44
3.4. Summary ... 46
3.5. Tables and figures ... 47
4. EXPERIMENTAL STUDY ON GLYCEROL-WATER MIXTURES ... 51
4.1. Introduction ... 51
4.2. Experimental Setup and Fluid Samples ... 54
4.2.1. Fluid Samples... 55
4.3. Sensor data comparison ... 55
4.3.1. Displacement comparison ... 55
4.4. Spray spatial structure ... 56
4.5. Spray cone angle analysis ... 58
4.6. Instability of liquid sheet ... 60
4.6.1. Temporal structure comparison ... 60
4.6.2. Analysis of surface wave frequency ... 62
4.7. Droplet size distribution ... 64
4.8. Summary ... 67
4.9. Tables and figures ... 68
5. EXPERIMENTAL STUDY ON ETHANOL-WATER MIXTURES ... 99
5.1. Introduction ... 99
5.2.1. Experimental setup ... 100
5.2.2. Fluid samples... 100
5.2.3. Spray visualization ... 101
5.2.4. Transient droplet size measurement... 102
5.3. Near nozzle spray structure ... 103
5.4. Spray cone angle analysis ... 104
5.5. Breakup length analysis ... 105
5.6. Droplet size measurements... 106
5.6.1. Percentiles parameter and Sauter Mean Diameter ... 106
5.6.2. Particle size distribution ... 108
5.7. Summary ... 109
5.8. Tables and figures ... 111
6. EXPERIMENT STUDY ON LIQUID FILM THICKNESS ... 124
6.1. Introduction ... 124
6.2. Mathematical equations... 126
6.3. Experimental setup ... 127
6.3.1. Nozzle structure ... 128
6.3.2. Flow visualization ... 128
6.3.3. Experimental conditions ... 129
6.4. Results and discussions ... 130
6.4.1. Spray characteristics under steady state ... 130
6.4.2. Film thickness under different injection pressures ... 130
6.4.3. Film thickness for different viscosity fluids ... 132
6.4.4. Comparison between analytical equations and experiment ... 133
6.4.5. Effect of fluid properties ... 135
6.5. Summary ... 136
6.6. Tables and figures ... 138
7. EXPERIMENTAL STUDY ON EVAPORATION EFFECTS ... 148
7.1. Introduction ... 148
7.2. Experimental system ... 150
7.2.1. Experimental system setup ... 150
7.2.3. Spray visualization ... 151
7.3. Results and discussions ... 152
7.3.1. Mass flow rates measurement ... 152
7.3.2. Non-dimensional number... 152
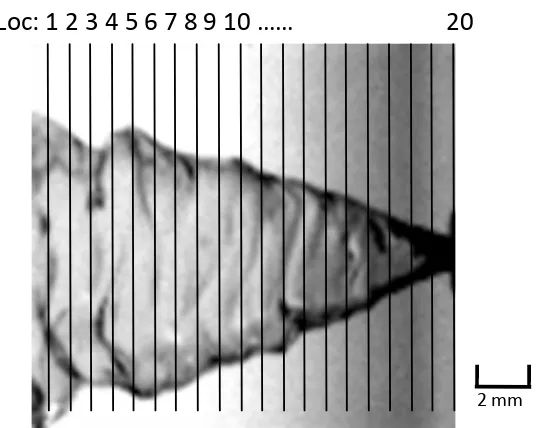
7.3.3. Breakup length analysis ... 154
7.3.4. Wave length analysis ... 156
7.4. Summary ... 157
7.5. Table and figures ... 159
8. CONCLUSIONS... 174
8.1. Conclusions ... 174
8.2. Future work ... 177
LIST OF TABLES
Table 4.1 The viscosity of glycerol-water fluid mixtures at 23°C ... 68
Table 4.2 Mean value of the spray cone angles ... 68
Table 4.3 Specified time period of wave frequency for different fluids ... 69
Table 4.4 Refractive index for different fluid mixtures ... 69
Table 5.1.Fluid properties for ethanol-water mixtures at 21oC ... 111
Table 5.2 Average spray cone angles for ethanol-water mixtures ... 112
Table 5.3 Average breakup lengths for ethanol-water mixtures ... 112
Table 5.4 Average SMD over all locations ... 113
Table 6.1. Atomizer specifications ... 138
Table 6.2. Analytical and empirical equations for the sheet thickness ... 138
Table 7.1 Classification of jet breakup regimes... 159
Table 7.2 Geometrical details of the orifices ... 159
Table 7.3 Physical properties under different temperatures ... 159
Table 7.4 Reynolds number for different flow conditions ... 160
Table 7.5 Weber number of liquid for different flow conditions ... 160
LIST OF FIGURES
Figure 2.1 Schematic of the automated optical film thickness measurement system [30] ... 39
Figure 2.2 Theoretical schematic of the fluorescent dye technique [31] ... 39
Figure 2.3 Diagram of a flow loop [33] ... 40
Figure 2.4 Test section for PLIF measurements [33] ... 40
Figure 2.5 Schematic of the ultrasonic fluid thickness measurement system [36] ... 41
Figure 2.6 Schematic of the experimental apparatus for liquid film thickness [43] ... 41
Figure 2.7 Schematic of the experimental apparatus for evaporation jet analysis [76] ... 42
Figure 3.1 Standard flood illumination system used for backlit imaging [77] ... 47
Figure 3.2 Optimized lighting system [77] ... 47
Figure 3.3 Sensors installed on a trigger sprayer ... 48
Figure 3.4 Signal conditioning modules and data acquisition system ... 48
Figure 3.5 LabView interface ... 49
Figure 3.6 Measurement window of SprayTec software ... 49
Figure 3.7 Setup of droplet size measurement ... 50
Figure 3.8. Laser diffraction technology[47] ... 50
Figure 4.1 Schematic of the experimental setup ... 70
Figure 4.2 Transient dispensing piston displacements of different glycerol-water mixtures . 71 Figure 4.3 Start stage of spray development for different glycerol-water mixtures ... 72
Figure 4.4 Developed stage of spray development for different glycerol-water mixtures ... 73
Figure 4.5 The ending stage of spray development for different glycerol-water mixtures .... 74
Figure 4.7 Global spray structure of the trigger spray and the calculated cone angle ... 75 Figure 4.8 (a)-(d) The image processing steps. (e) Clear surface profiles obtained ... 76 Figure 4.9 The transient changes of spray angle and mean value over time for 0% to 80% glycerol-water mixtures ... 77 Figure 4.10 The calculated spray angle and the error bars for glycerol-water mixtures ... 77 Figure 4.11 An example of spatiotemporal diagram for local frequency analysis ... 78 Figure 4.12 Spatiotemporal diagram at Location 1 for different fluids at starting, developed, and ending stage from the left to the right ... 78 Figure 4.13 Spatiotemporal diagram at Location 2 for different fluids at starting, developed, and ending stage from the left to the right ... 79 Figure 4.14 Spatiotemporal diagram at Location 3 for different fluids at starting, developed, and ending stage from the left to the right ... 80 Figure 4.15 Spatiotemporal diagram at Location 4 for different fluids at starting, developed, and ending stage from the left to the right ... 81 Figure 4.16 Discredited locations for surface wave analysis ... 82 Figure 4.17 Developed temporal structure for fluid mixtures with different viscosity ... 83 Figure 4.18. The spatiotemporal diagrams for different viscosity fluids at Location 6 at different time period ... 84 Figure 4.19 (a) A typical detected edge on the original image of 70% glycerol at Location 1 with a time period of 394.4~406ms (b) Fast Fourier Transformation to calculate wave
Figure 4.21 Wave frequency with standard deviation for the five repeatable measurements 86
Figure 4.22 Dv(10) for different fluids at Location H7V0 ... 87
Figure 4.23 Dv(50) for different fluids at Location H7V0 ... 87
Figure 4.24 Dv(90) for different fluids at Location H7V0 ... 88
Figure 4.25 SMD for different fluids at Location H7V0 ... 88
Figure 4.26 The averaged SMD for different fluids at Location H7V0 ... 89
Figure 4.27 The time-averaged droplet size distributions for different fluids at H7V0 ... 90
Figure 4.28 The time-averaged droplet size distributions for different fluids at H9V0 ... 93
Figure 4.29 The time-averaged SMD for different fluids at different locations from top to bottom: H7V0, H8V0, and H9V0 ... 96
Figure 4.30 The time-averaged SMD for different fluids at different vertical locations ... 97
Figure 4.31 The averaged SMD over all the locations for different fluids ... 98
Figure 5.1 Starting stage of spray for different ethanol-water mixtures ... 114
Figure 5.2 Developed stage of spray for different ethanol-water mixtures ... 115
Figure 5.3 Ending stage of spray for different ethanol-water mixtures ... 116
Figure 5.4 Global spray structure of spray and the calculated spray cone angle ... 117
Figure 5.5 The average spray cone angle for different fluids and the error bars are based on 5 repeated runs ... 117
Figure 5.6 Calculation of the breakup length in a global near nozzle spray image ... 118
Figure 5.7 The average breakup length and the error bars for different fluids ... 118
Figure 5.9 The average SMD with error bars at different vertical locations: (a) 2.54cm from
the axis; (b) 5.08cm from the axis; and (c) 7.62cm from the axis ... 120
Figure 5.10 The average SMD with error bars at different horizontal locations (a) and the average SMD over all locations (b) ... 121
Figure 5.11 The droplet size distribution at different vertical locations ... 122
Figure 5.12. The droplet size distribution at different horizontal locations (a) and the averaged particle size distribution over all locations (b) ... 123
Figure 6.1.Schematic of experimental setup ... 139
Figure 6.2 Geometry of the transparent swirl atomizer ... 140
Figure 6.3 Global spray structure and liquid film structure inside the nozzle ... 140
Figure 6.4 Experimental mass flow rates at different fluid pressures... 141
Figure 6.5 Spray structure under different pressures for water and 40% glycerol/water mixtures... 141
Figure 6.6 Spray cone angle under different injection pressures ... 142
Figure 6.7 Spray cone angle for different glycerol/water mixtures ... 142
Figure 6.8 Breakup lengths under different injection pressures ... 143
Figure 6.9 Breakup lengths for different glycerol-water mixtures ... 143
Figure 6.10 Liquid film images under different pressures for 30% glycerol/water mixture 144 Figure 6.11 Measured film thickness and fitting curves under different injection pressures 144 Figure 6.12 Liquid film images of liquid with different viscosity under 0.2Mpa ... 145
Figure 6.14 Comparison between measured liquid film thickness and estimated film
thickness previous empirical equations of 70% glycerol-water mixture ... 146
Figure 6.15 Comparison between measured liquid film thickness and estimated film thickness previous empirical equations in 0.14Mpa ... 147
Figure 7.1 External flow structure of circular jet in different breakup regimes: (a) Rayleigh breakup regime. (b) First wind-induced breakup regime. (c) Second wind-induced breakup regime. (d) Atomization regime. ... 161
Figure 7.2 Experiment setup of pressure injection system ... 162
Figure 7.3 Details of the plain-orifice nozzle ... 162
Figure 7.4 Mass flow rates of two liquid jets under different injection pressures ... 163
Figure 7.5 Evaporation rate for circular orifice nozzle ... 163
Figure 7.6 Evaporation rate for rectangular orifice nozzle ... 164
Figure 7.7 Reynolds number of liquid under different injection pressures ... 164
Figure 7.8 Weber number of air under different temperatures for circular jet ... 165
Figure 7.9 Weber number of air under different temperatures for rectangular jet ... 165
Figure 7.10 Transient images of circular jet under different pressures at 20oC ... 166
Figure 7.11 Transient images of circular jet under different pressures at 30oC ... 166
Figure 7.12 Transient images of circular jet under different pressures at 40oC ... 167
Figure 7.13 Transient images of circular jet under different pressures at 50oC ... 167
Figure 7.14 Transient images of circular jet under different pressures at 60oC ... 168
Figure 7.15 Breakup lengths under different temperatures for circular orifice nozzle ... 168
Figure 7.17 Transient images of rectangular jet under different pressures at 30oC ... 169
Figure 7.18 Transient images of rectangular jet under different pressures at 40oC ... 170
Figure 7.19 Transient images of rectangular jet under different pressures at 50oC ... 170
Figure 7.20 Transient images of rectangular jet under different pressures at 50oC ... 171
Figure 7.21 Breakup length change for rectangular orifice nozzle ... 171
Figure 7.22 Transient and averaged images of rectangular jet at 20 oC... 172
1.
INTRODUCTION
1.1.
Motivation
Many industrial applications rely on spray systems to transform continuous liquid flow into discontinuous liquid droplets in order to effectively deliver the working fluid in a larger space and shorter time. These spray systems are found in but are not limited to spray drying [1], cooling [2, 3], painting, cleaning, drug delivery, internal combustion engines [4– 6], aircraft turbine engines [7–9], sprinklers and fire suppression systems. The length scales of the formed droplets span from micrometers to centimeters. The time scales are from milliseconds to seconds in transient operations. Steady state operations are also normally found in spray systems. This variety results in a wide range of spray system designs. In addition to the spray system design, the characteristics of sprays are mainly governed by a few physical parameters, including spray injection pressure, ambient thermal conditions, such as pressure and temperature, and the physical and chemical properties of the working fluids.
simplicity of the pressure swirl atomizer design also offers flexibility in terms of the experimental design. It is generally agreed that the in-nozzle flow characteristics are very influential to spray development. Compared to the relatively better understood surface instability, however, the influence of the upstream in-nozzle flow on the spray development is still being very actively explored mainly due to the lack of good experimental measurement approaches. With ever-increasing computing power, computational fluid dynamics (CFD) has become an indispensable tool to study spray and atomization phenomena. The high fidelity of the computer modeling relies on reliable quantitative experimental measurements. But such quantitative data are difficult to find, or if any, they usually subject to large uncertainties and are inconsistent in different literature.
All these facts have motivated the author’s great interests in studying spray and atomization phenomena. Consequently, the author has conducted several research projects that were particularly designed to address the aforementioned problems. These projects also reveal that with the advancements in high speed image capture and the associated high quality image processing and analytic tools, quantitative measurements of spray characteristics can be achieved. The experimental approaches and results are reported in the rest of this thesis.
1.2.
Research objective and approaches
models. Furthermore, Fast Fourier Transform (FFT) and non-dimensional analyses both lead to quantitative and conclusive results that can be used to compare similar experiments conducted by other research groups in a consistent manner. To describe the designed experimental projects and the associated outcomes, the thesis is organized as follows.
Chapter 2 reviews a number of research papers that are relevant to the present work. The chapter starts from introducing the definitions of the commonly used terminologies for spray characterization, including atomization, spray cone angle, breakup length, penetration, and film thickness. This is followed by a discussion on liquid instability and its effects on spray development. Several classical papers and their conclusions are also briefly discussed. The chapter includes some details on the experimental methods for droplet size and distribution measurements, as well as the underline principles of the experiment apparatus. Previous research on evaporating sprays is also a subject of the present chapter. Note that Chapter 2 is only a brief summary of several classic studies. More detailed reviews on the studies that are closely related to the author’s research projects are provided in the introduction sections of Chapters 4 to 7.
Chapter 3 mainly describes the experimental equipments used in this study, including a high speed camera, data acquisition system, software environments, and spray droplet size measurement system. Detailed experimental setup and configurations are the subjects of Chapters 4 to 7 for different research projects.
simulate fluids with different viscosities while keeping other physical properties relatively constant. This allows the experimental results mainly reflect the contributions due to liquid viscosity. The effects of liquid viscosity on the spray global structure and droplet size are discovered in this chapter.
Chapter 5 studies the effect of liquid surface tension on spray characteristics in swirl atomizers. Similar experimental approaches employed in Chapter 4 were used in the research project described in Chapter 5. But different from Chapter 4, the fluid mixtures were made by blending ethanol and water in different ratios to simulate fluids with different surface tension while keep other fluid properties relatively unchanged. In this way, the experimental measurements mainly reveal the contributions due to liquid surface tension. Conclusions are also made regarding to the relative importance of liquid viscosity and surface tension in different sprayer configurations in this chapter. However, evaporation of ethanol is found to influence the breakup and atomization process, which further motives the work in Chapter 7.
Chapter 6 mainly focuses on the study of liquid film thickness in spray nozzles. A transparent nozzle was designed in order to visualize the in-nozzle flow. Different from the previous two studies, the liquid flow and spray were maintained at steady state. The image processing methods used in Chapters 4 and 5 for transient spray characterization are modified in this chapter in order to capture the surface of the liquid film formed on the nozzle orifice wall. This is critical for reporting liquid film thickness accurately.
temperature control is used to provide proper thermal conditions. The main purpose of this project is to investigate whether the evaporation has an important impact on liquid jet breakup. If so, in which region the evaporation effect is the most influential. The two questions are addressed by using non-dimensional analysis on the measured data. Similar to Chapter 6, this study also works on steady state jets.
Chapter 8 highlights the important findings from the research projects conducted by the authors. The chapter also integrates the conclusions that have been drawn in Chapters 4 to 7. Based on the results and findings in this work, an outlook to the possible future directions is also provided.
2.
LITERATURE VIEW
2.1.
Atomization process
Atomization is the process in which a liquid jet or sheet is disintegrated by kinetic energy. It transforms bulk liquid into spray and other physical dispersions of small drops or droplets. The resultant suspension of fine droplets in a surrounding gas is termed spray, mist, or aerosol. This process can be created by exposuring to high velocity air or gas, or as a result of mechanical energy applied externally through a rotating or vibrating device. Numerous spray devices have been developed and designed as atomizers or nozzles.
There are many industry spray applications, such as spray drying, spray cooling , and powdered metals in processing application; humidification and misting, evaporation and aeration in treatment application; surface treatment and spray painting in coating application; spray combustion used in oil burners, rocket, gas turbine, direct inject or port fuel injected engines.
include pressure atomization and rotary atomization. In the second category, a relatively slow-moving liquid is exposed to a stream of gas with high velocity. Two-fluid atomization and whistle atomizers are usually considered to be the second category.
At a low injection pressure, the liquid emerges at a low velocity as a thin distorted pencil-shaped stream. For injection pressures in excess of the ambient pressure by approximately 150 kPa, the liquid issuing from the orifice forms a high velocity jet and disintegrates rapidly into droplets. Increasing the injection pressure can enhance the flow velocity of the liquid jet, leading to an increase in both the level of turbulence in the liquid jet and the aerodynamic drag forces exerted by the surrounding medium, and thereby promoting the disintegration of the liquid jet.
a very high pressure (>80 MPa) is required to allow the fuel to penetrate into the combustion chamber and disintegrate into a well-atomized spray. One of the limitations of plain-orifice atomizers is the narrow spray cone generated. For most practical applications, large spray cone angles are desirable. To achieve a wide spray cone, a pressure-swirl (simplex) atomizer can be used.
2.1.1. Swirl atomizer
A swirl atomizer (simplex) has a swirl chamber with a number of tangential inlets (holes or slots) and a circular outlet orifice. During the operation, a liquid is introduced into the swirl chamber through tangential ports and allowed to rotate. If the liquid pressure is sufficiently high, a high angular velocity is attained and an air-cored vortex is created. The swirling liquid then flows through the outlet of the swirl chamber and spreads out of the orifice under the action of both axial and radial forces, forming a tulip-shaped or conical sheet beneath the orifice. The sheet subsequently disintegrates into droplets. The liquid-air interaction, liquid surface tension and viscous forces are the primary factors governing the liquid breakup process.
Various hollow-cone swirl atomizers have been developed for combustion applications. In these atomizers, swirl chambers may have conical slots, helical slots or tangential slots. Using thin, removable swirl plates to cut or stamp the swirl chamber entry ports leads to economies of the atomization systems if spray uniformity is not a primary concern. Large simplex atomizers have found applications in utility boilers and industrial furnaces. Zhao et al. [10] concluded that swirl atomizers have been dominantly used in direct injection (DI) gasoline engines because of the enhanced atomization characteristics through the breakup of a conical liquid film, which is initially formed inside the nozzle. Zhao et al. [11] also summarized the researches on DI gasoline engines and revealed that the DI gasoline engines require a well-atomized and well-stratified mixture near the spark plug.
2.2.
External spray characteristics
2.2.1. Spray pattern
Spray pattern (mass distribution) is an important parameter that affects combustion efficiency and pollutant formation. Studies on spray pattern are useful in identifying the uniformities of spray. Cohen and Rosfiord [18] and Santolaya [19] studied the spray pattern resulting from swirl atomizers and concluded that the regime of spray evolution dictates the mass distribution. It was found that under low flow rate conditions the spray was a collapsed single and coarse jet with the maximum mass flux in the center. At higher flow rates the spray revealed a well-developed and symmetric hollow-cone structure. Santolaya et al. [20] found a sharp rise in the axial volumetric flux along the radial direction, which indicates liquid distribution in an annular region and formed a fully developed hollow cone. The maximum axial flux was found to decrease with increasing pressure due to the progressive spatial distribution of the liquid droplets.
2.2.2. Spray angle
without an experimental investigation into the specific configuration. Several studies have shown that the nozzle dimension and fluid properties have large impacts on spray angle. Chen [21] found that the spray angle increases continuously at low injection pressure and reaches a maximum at high injection pressures (0.34Mpa to 1.72Mpa). Ramamurthi and Tharakan [22] found that increasing swirl number leads to an increase in the spray angle in an experimental study. Spray angles produced by higher swirl number atomizers are found almost independent of injection pressures. Jeng et al. studied the liquid sheet emanating from simplex fuel nozzle using both computational and experimental methods. They found an increase in the length/diameter ratio of the final discharge orifice reduces the spray cone angle. They also revealed that liquid viscosity reduces the spray cone angle quantitatively [23].
2.2.3. Breakup length
2.3.
Internal flow characteristics
Film thickness is the thickness of an annular liquid sheet as it discharges from the atomizer. In pressure swirl atomizers, the liquid emerges from the nozzle as a thin conical sheet that rapidly attenuates as it spreads radially outward. The liquid sheet further disintegrates into ligaments and then drops. In pressure swirl atomizers, the thickness of the liquid film in the final nozzle exit is directly related to the area of the air core. It has been recognized that the thickness of the annular liquid film produced at the nozzle exit has a critical effect on the mean drop size of the spray [25]. Rizk and Lefebvre [26] used a theoretical approach to investigate the internal flow characteristics of swirl atomizers. They studied the effects of atomizer dimensions and operating conditions on spray cone angle, velocity, and the film thickness of the annular liquid film formed at the discharge orifice. Their theory and experiment both indicate that a higher pressure drop produces a thinner liquid sheet. Increasing the inlet area raises the flow rate through the nozzle, which results in a thicker film.
2.3.1. Measurement methods of liquid film thickness
The characterization of the thin liquid film in the orifice is important to many applications, such as in steam power generation, oil delivery and refinement, chemical processing, and refrigeration systems. Accurate measurements of the thickness of the thin liquid films are crucial to study the heat and mass transfer characteristics in these applications.
These measurement techniques can be categorized into intrusive and non-intrusive measurements. The intrusive methods, including electrical conductance techniques, and the non-intrusive methods, including optical, laser-induced fluorescence, ultrasonic and capacitance techniques, are reviewed in this section.
2.3.2. Conductance method
2.3.3. Optical method
Optical methods used to measure liquid film thickness include but are not limited to laser scattering and laser shadow methods. Both of these methods use a single light source. With the laser scattering technique, the measured liquid with seeded particles is illuminated. The amount of the light scattered by the particles depends on the film thickness.
Salazar and Marschall [28] used a laser beam to illuminate a liquid seeded with latex particles in their study. The light intensity scattered from the liquid film was measured using photodiodes. The laser shadow technique illuminates the liquid interface where the laser is both reflected and refracted. A variation in the light intensity is created and measurable. This method was employed by Zhang et al. [29] who measured the thickness of falling liquid films between 0.4mm and 0.9mm. In their experiments, a laser light sheet was reflected and refracted by a liquid film, which generated a shadow region. The liquid film thickness was determined by measuring the light intensity using camera and photodiode. The variation of the amplitude of the film waves can be measured from the output of the photodiode. The average film thickness can be measured from pictures of the shadow using computer aided image analysis. Compared to the popular conductance probe method, the optical method has the advantages of convenience, noninvasiveness, higher spatial and temporal resolution, and smaller hysteresis. More importantly, it does not disturb the liquid surface.
of a liquid film flowing over a transparent wall. The reflected light generates an image on the outside of the wall which is captured and digitized using a charge coupled device (CCD) camera. The image is processed to determine the positions of the reflected light rays with which the film thickness is calculated. An automated calibration procedure allows for the determination of the necessary physical parameters. The advantage of this method is the index of refraction of the test fluid or the test section wall need not be known.
2.3.4. Laser-induced fluorescence/ planar laser-induced fluorescence method
Using digital methods to capture and analyze optical images have largely improved the reliability and repeatability of laser-induced fluorescence methods. For example, Schubring et al. developed a planar laser-induced fluorescence method to determine the film thickness distributions in upward vertical annular flows [33], as shown in Figure 2.3 and Figure 2.4. An advantage of this method is that the variation of the film thickness can be determined instantaneously over a wide area on the optical images. The fluorescence intensity increases with liquid film thickness at a fixed dye concentration. Therefore, it is possible to calibrate the light intensity change by viewing the film at the wavelength of the fluorescence related to the film thickness.
Comparing to the conductance method, optical and laser-induced fluorescence techniques have several major advantages:
1) It is able to visualize the thin film of annular flow based on the produced images. Conductance probes produce no data beyond a time-series of conductivity or a related parameter.
2) Unlike the implicitly spatially-average conductance probe data, high axial resolution can be obtained in images.
3) Small scale measurements are impossible with conductance probe, while optical and laser-induced fluorescence techniques can detect very small amplitude between the base films. Flow waves can be observed directly from the images.
processing algorithms, the processed results can be compared to raw images in optical methods. However, with the conductance probe method, it is not easy to identify the errors in the results and is not possible to reprocess the data.
5) Optical and laser-induced fluorescence are non-intrusive methods. They do not require the installation of a probe into the flow. Thus they do not disturb the film flow and produce vortex that may possibly lead to erroneous results.
However, careful calibration and accurate images processing are very important in order to achieve acceptable precisions using optical methods.
2.3.5. Ultrasonic methods
The propagation of sound has been used as a diagnostic tool to measure and characterize a variety of thin layers and films, such as oil films on lubricated components and thin plates of polymers. Many of these investigations are conducted by examining the reflection of an ultrasonic pulse generated and received by the same transducer in a normal-incidence fashion. The film thicknesses are determined using both time domain and Fourier analysis techniques.
liquid-solid boundary. The transit time of a pulse is used to measure the film thickness. As a result, such technique is applicable to a large range of film thicknesses.
Chang et al. first showed that an ultrasonic transducer can be used to measure film thickness [34]. They reported the use of an ultrasonic transducer to identify the flow regimes in two-phase flows in 1982. Lu et al. used an ultrasonic transducer to measure the condensate film thickness on the horizontal lower surface of a rectangular duct [35]. The liquid film thickness was determined from the product of the transit time and the sound velocity in the liquid phase. With such measurements at five different locations on the condensing surface, both the local and average convective heat transfer coefficients were obtained.
Chen et al. developed a pulse-echo ultrasonic system to measure the thickness of condensate liquid films in real time [36], as shown in Figure 2.5. The reflected energy due to the broadband ultrasonic pulse falls in equally spaced narrowband frequency ranges where the spacing depends on the film thickness. Because the echo received by the transducer from the copper/liquid interface is much larger than the filtered signal of interest from the fluid layer, the signal must be normalized by subtracting the effect of the copper/liquid interface echo before this analysis can be performed.
2.3.6. Capacitance methods
between the plates and the distance between the plates. So the value of the capacitance directly indicates the film thickness. This method requires electrical isolation of the contact elements, otherwise it would give a composite film thickness value over the whole surface. It also requires the positioning and alignment of small surface-mounted sensors.
2.3.7. Liquid film thickness inside swirl atomizer
Among the discussed methods, the electric conductivity method and photography technique have been dominantly employed for the liquid film thickness measurement in swirl atomizers. In the conductance method, an electric potential is applied to the electrodes which enclose the test liquid film and the current between them is measured. Because the conductivity is correlated to the film thickness, the resulted current or voltage can therefore be used to quantify the film thickness. Suyari and Lefebvre used this method in a film thickness measurement inside an atomizer [39]. They produced flow water through the atomizer and measured the electrical conductance. The conductivity of water between the two electrodes is known. This measurement provided a direct indication of the average liquid thickness in the flow path between the two electrodes. The system was calibrated by flowing water through the nozzle and measuring electrical conductance with a plastic rod of low electrical conductivity inserted along the axis of the nozzle discharge orifice. By repeating this measurement with rods of different diameter, a calibration curve was obtained to correlate the voltmeter reading to the film thickness.
[40]. However, they designed a transparent injector that enables them to visualize the in-nozzle flow and to reveal the relation between variations of the air core in the swirl chamber and the liquid film thickness. This provides a more accurate measurement technique to calibrate various liquid film thicknesses. In their experiment, the injector parts were changeable in order to investigate the variation of liquid film thickness with the geometric parameters of the injector.
However, it is noted that the electrical conductance method is intrusive and is only suitable for conducting liquids. Consequently, most of the experiments using the electric conductivity method were performed in large nozzles due to the difficulty in electrode installation within the very limited in-nozzle space.
to the very small area of the film flow inside the nozzle and a copper diffuser was installed to distribute the light uniformly. The error in liquid film thickness measurement was estimated and then corrected based on the geometric optics.
Instead of measuring the liquid film directly, many researchers also designed experiments with indirect methods to measure the air core diameter. In these experiments, the liquid film thickness was determined by the air core formed in the swirl chamber because the difference between the measured air core diameter and the nozzle orifice diameter is equal to twice of the film thickness assuming the symmetry. Kutty used an indirect measurement method to study the influence of liquid pressure on air core size[44].
The images of the upstream liquid through the nozzle orifice were recorded by a camera. A transparent window at the rear of the swirl chamber was installed in order to achieve enough illumination. The air core diameters were then measured by enlarging them in a microfilm reader.
2.4.
Droplet size and distribution
important in spray drying and must be closely controlled to achieve the desired rates of heat and mass transfer.
2.4.1. Measurement methods
There are numerous methods applied in measuring droplet size and distribution, and they can be divided into three categories: mechanical, electrical and optical methods. The mechanical methods involve the collection of a spray sample on a solid surface or in the cell containing a specific liquid. After that, the sizes of the droplet impressions are measured by using photograph, or with the aid of microscope. This method is simple and has many variations, and now been replaced by photographic and optical methods.
Optical measurement can be divided into imaging and non-imaging methods. The imaging methods usually use high speed photography and holography, but have the limitation of detectable droplet sizes due to the resolution of high speed camera. Non-imaging methods can be divided into two classes. One is counting droplet size individually, while the other is measuring large number of droplets simultaneously. Each method has its own advantages and limitations, but the most important advantage is that the optical methods do not need the insertion of a physical probe into the spray.
High-speed visualization is often used to provide instantaneous images of the drops in a spray for subsequent counting or analysis. The method is nonintrusive, but cannot show the temporal distribution of the drop size directly. The spatial distribution of drop sizes taken by instantaneous images can be converted into the true temporal distribution by multiplying the number of droplets in any given size range by the average velocity for that size range.
provided the signal to noise ratio is sufficient. The instrument response is linear over the entire working range and has a large dynamic size range. The method has been implemented into a phase Doppler particle analyzer (PDPA). The various mean sizes, mass flux, number density, and mean velocity can all be measured using PDPA.
2.4.1.1. Light diffraction technique
The theory for the scattering properties of particles of arbitrary size and arbitrary refractive index occurring in polydispersion of finite optical depth was first derived by Dobbins [47]. For a polydisperse system, the radiant intensity ( )I scattered at a small angle
from the forward direction due to an incident planar wave of irradiance E0 can be written as 2 2 2 2 2 1 2 0
( ) 2 ( ) 4
1
16 ( 1)( 1)
I D J m
E m m
(2-1)
where E0 is incident irradiance, ( )I is radiant intensity, is scattering angle, is size numberd/, where is the wavelength of incident light, m is refractive index, J1is
Bessel function of first kind of order unity.
The normalized integrated intensity of forward-scattered light, ( )I , due to a poly-dispersion of relatively large particles is
2 4
1 0
4 0
2 ( )
[ ] ( ) ( ) ( ) r r J
N D D dD I
N D D dD
(2-2)2.4.2. Representative diameters
Droplet diameter is a very important parameter to describe a spray. The mean droplet size and size distribution depend on many variables, such as operation conditions, liquid properties, and nozzle geometry. A high injection pressure, low ambient pressure and/or small orifice diameter lead to small droplet sizes. The concept of the mean diameter has been generalized and its notation standardized by Mugele and Evans [48].
0 0 ( / ) ( ) ( / ) m m D a D a b ab D b D
D dN dD dD D
D dN dD dD
2.4-3)where a and b can take on any values corresponding to the effect investigated, and the sum a+b is the order of the mean diameter. Equation (2-3) represents a relationship between the angular distribution of scattered light and the particle size distribution. For example, D10
is the linear average value of all the drops in the spray; Sauter mean diameter(SMD)D32is
the diameter of a drop whose ratio of volume to surface area is the same as that of the entire spray.
2.4.3. Mathematical distribution function
2.5.
Instability of liquid jet
The spray characteristics discussed in the previous sections, such as spray angle, the spray drop size, and the jet breakup length, have been related to the instability mechanism. The instability and breakup of liquid jets into drops has been a subject of interest for more than 100 years. A liquid jet emanating from a nozzle into an ambient gas may breakup into small drops when it is subjected to disturbances. These disturbances may be in the form of surface displacement, pressure or velocity fluctuations in the supply system or on the jet surface, as well as fluctuations in liquid properties such as viscosity
and surface tension due to variation in thermal conditions. Pressure disturbances are normally attributed to sound waves on the jet. Surface disturbances can be created using a piezoelectric transducer at the nozzle which contracts and expands periodically by applying a periodic voltage on it. Velocity disturbances can be applied by using an oscillating flow. Temperature disturbances can be introduced by applying a periodic heating on a jet. Temperature changes the liquid surface tension, which affects the capillary action of the jet. Disturbances introduced by adding surfactants to the liquid jet are similar to the effect due to temperature.
After numerous experimental investigations and the qualitative descriptions obtained from the linear stability theory, the disintegration of a liquid jet can be classified into distinct regimes of breakup. The different regimes are characterized by the appearance of the jet depending upon the operating conditions. The regimes are due to the action of dominant forces on the jet, leading to its breakup, and it is important that these forces can be identified in order to explain the breakup mechanism in each regime. As reviewed by Grant and Middleman, four different breakup regimes were defined depending on the interaction of the liquid inertia, surface tension, and aerodynamic forces acting on the jet [50]. In order to form a jet, the liquid must have sufficient momentum else it is discharged in the form of dripping
drops. Once the initial momentum is gained, the jet breakup length increases linearly with the jet
velocity. This linear variation of the breakup length with jet velocity corresponds to the Rayleigh
jet breakup mechanism. This is caused by the growth of asymmetric oscillations on the jet
surface, induced by surface tension. Drop diameters exceed the jet diameter as predicted by
Rayleigh. Thereafter, the curve reaches a peak and then decreases. This regime is termed as the
first-wind induced regime. Here, the surface tension effect is augmented by the relative velocity
between the jet and the ambient gas, which produces a static pressure distribution across the jet,
thereby accelerating the break up process. Similar to Rayleigh breakup regime, the breakup takes
place in many jet diameters downstream of the nozzle.
Reitz and Bracco [52], at sufficiently high jet velocities, jet surface disruption occurs prior to the jet core. Hence, they defined two different breakup lengths, the intact surface length and the intact core length, to clearly demarcate the two phenomena. In Rayleigh and first wind-induced regimes, the jet breaks simultaneously over the entire cross section and hence, the two lengths coincide. In the high jet velocity regime, where the jet disruption initiates at the surface and eventually reaches the core, the intact surface length is different from the intact-core length. This regime is called the second wind-induced regime. Owing to high relative velocity between the jet and the ambient gas, the jet is subjected to short wavelength and thus, high energy surface waves. This wave growth is opposed by the surface tension. Jet disintegrates several diameters downstream the nozzle and the average drop diameter is much smaller than the jet diameter. The regime where the intact surface length becomes zero is identified as the atomization regime. The breakup curve follows the trend suggested by Haenlein [51] that the breakup length drops to zero. Here, the jet disrupts completely at the liquid-gas interface and the drops formed are much smaller than the jet diameter. So far, the disruption of the jet at higher jet velocities has been attributed to the effect of surrounding gas.
2.6.
Instability of liquid sheet
liquid sheet thickness. Therefore, by forming a thin liquid sheet one can generate small droplets. Liquid sheet instability is due to the interaction between the liquid and its surrounding fluid. When the amplitude of a perturbation grows and reaches a critical value, the sheet is disintegrated forming liquid ligaments. The linear and nonlinear instability of an inviscid and viscous liquid sheet are discussed in this section.
There have been many studies on the temporal and spatial instability of liquid sheet. Among these, Dombrowski and his coworkers conducted extensive studies on the factors influencing the breakup of sheets and obtained information on the wave motions of high velocity sheets [53–56]. More recent analyses are provided by Senecal et al. [57], and Rangel and Sirignano [58].
In a two-dimensional liquid sheet, the sheet instability is mainly due to the aerodynamic interactions between the liquid and its surrounding gas. Contrary to the cylindrical liquid jets, surface tension forces tend to stabilize a planar liquid sheet. Generally, two modes of oscillations are considered: symmetric and antisymmetric. In the symmetric mode, also referred to as the dilational mode or varicose wave, the middle plane is undisturbed. In the antisymmetric mode, also referred to as sinuous wave, the free surfaces move in the same direction and with the same magnitude. Squire [59] and Hagerty and Shea [60] showed that for the inviscid sheets, the antisymmetric mode is the dominant mode of disturbance.
2.6.1. Inviscid liquid sheet
sinuous (antisymmetric) and dilational (symmetric) waves, as well as for different Weber numbers and density ratios [61]. Their results also showed that the varicose mode is more unstable for density ratios near unity. It is clear that for the low Weber number case, the growth of sinuous waves dominate the growth of varicose waves due to the higher growth rates throughout the range of instability.
Dombrowski and John combined a linear model for temporal instability and a sheet breakup model for an inviscid liquid sheet in a quiescent inviscid gas, to predict the ligament and droplet sizes after breakup [56]. Their study showed that symmetrical waves are mainly responsible for ligaments break down.
Ibrahim developed a power series mathematical solution for the problem of instability of an inviscid liquid sheet of parabolic velocity profile emanated from a nozzle into an inviscid gas [62]. The results show that for both antisymmetrical and symmetrical disturbances departure from uniformity of the velocity profile causes the instability to be reduced. It has been suggested that jet instability may be affected by the relaxation of the velocity profile that takes place once the liquid exits the nozzle and is no longer constrained by its wall.
2.6.2. Viscous liquid sheet
the fastest-growing waves are short waves. The inclusion of the viscous terms is necessary to accurately predict the wave growth of short waves. Also the wavelength is in the same order of the sheet half-thickness.
2.7.
Evaporation effect
Evaporation is a phase transition process by which molecules in a liquid overcome their intermolecular attraction forces and escape into the surrounding gas environment. When heat is supplied to a liquid, its temperature, and hence the kinetic energy of the liquid molecules, are increased, which results in an increased evaporation activity. Also, a decrease in the ambient pressure increases the chances of the liquid molecules near the surface to overcome their intermolecular attraction potential, which results in an increased evaporation rate. In this exposition, the evaporation process is discussed from a continuum point of view using the conservation equations for mass, momentum and energy that take discontinuities in the density at the phase boundary into consideration. A comprehensive discussion of droplet vaporization can be found in the studies by Sirignano [63], Crowe et al. [64], and Sazhin [65].
2.7.1. Drop evaporation
reaches steady-state vaporization. The latter is described by the well-known d-squared law, which gives the square of the drop diameter as a function of time, t, by the relation:
2
0
( ) v
d t d t (2-4) where dis the drop diameter, d0is the initial diameter, and v is the evaporation coefficient.
2.7.2. Liquid jet evaporation
The breakup of a liquid jet is known to be affected by various disturbances such as the surface displacement, the pressure or velocity fluctuations in the supply system or on the jet surface, as well as the fluctuations such as temperature, viscosity, and surfac e tension on liquid properties. The instability and breakup of liquid jets into drops have been a subject of interest since the early nineteenth century and has continued to date [66–68]. However, these numerous studies focused on the instability of non-evaporating jets majorly. There are very limited studies addressing the instability of an evaporating jet, especially the effects on the primary breakup. This section reviews the previous studies on liquid jet breakup and instability under evaporating conditions.
unsaturated vapor pressure environment, the liquid flows can be treated as a superheated jet. The superheated interface between the liquid jet and its surrounding may also become unstable. This instability can greatly affect the hydrodynamic and thermal processes as well as the geometry of the jet.
The existing theoretical considerations for evaporating liquids, such as linear and nonlinear approximations provide us some thoughts of the possible mechanism responsible for the evaporation driven surface instabilities. It has been found that the most important element in the development of the instability is the variation in the mass flux caused by the local change in the temperature gradients at the surface. The vapor fluxes from the liquid crest when the first surface instability appears. The thermal boundary layer is stretched and decreased. And from the depression, the boundary layer is compressed and increased. At least three phenomena are considered as the possible causes responsible for the instability of the surface.
(depressions) to the cold crests. Sultan et al. studied the stability of an evaporating thin liquid film on a solid substrate [69]. The stability depends only on two control parameters, the capillary and Marangoni numbers. The Marangoni effect is a destabilizing process whereas capillarity and evaporation are stabilizing processes.
Prosperetti and Plesset [70], and Higuera [71] studied the stability of an evaporating horizontal planar surface of superheated liquid with infinite depth. They assumed that the time scale for the development of the surface instability is much shorter than that for the evolution of the basic configuration. The basic state is then considered as quasi-steady. It was shown that in the absence of significant relative velocity between the liquid and the gas, the development of the instability is due to the effect of vaporization on the pressure field. The evaporation flux and pressure at the depressions were found to be higher than that at the crests so that the liquid was squeezed into the crests causing the crests to grow. They considered both transfer rates across the interface and diffusion of the vapor in the gas phase in order to predict the evaporation rate quantitatively.
quasi-steady, and the normal mode method for the steady basic solution is applicable as an approximation. They found that for low speed jets undergoing Rayleigh breakup, jet surface evaporation is a destabilizing factor. But for high speed atomizing, jets surface evaporation becomes a stabilizing factor. This is due to the fact that the evaporation flux distributions at the depressions and crests of the waves on the surface of the liquid jet are different for these two breakup regimes.
A dimensionless parameter Va was obtained by Lian and Reitz to represent the degree of surface evaporation [72]. A larger value of Va indicates a stronger evaporation. As Va increases, the growth rate of all the unstable waves increases indicating that the surface evaporation in the Rayleigh regime is a destabilizing factor. Interestingly, for high speed jets in the atomization regime, the effect of surface evaporation helps stabilizing the spray. A similar dual-behavior has been observed for the effect of surface tension in liquid sprays by Lin and Lian [73]. For low-speed jets, the mechanism of jet breakup is capillary pinching and the surface tension contributes to destabilizing spray. However, the strong aerodynamic interaction at the interface creates a rapid formation of small droplets in the high-speed jets. The surface tension force therefore becomes a stabilizing factor resisting the jet breakup.
non-evaporating case. As the evaporation rate increases, the evaporation mechanism begins to dominate. The jet breakup time and the main drop sizes both decrease. The results show that the main size decreases with decreasing Reynolds number and increasing wave number and evaporation rate. For large evaporation rates the main drops become very small or even completely eliminated. The evaporation rate propagation of the disturbance is no longer linear. Thus the linear analysis is not able to predict the growth accurately.
Despite the number of theoretical studies on instability of evaporating liquid film and jet, very few experiments have been conducted. Stability of evaporating surfaces strongly depends on vapor mass flux and surface temperature. Direct measurement of these values in a jet is rather difficult because intrusive probes cannot be used. For a droplet it is possible to measure its temperature using an indirect method to correlate its surface tension using the oscillating droplet method [75]. For a jet flow this method cannot be readily applied, and an appropriate evaporation model must be used to estimate it.
Experiments have been performed with pure ether or ethanol, and an equal volume mixture of the two. In the high-pressure neutral gas environment, the evaporation process is relatively slow, and it mainly controlled by the rate of vapor diffusion from the surface. The presence of external gas additionally affects the evaporation rate due to a lateral gas flow close to the nozzle. The growth rate of the instability waves may also be influenced by the aerodynamic effects at the surface. In a low pressure and rich vapor environment, the rate of evaporation is only limited by the gas-kinematic conditions at the surface. The influence of external gas on the surface instabilities is not expected to be significant. However, the initial evaporation rate near the outlet of the jet depends primarily on the heat flux at the surface.
The results of their observations indicate that the problem of evaporation induced instabilities of small liquid jets is very complex. Various forms of surface instability may appear at similar experimental conditions. Stable cylindrical jet can also be observed a t low ambient pressures, which are more suitable for instabilities. In general, the higher the evaporation rate, the stronger the possibility of observing the first surface instabilities is. If this instability is large enough, the cylindrical jet shape becomes detached, and the theoretical models for regular surfaces can no longer be used.
2.8.
Summary
2.9.
Table and figures
Figure 2.1 Schematic of the automated optical film thickness measurement system [30]
Figure 2.3 Diagram of a flow loop [33]
Figure 2.5 Schematic of the ultrasonic fluid thickness measurement system [36]
3.
EXPERIMENTAL SYSTEM AND METHOD
3.1.
Optical measurement system
3.1.1. High speed camera
A high speed imaging technique was used to visualize the spatial spray structure in the near-nozzle region during the liquid dispensing process. Images of the near-nozzle region spray were acquired using a Phantom V4.3 digital high-speed CMOS video camera with a Nikon 50mm focal lens and a Nikon 60mm Micro lens. The high speed imaging process was synchronized with the dispensing process by using an external trigger signal from the trigger sprayer actuator. The camera resolution was adjusted to obtain a compromise between frame rate and image resolution. Different regions of interest were applied due to the various requirements over the course of the study. These include the near nozzle spray images used for cone angle calculation and the global nozzle spray images for breakup length and surface wave instability analysis.
3.1.2. Backlit system
3.2.
Data acquisition system
3.2.1. Sensors
The transient data of the liquid pressure, the pressure forces on the piston, and the displacement of the dispensing piston are required to analyze the transient dispensing process of the pressure swirl atomizer. To accomplish the simultaneous measurement of the three important signals, three types of sensors were installed on the pressure atomizer. The sprayer was fitted with a displacement sensor and a pressure sensor, and the actuator arm was fitted with a torque sensor, as shown in Figure 3.3.
3.2.2. Hardware and software configuration
To synchronize the event and control data acquisition, an NI PCI-6013 board and two OMEGA OM2-162 boards were used. NI PCI-6013 is an analog-input multifunction DAQ (Data Acquisition) board. OMEGA OM2-162 is a complete signal conditioning system on a card designed for either half or full bridge transducers. It consists of a high performance instrumentation amplifier, a user adjustable active filter, high stability bridge supply and all of the required circuitry, trim pots, etc. A control box was customized to accommodate all the data communication interfaces and trigger signal, as shown in Figure 3.4. Amplify signal NI LabVIEW 8.5 was used to code and realize functions of the system. The interface of LabVIEW control panel is shown in Figure 3.5 for the measurement of the trigger sprayer.

![Figure 2.3 Diagram of a flow loop [33]](https://thumb-us.123doks.com/thumbv2/123dok_us/1550281.1190240/60.612.220.403.388.536/figure-diagram-flow-loop.webp)
![Figure 2.7 Schematic of the experimental apparatus for evaporation jet analysis [76]](https://thumb-us.123doks.com/thumbv2/123dok_us/1550281.1190240/62.612.126.540.69.309/figure-schematic-experimental-apparatus-evaporation-jet-analysis.webp)