BHARADWAJ, AKSHAY GANESH. Inception of a Cyber-Infrastructure for Product Design Data and Evaluation of a Customized Multi-View Convolutional Neural Network for 3D CAD Model Classification. (Under the direction of Dr. Binil Starly).
Contemporary research in a multitude of engineering disciplines is focused towards leveraging the massive amount of data that has been generated over the last 2 decades. Efficient utilization of this data is possible through the use of machine learning techniques, specifically, deep learning methods that utilize artificial neural networks to automatically infer patterns from data. In the field of product design and manufacturing, there is a large amount of valuable data being generated both in industry as well as in academic settings. Several robust systems have been developed for recording end-point manufacturing machine data. However, there is a lack of easy access to large amounts of diverse Computer-Aided Design (CAD) data, to train such algorithms and methods to classify and search through this data.
proposed, building on a state-of-art multi-view Convolutional Neural Network method used in computer graphics. This new network is termed MVCNN++. This method involves capture of multiple images of each part, which are provided as input to the network. A classification scheme is proposed for the data based on relaxed part-type designation scheme, in order to supply data during the training process. The addition of each part’s associated dimension data is shown to yield
Multi-View Convolutional Neural Network for 3D CAD Model Classification
by
Akshay Ganesh Bharadwaj
A thesis submitted to the Graduate Faculty of North Carolina State University
in partial fulfillment of the requirements for the degree of
Master of Science
Industrial Engineering
Raleigh, North Carolina 2020
APPROVED BY:
_______________________________ _______________________________
Dr. Binil Starly Dr. Yuan-Shin Lee Committee Chair
ii DEDICATION
iii BIOGRAPHY
iv ACKNOWLEDGEMENTS
I would like to convey my most sincere gratitude to my thesis advisor and mentor Dr. Binil Starly, for his friendly guidance, belief and patience, without which this work would have been impossible. Right from my initial interactions with him, I have admired his incredible ability to come up with new ideas and coax the same out of his students, all while providing dependable yet flexible frameworks for realizing final research goals. I continue to enjoy and gain significant insights from our conversations, both technical and otherwise.
My thanks to the thesis committee members Dr. Yuan-Shin Lee and Dr. Thomas Reiland for their time and patience. I also appreciate the feedback on my research from faculty members in the Industrial Engineering department; as well as the staff at NC State for their kindness and assistance with a variety of technical and administrative issues.
Thanks to my fellow researchers at the DIME Lab: Atin Angrish, with whom I have collaborated closely and learnt much from, Deepak Pahwa, Syed Nabeel Mehdi, Mahmud Hasan and Ben Craver for the endless technical discussions and opinionated debates that provided welcome breaks from the occasional monotony. Many thanks also, to all my friends at NC State, for their constant encouragement.
v TABLE OF CONTENTS
LIST OF TABLES ... viii
LIST OF FIGURES ... ix
CHAPTER 1: Background and Motivation ... 1
1.1. Thesis Overview ... 1
1.2. Research Objectives ... 2
CHAPTER 2: Development of a Pilot Manufacturing Cyberinfrastructure with an Information Rich Mechanical CAD 3D Model Repository ... 4
Abstract ... 4
2.1. Introduction ... 5
2.2. Literature Survey and Previous Work... 7
2.3. FabWave (FW) – A Cyber-Infrastructure for Manufacturing ... 10
2.3.1. FabWave Infrastructure Use Cases... 11
2.3.2. Description and Structure ... 13
2.4. Data Collection and Add-Ins ... 14
2.4.1. Data Source 1: Academic Sources of 3D Model Data ... 15
2.4.2. Data Source 2: CAD Model Repositories ... 16
2.5. Post-processing of CAD Data ... 16
vi CHAPTER 3: MVCNN++: CAD Model Shape Classification using Multi-View
Convolutional Neural Networks ... 22
Abstract ... 22
3.1. Introduction ... 23
3.2. Related Work ... 26
3.2.1. 3D Shape Based Retrieval and Classification using Traditional Methods ... 26
3.2.2. Neural Network Methods for Retrieval and Classification ... 28
3.3. Methodology ... 30
3.3.1. Image Inputs of 3D Models ... 33
3.3.2. Network Architecture ... 34
3.3.2.1. ResNet Architecture ... 34
3.3.2.2. Multi-View CNN (MVCNN) ... 35
3.3.2.3. MVCNN++: Addition of Metadata ... 36
3.3.3. Implementation, Loss function and Hyper-parameters ... 38
3.4. Results ... 39
3.4.1. CAD Part Classification ... 40
3.4.2. Recall Measures ... 41
3.4.3. Observations regarding categorization of no-label data ... 44
3.5. Conclusions ... 46
vii 4.1. Summary ... 48
4.2. Future Work ... 49
viii LIST OF TABLES
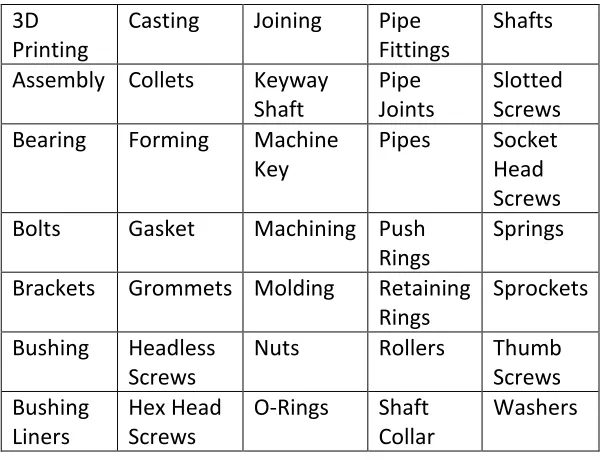
Table 2.1 List of the Product/Process based categories ... 17
Table 3.1 Part Classes with categorized training data (example Train-Validation split shown) ... 32
Table 3.2 Results of Classification and Recall on the FabWave FW10C dataset ... 39
Table 3.3 Precision at k: values for each class ... 44
ix LIST OF FIGURES
Figure 2.1 A Pilot Manufacturing Cyberinfrastructure- ‘FabWave’ ... 10
Figure 2.2 FabWave Web User Interface ... 13
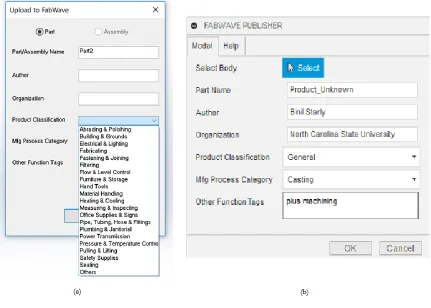
Figure 2.3 Plugins for (a) SolidWorks (b) Autodesk Fusion ... 14
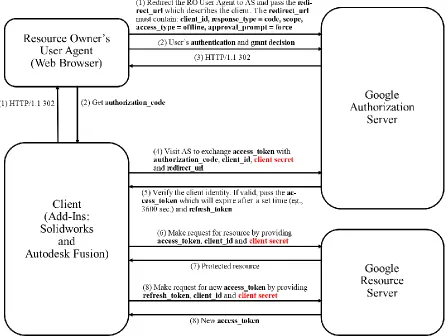
Figure 2.4 Workflow of data transfer from CAD Plugin to FW Repository ... 15
Figure 2.5 JSON Document Schema for (a) Assemblies (b) Single Parts ... 18
Figure 2.6 Example of an assembly splitting process ... 19
Figure 2.7 Miscellaneous sample parts from the FabWave 3D Part Model Repository (As of Oct 2019: >125,000 3D Model Parts) ... 19
Figure 3.1 Comparison- Top Row: Before Rotation, most of the views do not represent the part features adequately. Bottom Row: After Rotation, there is a visible improvement in the representations. ... 34
Figure 3.2 Example of a connection in ResNet ... 35
Figure 3.3 MVCNN++ Architecture ... 38
Figure 3.4 Loss vs. Epochs (a) Pure MVCNN (b) MVCNN++ (our network) ... 39
Figure 3.5 Confusion Matrices for (a) Pure MVCNN (b) MVCNN++ (our network) ... 40
Figure 3.6 Precision vs Recall: Pure MVCNN (Blue) and MVCNN++ (Red) ... 41
Figure 3.7 Examples of query results for some test parts ... 42
1 CHAPTER 1
BACKGROUND AND MOTIVATION 1.1. Thesis Overview
There is a wealth of data being generated over the cycle of product design to the final manufacturing stage. The crucial basis for all discrete manufacturing is the design of components, which begins as a 3D digital representation of the part/assembly being fabricated. [1] Three-dimensional Computer Aided Design (CAD) has become the preferred medium of representation for designers, almost entirely replacing 2D engineering drawings as a medium of communication. Three dimensional CAD offers advantages in ease of visualization of complex designs for designers, speed of designing and carrying out changes, and greater suitability for mechanical component analysis. Latest developments in manufacturing such as 3D printing, along with comparatively older Computer Numerical Control (CNC) based processes are heavily reliant on 3D representations for cutter path-planning.
With a large number of products and design iterations, there is a large amount of 3D data being generated in industry. A plethora of hugely successful commercial solutions exist for management of this data. It is a challenge to be able to effectively use this pre-existing design data for future purposes, and this has been an active research problem. However, as these designs are a critical intellectual resource of the companies that own them, it is practically impossible to access even small portions of this data at an academic or research level. This isolated data storage is necessary to protect the interests of the company, but can be a hindrance to a company’s own future employees as they go about re-design of components to create entirely new products.
2 engineering domain, and include conceptualizations which lack depth of engineering specifications. From these sources, those designs that are suitable as engineering data are of interest to engineers in the form of their individual components and not purely through their overall shape and assemblies. This requires designers to delve into the assembly and extract individual parts in order to analyze their designs. The motivation behind the creation of a cyber-infrastructure for these sources of data is the lack of a workflow for sharing and accessing this data, which provide in-depth information about the designs contained within.
1.2. Research Objectives
Chapter 2 describes the “FabWave” cyber-infrastructure created to satisfy these requirements for engineering design data. The term cyber-infrastructure is used rather than repository, since it follows the guidelines that are outlined as follows. In line with the NSF’s cyber-infrastructure vision, [2] FabWave contains the means to enable ease of data collection through automated workflows which have been tested on a pilot basis. The task of data analysis and visualization is simplified through at-source collection of part/feature specific data if available, through these workflow tools. Distributed data access is enabled through the use of cloud file storage. Horizontal scalability and scope for variability of the acquired data is ensured through the usage of a schema-less NoSQL database. There is great scope for utilizing high-performance computing for research applications on this data in the future. The ultimate goal for this cyber-infrastructure is to enable innovations in design education and to enable collaborative research in the field of product design and manufacturing.
4 CHAPTER 2
DEVELOPMENT OF A PILOT MANUFACTURING CYBERINFRASTRUCTURE WITH AN INFORMATION RICH MECHANICAL CAD 3D MODEL REPOSITORY
Akshay G Bharadwaj, Atin Angrish and Binil Starly
Edward P. Fitts Department of Industrial and Systems Engineering North Carolina State University
Raleigh, NC 27695 With
Yang Xu and Yong Chen
Epstein Department of Industrial and Systems Engineering University of Southern California
Los Angeles, CA 90089
The chapter has been adapted from the published work presented at the 14th ASME International Manufacturing Science and Engineering Conference, (MSEC), Erie, PA, June 2019
Abstract
5 tested out within the two academic universities and under two different course structures. We have also developed automated workflows to gather license appropriate CAD assemblies from commercial repositories. Our intent is to create the only known largest available CAD model set for enabling research in data-driven computational research in digital design, fabrication and quality control.
Keywords: Manufacturing Cyber Infrastructure, Data Management, CAD Model Repository, Digital Thread, Machine Learning, CAD
2.1. Introduction
Advanced manufacturing research is dependent on access to large datasets of product models to enable product designers to learn from past errors, and to discover and develop new solutions. Similarly, data generated during manufacturing processes and quality inspection also becomes valuable data for future research in advancing manufacturing research. However, such datasets are typically archived in inaccessible repositories and may be poorly described and difficult to use by others.
While the ‘Digital Thread’ in manufacturing has concentrated on the final end point data
generated during a product lifecycle, there is much value in all forms of data generated during the product lifecycle, even if it is not directly associated with product manufacturing. Examples include, failed designs, or unstructured data generated during the product design, prototyping and manufacturing process. Such forms of data are hardly captured and may provide tremendous value for researchers in advancing data-driven forms of product design and manufacturing [7].
6 evident in the US National Science Foundation and other Federal agency requirements on data management. Yet, manufacturing engineering researchers do not have an adequate workflow or any form of easy-to-use tool that allows data to be stored and made accessible to the community. The community of researchers simply rely on storage drives maintained at universities to store much of this data, with a small percentage of them made available through research datasets when the work is finally published. There is a much broader and possibly richer dataset generated within academia – be it within product design and manufacturing classes or through research activities conducted in manufacturing projects. These datasets if made accessible and usable by the community, can lower the barriers for other research groups to participate. For example, machine data generated during a biomedical manufacturing process, such as 3D bio-printing can be valuable to those who are interested in quality control, provided the datasets are annotated, tagged, classified and/or categorized to ensure its usability.
7 With advances in computer vision techniques, there has been the rise in application of graphical techniques aligned with Machine Learning techniques for model recognition and classification. The use of Convolutional Neural Networks, applied to volumetric representations [19], octree representations [20], collections of 2D representations [21] and techniques using unsupervised image-capture [22] have shown high accuracies of 90% and above. [23]. While promising, these techniques depend on large amounts of classified and categorized data to help improve results. In product manufacturing context, such data is not easily accessible and/or even readily available. Repositories such as those in Autodesk Fusion and GrabCAD would require manual download to get any sizeable chunk of data. Moreover much of the data is not readily categorized to be useful to the community for conducting research activities.
2.2. Literature Survey and Previous Work
Building comprehensive databases in a variety of domains has long been a topic of interest for researchers, especially in fields where large amounts of data are either easily generated, or where large datasets have great transformative potential and aid collaborative research. WordNet is one such online repository that provides a “large lexical dataset, where words are grouped into
8 Another well-known large-scale research database infrastructure, the Global Biodiversity Information Facility (GBIF) [26], has successfully collated hundreds of millions of species occurrence records through an international collaborative effort. Open access is provided to scientists and researchers to apply the data in peer-reviewed publications and policy papers. This data-driven approach to decision making has had far-reaching positive implications in biodiversity, climate change, human health and food security.
9 Jayanti and Ramani et al. established the Engineering Shape Benchmark (ESB) Dataset, by considering the Functional, Manufacturing, Lego model and real-world engineering parts from the NDR dataset (totaling 400 parts), and adding to this their own parts to bring up the total dataset to 867 models. [30] Instead of classifying the parts on the basis of function, the parts were classified on the basis of shape, giving due consideration to diversity of these 3D Models. These models were made available in STL and OBJ formats, along with the associated JPEG image. The higher level or ‘super-class’ categories were Flat-thin wall components, Rectangular Cubic Prisms and Solids of Revolution; sub-classes are further elaborated upon in [30]. 12 different techniques were tested on the ESB set, which can be classified into Feature Vector-Based, Histogram-Based and Graph-Based methods. A comparison between the NDR dataset and the ESB datasets was then performed, showing the superior performance of 2-D view methods such as 2.5D Spherical Harmonics [31] and 2D Shape Distributions [32].
10 tolerance specifications are lacking, which are critical to any data-driven product design engineering research.
2.3. FabWave (FW) – A Cyber-Infrastructure for Manufacturing
The overall goal of this project is to build the initial building blocks for a nationwide manufacturing cyberinfrastructure to advance our nation’s research and scholarly achievements in design and manufacturing (D&M) research. Current research must shift from siloed repositories of product manufacturing data to a platform that is federated, decentralized, open and inter-operable. This can be achieved through the transformation of techniques through which cyber-capability is embedded in every physical end-point, be it on a desktop used by a product designer or within the control systems of a manufacturing machine. Advanced CI tools are rarely used in
11 manufacturing science and research, primarily due to the lack of infrastructure to connect the diverse software tools and manufacturing machines used across the scientific community. Data generated during research are currently stored in siloed storage drives and hardly ever made accessible to the manufacturing community. Beyond availability of this data, making them usable for future research is critical to lowering the barriers for manufacturing researchers to use CI tools. This manufacturing cyberinfrastructure, which we call ‘FabWave’ (FW) aims to create the first of
its kind foundational experimental infrastructure to eventually support research interaction between manufacturing science and computer science researchers.
In this work, we have focused on the ability to gather 3D CAD model data from a variety sources generated within academic laboratories, teaching oriented classes and from publicly available open data sources to create a comprehensive dataset of 3D mechanical CAD parts far beyond the amount of 3D models available today.
2.3.1. FabWave Infrastructure Use Cases
12 FabWave is able to do so, because it has analyzed hundreds and thousands of previous designs available in its repository and has made an informed decision on the recommended callout based on similar designs that exist in its repository.
Use Case 2: Enabling Manufacturing Researchers: Rachel, a manufacturing science academic researcher is building a deep layer convolutional neural network algorithm to identify if a 3D product model is similar to a repository of digital product models existing in an organization’s database. However, Rachel has no easy way of training her model and stress testing her algorithm against several thousands of product model categories. Manual methods would simply be time consuming and impossible. If FabWave existed, she could use API tools available through FabWave, to link her algorithm and test it against thousands of product digital models, while using the available cloud and university’s resources to conduct the study.
13 2.3.2. Description and Structure
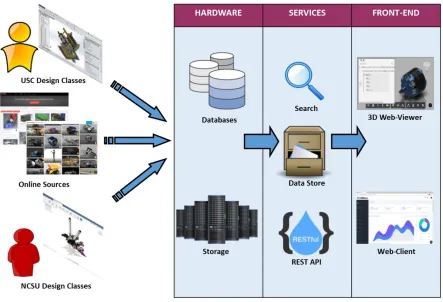
FabWave is intended to be a cyber-infrastructure to enable science and engineering research in manufacturing. In this first component, FabWave’s structure is designed to capture 3D CAD model data. However the underlying infrastructure can accommodate other forms of manufacturing data generated from a diversity of sources. Fig. 2.1 shows the overall stacked layer software architecture of FabWave. The goal is to create a detailed, continuously developing and eventually decentralized and inter-operable database of digital data (example CAD models), for use in design and manufacturing applications. Researchers will be able to access the entire dataset contained in the repository through the use of API tools, and therefore to build applications and enable their own research. Students have plug-ins to record all the data automatically with limited human input, thereby easing the path to storing rich content in the repository and removing barriers to sharing data. To facilitate the entry of 3D CAD model data, add-ins were developed at the design software level for both SolidWorks and Autodesk Fusion 360 design software using their API features, to enable users to upload their data to the repository with ease.
14 The front-end web interface for accessing FabWave (Fig. 2.2) is currently being built, using a Python based Django web framework; a basic user management system will be integrated into the Web UI. A Data Store integrated with ElasticStack, for uploading and visualizing the data is also under development. This front-end will connect to a storage repository containing the parts and related metadata for each of these parts. The remainder of the paper describes the workflow of capturing 3D model data of assemblies and associated parts, types of models captured and its organization.
2.4. Data Collection and Add-Ins
The repository for Fabwave was initially built from the following sources: Student data from design oriented classes at NCSU and USC, other parametrically generated CAD models in
15 academic projects, and data available freely for non-commercial purposes from CAD-sharing platforms such as Autodesk Gallery and GrabCAD.
2.4.1. Data Source 1: Academic Sources of 3D Model Data
To enable capturing student generated content, plugins were built for SolidWorks and Autodesk Fusion, two CAD software platforms heavily utilized in academic engineering curriculums. The plugins were created to make it easier for students/teaching assistants to upload content to the FW repository. Plugins created within SolidWorks and Fusion are shown in Fig. 2.3(a) and Fig. 2.3(b) respectively. Data generated by the student exercises or projects are routed to the Google Drive currently maintained by NC State University. Authentication level grant
16 access was built-in to allow data from USC to flow through into the Google Drive Account setup within NCSU (Fig. 2.4). In future, we would set individual storage accounts and then data made available through federated access.
2.4.2. Data Source 2: CAD Model Repositories
Web-scraping and automation tools were utilized to download assemblies from sources such as Autodesk Fusion Gallery and GrabCAD. The workflow was adjusted to only download models that had the appropriate shareable license to allow the model to be used for research and other re-use purposes. Each model assembly came with a limited set of meta-data properties that was available on each webpage of the model. The author of the assembly model, model categories and other description was also saved as part of the download process. While such data is limited with regards to characteristics of the assembly model, future workflow can include further categorization and classification of parts. Due credit to the website and the author of the file was recorded in the form of the author name and download URL.
The file downloads were restricted to the .STEP or .F3D formats; .STEP is an industry standard for CAD data, whereas F3D is a format specific to Autodesk Fusion software. Other popular formats such as .STL and .OBJ were not preferred, as they do not contain enough initial information about the part dimensions and other associated metadata. As on the date of writing this paper, 4700 CAD files of assemblies have been downloaded from these sources.
2.5. Post-processing of CAD Data
17 The categories were based on a combination of function and shape, derived from the listings on McMaster-Carr’s website [35]. These categories are listed in Table 2.1. However, the majority of the parts obtained from the web-sources were in the form of assemblies.
Table 2.1. List of the Product/Process based categories 3D
Printing
Casting Joining Pipe
Fittings
Shafts
Assembly Collets Keyway
Shaft
Pipe Joints
Slotted Screws
Bearing Forming Machine
Key
Pipes Socket
Head Screws
Bolts Gasket Machining Push
Rings
Springs
Brackets Grommets Molding Retaining
Rings
Sprockets
Bushing Headless
Screws
Nuts Rollers Thumb
Screws Bushing
Liners
Hex Head Screws
O-Rings Shaft
Collar
Washers
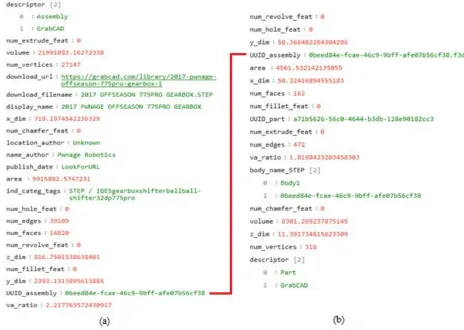
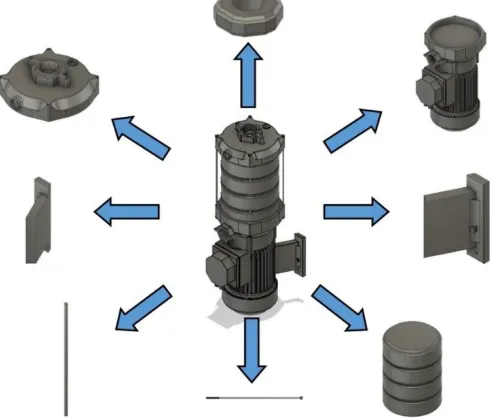
18 .STEP, .F3D and .STL, along with a screenshot of each model and the .JSON document containing the metadata as shown in Fig. 2.5 (a). It was essential to split the assemblies that were obtained, in order to isolate individual parts; these add far more value to the manufacturing applications that FabWave is oriented towards. Fig. 2.6 and Fig. 2.7 shows examples of the parts that were obtained through splitting the assemblies.
For models that have an assembly structure, each assembly was scanned and all parts were extracted from within the assembly structure. A UUID was assigned to them and a thorough acquisition of properties associated with these parts was made. In addition to the previously mentioned Area, Volume and Bounding Box dimensions, various other associated metadata such
19 as edges, vertices and the position of the part in the assembly tree structure were obtained; the complete details are shown in Fig. 2.5 (b). Each of the Part JSON documents also refers back to
Figure 2.6. Example of an assembly splitting process
20 the Assembly JSON documents and its position in the BRep tree. The parts were exported in the same formats as previously mentioned for the assemblies.
In total, we have compiled together more than 120,000 individual parts with full .STEP model information and as much meta-data possible about the part. These models are available as a public resource for research purposes at http://www.dimelab.org/fabwave. Models generated from academic sources are mostly standard parts which can be useful to train machine learning models for classification type problems. When a model exercise was given to student group in a particular class, the workflow allows us to capture multiple ways in which students have generated the same final end-result. Such datasets become extremely valuable to train machine learning algorithms to learn how humans create models. The limitation is that such workflow in-advertently also captures amateur product models, especially the work of students. Nevertheless, it does represent a starting point to gather data from start point of the design to the fabrication of it, rather than just collect the final end-point of any design process.
2.6. Conclusion
The intersection of manufacturing sciences and data sciences are reinforced with the digital integration across the product lifecycle. Machine learning algorithms require access to copious amounts of classified and categorized data to help advance manufacturing systems and process research. However access to such data has hampered the broader use of machine learning and artificial intelligence research across the manufacturing domain. This pilot project which we have termed ‘FabWave’ is designed to collect data across academic and research grade projects with
22 CHAPTER 3
MVCNN++: CAD MODEL SHAPE CLASSIFICATION USING MULTI-VIEW CONVOLUTIONAL NEURAL NETWORKS
Atin Angrish*, Akshay G Bharadwaj*, and Binil Starly Edward P. Fitts Department of Industrial and Systems Engineering
North Carolina State University Raleigh, NC 27695 *Equal Contribution
Submitted to the ASME Journal of Computing and Information Science in Engineering (JCISE) Abstract
23 3.1. Introduction
Model-based enterprises (MBE) are driving the transformation of engineering firms to rely on model-based definition (MBD) of 3D product models as the authoritative source that drives all downstream operations in a product lifecycle. Due to this development, it is critical that search and discovery of 3D product models is made possible within an enterprise data store and has been an area of interest for the design, graphics and manufacturing community. In the context of mechanical designs, it is efficient practice to use previous designs created for similar purposes as templates for new design ideas. However, navigating large data stores of 3D model data for this purpose is a painstaking exercise. Since search is primarily driven by text based search, retrieval of relevant 3D models rely on annotated tags which often are never complete and does not fully capture features within the model that makes designs accessible. Another scenario is matching detailed design data with manufacturing service providers who are best suited to make the product assembly. Another application area is the discovery of service providers which can be enabled by the engineering definition contained within the MBD file of the product. Design history and available process plans from the service provider prior orders may serve as proof of their capabilities which can aid in the supplier discovery in a new product development exercise.
24 representations are dependent on the resolution of the voxel-space for better performance, and higher resolutions require much higher computing power and time. In contrast, 2D image-based representations of 3D models have been shown to out-perform 3D voxel-based representations [37] with lesser data due to the efficiency of image representations. An added advantage is the opportunity to leverage the rapid progress in image descriptors and the extensive image data available in the form of databases such as ImageNet [38].
Although 3D model databases such as ModelNet and ShapeNet have come to prominence for 3D models in the computer graphics community, these repositories have specifically avoided domain specific data such as engineering models. For instance, ModelNet contains classes such as “lemon” and “head” which are not related to the manufacturing domain. While it does contain relevant model categories such as “aeroplane” and “helicopter”, ModelNet focuses on the overall
shape of the component, without importance given to the individual parts that make up these complex assemblies. The assembly and part level hierarchy is lost in these repositories and hence do not provide an adequate dataset needed for driving search within the MBD context. In order to satisfy this data requirement, a cyber-infrastructure (CI) for aggregation of design and manufacturing data coined ‘FabWave’ was built on a pilot basis. [39] Built to be an ever-expanding
source of data, aggregating content from academic and publicly accessible commercial repositories, the 3D models within FabWave provide extensive training data for deep learning methods. The FabWave dataset improves on existing classified datasets such as the Engineering Shape Benchmark [40] and the National Design Repository, by providing a large volume of diverse data required for training deep learning models.
25 domain. Relevant information regarding part design is lost during conversion to polygon mesh, including fundamental properties such as dimensions of the part and assigned material property. Such product manufacturing information (PMI) is critical to improved classification and search relevancy. Image capture of the 3D models cannot compensate for this problem through a global uniform image capture position for all models, since it is essential to capture the maximum information possible through the images. A unique feature of the FabWave Repository is the availability of different file-types of every part along with any associated part metadata, which are extracted during part processing. Taking advantage of this data, a CNN architecture for classification is proposed, based on multiple views of CAD parts along with the associated part dimension data. The training data is gathered from a set of classified CAD models available within FabWave, for the purpose of training the CNN architecture.
26 3.2. Related Work
A large amount of work has been devoted to content-based retrieval of three-dimensional objects over the last four decades, by both the computer graphics and the engineering design communities. Section 3.2.1 describes classical methods of 3D shape search and retrieval, and section 3.2.2 elaborates on techniques using Neural Networks or Deep Learning for the same application. This section addresses limitations of existing approaches and reasons for new retrieval approaches are critical to improving access to 3D design information available over the web.
3.2.1. 3D Shape Based Retrieval and Classification using Traditional Methods
27 Graph-based techniques have been developed in parallel to global feature-based techniques. This graph technique uses the Boundary Representation (B-Rep) structure of the CAD part. This focuses on feature decomposition followed by construction of a model dependency graph to find similar parts, as in the work of Cicirello and Regli [48]. The graph may consist of nodes representing faces, and arcs representing edges [49]. Other approaches have been to use different nodes representing various types of surfaces [50], Reeb graph based techniques involving relations between nodes of adjacent levels [51] and Skeletal Graphs [52] which convert the model into a skeletal structure representing the approximate structure of the part. While the approaches may differ, most graph based techniques involve the use of heuristics to decompose the graph into subgraphs, which can then be used for feature similarity detection [49]. Graph-based techniques tend to create over-simplified representations of CAD parts that may not be suitable for large scale similarity detection.
28 3.2.2. Neural Network Methods for Retrieval and Classification
Classification of parts and feature recognition using Neural Networks has been an ongoing field of research from the 1990s to date, with the aforementioned work by Chung and Kusiak [54] being an early example. Prabhakar and Henderson [57] proposed a method for classification that involved developing an adjacency matrix for a part, with topological relations between faces and their geometric descriptions encoded into this matrix. One network for each feature was constructed and the adjacency matrix fed row-by-row into every network, with the one neural net output recognizing a single feature if it is present. A classifier network for generating shape classes for GT applications was proposed in [58], which uses bitmap images to individually generate Opitz classification code for the part. Most of these methods involve a form of part encoding for classification; however, the latest methods of 3D shape classification involve shape descriptors obtained through Convolutional Neural Networks.
Convolutional Neural Networks (CNNs) were explored in 1998 by LeCun et al and were shown to out-perform techniques such as Nearest Neighbors (k-NN) and Support Vector Machines (SVM) for handwriting recognition. [36] However, significant breakthroughs were made with 2D CNNs with the availability of improved computing power and large amounts of annotated data in the form of the ImageNet database, [38] which enabled work on large-scale image recognition, notably by Krizhevsky et al [59] and He et al [60].
29 able to segment the parts for multiple feature recognition; this work focuses predominantly on prismatic parts and shows high accuracy for classification. However, 3D voxel based methods often result in loss of features, as they are dependent on the resolution of the voxelized model which directly affects the time and computing resources required for training. Small features lost during the voxelization process are often critical during the classification and retrieval process.
30 convergence. The concept of the MVCNN has been extended and improved upon, in RotationNet, [70] which is suitable for real-time object detection since it has the ability to accept only a partial set of images to perform categorization and pose estimation. Feng et al proposed a multi-level framework building on the MVCNN which examines the content of each one of the images and extends the network to group similar images of a model together. These groups are then weighted based on their importance to classification, before obtaining the final descriptor [71].
In a similar vein to this previous work on image-based classification, this work is based on the MVCNN architecture as applied to CAD data, experimenting with the inclusion of product dimension information with shape data for the purposes of classification and retrieval. Product Manufacturing Information (PMI) annotations contained within the MBD of a product allow the users in the manufacturing value chain to accurately size parts, provide specifications and text comments in an explicit manner, thus allowing the use of a single model across different parts of a manufacturing supply chain. A combination of 3D CAD model data along with PMI is a potential source for greater classification and retrieval accuracy in the manufacturing domain, which relies on such multimodal means of describing the paradigm of a part to be manufactured.
3.3. Methodology
31 1. Representing CAD models as a collection of several images allows us to capture all the macro and micro level features of the part which would otherwise have been lost due to voxelization or point cloud representation.
2. The image based representation allows the usage of numerous convolutional neural network architectures off the shelf for initial preprocessing of the part data to generate embeddings for each view which may be combined to pass through a network of dense layers for classification purposes.
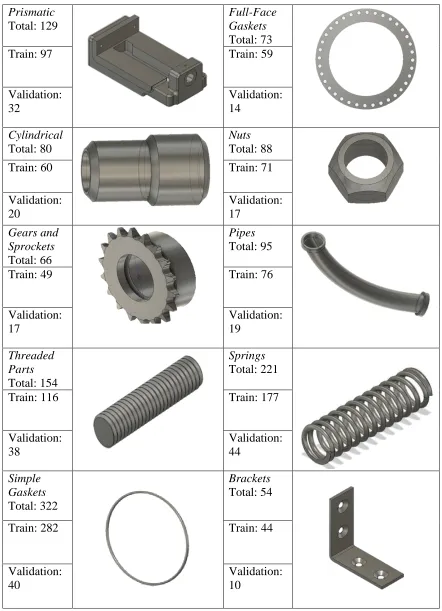
32 Table 3.1: Part Classes with categorized training data (example Train-Validation split shown)
Prismatic Total: 129
Full-Face Gaskets Total: 73
Train: 97 Train: 59
Validation: 32 Validation: 14 Cylindrical Total: 80 Nuts Total: 88
Train: 60 Train: 71
Validation: 20 Validation: 17 Gears and Sprockets Total: 66 Pipes Total: 95
Train: 49 Train: 76
Validation: 17 Validation: 19 Threaded Parts Total: 154 Springs Total: 221
Train: 116 Train: 177
Validation: 38 Validation: 44 Simple Gaskets Total: 322 Brackets Total: 54
Train: 282 Train: 44
Validation: 40
33 “Cylindrical”. The “Prismatic” components may be thought of as parts that could be machined using a 3/4/5 axis CNC machine, while the “Gears and Sprockets” parts may be thought of parts which have repeating patterns on the outer/inner periphery. “Cylindrical” parts are parts that may be made with either a lathe machine or a combination of a mill-turn processes. This “loose” classification scheme allows us to make a richer, more diverse training data, allowing for faster segregation. An associated benefit that arises from this classification scheme is generation of embeddings which are reflective of the part classes. This implies that the embeddings may be used as a means of part retrieval and are generated during the model training process.
3.3.1. Image Inputs of 3D Models
CNNs are optimized for image-based algorithms. Thus, the first step is the capture of images to be used for training and testing. Depth maps were generated through the graphics software, Blender, with the input being OBJ files contained within the FabWave infrastructure. As observed in [59] and [37], the learned filters in image-based CNNs are invariant to illumination changes. The number of images of each part to be used for the network was an important point of consideration. From initial training evaluation, it was estimated that there is a small increase in performance when 20 images are used as compared to 12 images. However, there was also an increase in the training time due to the larger number of parameters in the network. Evaluating the tradeoff between efficiency of computation and accuracy, it was determined that 12 images would be chosen to represent each of the parts. This provided efficient and accurate representations of the part and good classification accuracies as described in the following sections.
34 oriented upright along a particular axis; however, this is a contentious assumption to make in any large database, along with upright orientation being a loosely-defined term in CAD. Thus the second approach of setting the cameras at the vertices of a 12-vertex regular Icosahedron enclosing the part (scaled based on part size) was chosen and images captured. On visual inspection of these images, the views of some parts were not representative of their actual shape due to the natural symmetry of manufacturing components such as screws and springs. In order to counter this issue and break the view symmetry, the previously described camera-polygon was rotated by prime number values of 41°, 47° and 59° along each of the 3 axes (with the part centroid chosen as the point of rotation) to ensure optimal coverage of the part features (ref. Fig. 3.1 for comparison before and after rotation). Thus, each part is represented by 12 images which provide training data for the CNN. The images captured are of 500×500 pixel resolution, which is then down- sampled to 224×224 to provide input to the network.
Figure 3.1. Comparison- Top Row: Before Rotation, most of the views do not represent the part features adequately. Bottom Row: After Rotation, there is a visible improvement in the
representations.
3.3.2. Network Architecture 3.3.2.1. ResNet Architecture
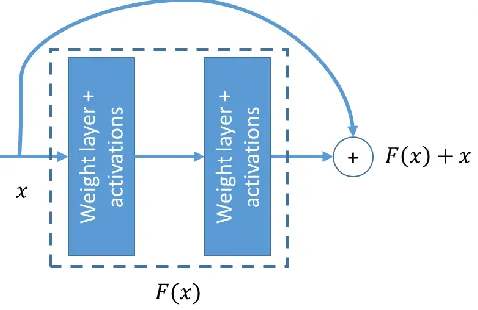
35 images to almost human level. An important advancement that led to better classification was made possible through the unique form of the ResNet architecture (Fig. 3.2), which implements use of residual layers and skip connections, enabling use of deeper networks, resulting in significant decrease in error rates. [60] The CNN architecture described in sections 3.2.1 and 3.2.2 use the entire pre-trained ResNet-50 architecture, which is one of the state-of-the-art algorithm for image recognition tasks. Using these existing pre-existing models to pre-train the network improves accuracy and reduces training time. [67] Twelve of these ResNet-50 networks are used in parallel, with each one of these sub-networks taking one image representation of the CAD part as input. Two different versions of the architecture were considered and described as follows.
Figure 3.2. Example of a connection in ResNet
3.3.2.2. Multi-View CNN (MVCNN)
36 vectors are aggregated by computing element-wise maximum of the list of 12 vectors. This is equivalent to training the network to identify the most important pieces of information from each view of the CAD model. If 𝑥 ∈ 𝑅(224 ,224) represents an image, ResNet is equivalent to a function 𝑟 ∶ 𝑥 → 𝑦 ; 𝑦 ∈ 𝑅4096. Therefore, a collection of these Resnet transforms leads to a shape
represented by 𝑆 ∈ {𝑥1∪ 𝑥2∪ 𝑥3∪ … }:
𝑟1(𝑥1) = 𝑦1 (1)
𝑟1(𝑥2) = 𝑦2 (2)
…
𝑟1(𝑥𝑛) = 𝑦𝑛 (3)
𝐺𝑚𝑎𝑥 = (𝑦1, 𝑦2, 𝑦3… 𝑦𝑛) = 𝑔 (4)
The succeeding flatten layer from 𝐺𝑚𝑎𝑥 and fully-connected dense layers provide the
down-sampling function to finally produce a penultimate layer vector of size 1024, which is used as a signature or descriptor corresponding to the part. The terminating layer provides a probability distribution of the part classification over the 10 classes and the class with the highest probability is assigned as the class for a given input.
3.3.2.3. MVCNN++: Addition of Metadata
37 density and material, or the part feature information and design trees that can be gathered from native file formats has been eschewed. This information is not universally available due to the varied nature of data capture methods that were utilized. Another significant feature of the multi-view images is that image capture point locations are scaled on the basis of each part size. This lack of a global camera position leads to loss of size reference. This loss may result in grouping of parts that have similar features, but may have vast differences in size and application. The addition of part metadata can prevent this issue. Representing the overall part dimension metadata with vector, the concatenated vector has the dimensions:
𝑋𝑖𝑛𝑝𝑢𝑡′ = [𝑔, 𝑀] ∈ 𝑅𝑑+𝑘 (5)
The new input representing the shape and the metadata is now used as input to two dense fully connected layers which allow us to perform classification tasks, where each layer is represented as follows:
ℎ1 = 𝜎(𝑊1. 𝑋𝑖𝑛𝑝𝑢𝑡′ + 𝑏1) (6)
𝑓𝑦𝑖 = 𝜎(𝑊2. ℎ1+ 𝑏1) (7)
38 Figure 3.3. MVCNN++ Architecture
3.3.3. Implementation, Loss function and Hyper-parameters
Training data consists of 1282 parts in total, with an 80-20 training-validation split applied; the total size of the images for the FW10C dataset is 110 MB. The neural network architectures were implemented in Python using Keras [72] with a TensorFlow [73] backend. A Softmax activation is used in the final layer, which gives the class prediction probabilities by reducing each value in the final layer between 0 and 1. This is achieved through the categorical cross-entropy loss function for multi-class classification, given by:
𝐿𝑖 = − 1
𝑁∑ log (
𝑒𝑓𝑦𝑖 ∑ 𝑒𝑗 𝑓𝑗
) [𝑦𝑖 ∈ 𝐶𝑦𝑖]
𝑁
𝑖=1 (8)
39 Softmax function, which can be interpreted as the normalized probability assigned to the correct label 𝑦𝑖 given a single input. The training was carried out with a batch size of 8, using a Stochastic Gradient Descent (SGD) optimizer with a learning rate of 1×10⁻⁵ and momentum 0.9. Dropout was applied to the NN2 dense layers to reduce overfitting. These hyper-parameters were assigned following a random grid search over the hyper-parameter space, with the network being trained for 100 epochs. The network was trained on a PC with 32GB RAM and 12GB Nvidia Titan V GPU. The training time was observed to be around 4 hours.
Figure 3.4. Loss vs. Epochs (a) Pure MVCNN (b) MVCNN++ (our network)
3.4. Results
Example of training loss curves are shown in Fig. 3.4. A faster convergence of the loss function at the 50th epoch is observed in the MVCNN++ network training as compared to pure MVCNN which converges after the 90th epoch.
Table 3.2: Results of Classification and Recall on the FabWave FW10C dataset Method
Pre-Training Data
Train/Test Data Mean Accuracy (with SD): 5-fold
validation
mAP
MVCNN ImageNet FabWave
FW10C
0.8965 (±0.04) 0.55
MVCNN++ ImageNet FabWave
FW10C
40 3.4.1. CAD Part Classification
Classification of both models were compared based on accuracy measures after 5-fold validation. The model classification results are shown in Table 3.2, evaluated on the FW10C test set. The MVCNN++ network shows superior classification accuracy as compared to pure MVCNN on average and for 4 out of the 5 validation folds. Computing the confusion matrices (Fig. 3.5) on the validation sets of one k-fold trained models, it is observed that the new model reduces misclassification for cylindrical parts and full-face gaskets, which are wrongly classified as threaded parts and simple gaskets respectively. There is also an improvement in the classification of springs, which are misclassified as threaded parts, due to the feature commonalities of threads and the spring-helix. The comparison of precision-recall curves for both networks is shown in Fig. 3.6.
41 Figure 3.6. Precision vs Recall: Pure MVCNN (Blue) and MVCNN++ (Red)
3.4.2. Recall Measures
The terminating layer of the previously mentioned MVCNN architectures gives a probability distribution of 10-class prediction. The class with the highest probability is chosen to be the representative class of the part. However, one of the problems of interest is the information retrieval from previously unclassified data from the FabWave CI’s CAD repository, which can be done by using the part descriptor-vector described in section 3.3.2.2. It is necessary to compute retrieval measures using this descriptor.
42 computing the nearest neighbors, since it provides a bounded distance which can be used to compare the degree of similarity of retrieved parts:
𝑐𝑜𝑠 𝜃 = 𝐴⃗⋅𝐵⃗⃗
‖𝐴⃗‖‖𝐵⃗⃗‖=
∑𝐴𝑖𝐵𝑖̇
√∑𝑛𝑖=1𝐴𝑖2√∑𝑛𝑖=1𝐵𝑖2
(9)
This process was repeated multiple times for all 10 classes; in total, over 3000+ parts were manually classified using part signatures from both the pure MVCNN as well as the MVCNN++ model. The top 5 results for 5 different queries are shown in Fig. 3.7, where the parts are ranked on the basis of similarity of their signature with the pre-classified query part. Using the manual classification process outlined above, for query 5, the first four results would be classified as springs, whereas for query 3, only results 2 and 5 can be classified as full-face gaskets.
43 Using the data obtained, the measures of average precision at k was calculated, where k is a limit of the position of the result in the query. Average precision at k for a query is given by:
𝐴𝑃 (𝑎𝑡 𝑘) = 1
𝐺𝑇𝑃 ∑
𝑇𝑃𝑠𝑒𝑒𝑛
𝑖 𝑘
𝑖=1 (10)
44 Table 3.3: Precision at k: values for each class
Pure MVCNN
Class Name Prec. at 1 Prec. at 3 Prec. at 5 Prec. at 10
Brackets 0.2 0.1 0.14 0.17
Prismatic 0.9 0.8 0.83 0.78
Cylindrical 0.9 0.89 0.92 0.9
FF. Gasket 0.4 0.43 0.5 0.55
Threaded 0.1 0.1 0.1 0.1
Nuts 1 0.96 0.95 0.89
S. Gasket 1 0.73 0.64 0.5
Pipes 0.57 0.43 0.26 0.18
Spring 0.2 0.19 0.18 0.16
Gear/Sprocket 0.7 0.53 0.36 0.31
3.4.3. Observations regarding categorization of no-label data
Categorization of unlabeled data within the FabWave CI is another aspect of this work. Following on from the previous section, 2000+ CAD parts were classified based on nearest-neighbor calculation on the MVCNN++ part signature-vectors alone. In order to judge the efficacy of the CNN model classification as compared to humans, these manually classified parts were also auto-classified using the MVCNN++ network as shown in Table 3.4. The success percentage is defined as the ratio of number of manually classified parts that were correctly classified using the MVCNN++ network, to the total number of manually classified parts in each class. This ratio uses the manual classification as the ground truth label for these parts.
Table 3.4: Manual vs. MVCNN++ Classification Comparison Class Name Manually
Classified
Success Percent
Class Name Manually Classified
Success Percent
Brackets 78 0.24 Nuts 900 0.11
Prismatic 445 0.95 S. Gasket 126 0.99
Cylindrical 672 0.93 Pipes 38 0.84
FF. Gasket 59 0.42 Spring 155 0.82
45 Figure 3.8. Graphical Interface for manual classification
46 efforts of labeling of the entire repository based on other factors such as specific part features or manufacturing process.
This work demonstrates an implementation of the multi-view convolutional network which takes benefit of the additional metadata associated with the 3D shapes in consideration. The uniqueness and the high accuracy of the classification and retrieval process is a direct result of the use of new techniques introduced in this paper such as use of symmetry breaking camera angles for capturing different views of the models and the extraction of metadata which is later used in the classification process. The architecture proposed also takes advantage of pre-trained models for transfer learning, enabling training with smaller datasets, which often proves to be a challenge in training machine learning models for more bespoke applications such as manufacturing component data. The architecture also allows for faster training than conventional MVCNN owing to the use of metadata in conjunction with shape data. This can be used for faster training when training with larger more complex datasets with larger number of classes. Future work in this regard can be towards development of more complex algorithms which take different kinds of metadata into account for classification and retrieval tasks, which is a shortcoming of the MVCNN++. Consideration must be given to loss functions more suited for retrieval problems than the categorical cross entropy loss function employed in this implementation.
3.5. Conclusions
47 trained and designed for traditional computer graphics datasets such as the ModelNet-10 or ModelNet-40. The shape data is augmented with metadata (part dimensions in this work) in order to increase the classification accuracy and increase the convergence rate vs epochs. This allows us to train a near optimal neural network allowing for higher accuracies with a small amount of data.
48 CHAPTER 4
CONCLUSIONS AND FUTURE WORK 4.1. Summary
Data availability is a great bottleneck in data driven research in the fields of design and manufacturing, and there is a need for openly accessible source of data, which is suitable for scaling and diversification over time. This study aimed to develop a framework termed “FabWave” for aggregating content-rich product data, which is federated, decentralized and inter-operable. The pilot implementation focused on creating workflows for collecting 3D product designs from designers in academia and research, and a parallel workflow to aggregate existing online content onto cloud storage. The former of these was successfully tested across academic programs at two universities, which provided a proof of concept of the approach used for collection of data. Significant pre-processing of this data was carried out to create sufficiency of data for varied methods of product design and manufacturing research. Use of the cloud for file storage and a NoSQL database ensured that the goal of scalability was also met; the FabWave infrastructure can also accommodate multiple forms of manufacturing data corresponding to components, such as machine data, data sheets, material acquisition orders etc. in the future. The infrastructure was successful in collecting 125,000 individual CAD part files, which are accessible to users at the two universities referenced in chapter 2.
49 shape representations, was adapted for the purpose for classification of this data. Training data was obtained from within FabWave and a 10-class relaxed classification scheme based on feature/form was created by hand classification. The method chosen for classification of the corpus was multi-view convolutional neural network with addition of part-dimension metadata. The classification and retrieval metrics described in chapter 3 are comparable to those of cutting edge research in the field of shape recognition. To judge the classification over the large corpus of data, a novel method of using retrieval to aid human classification was developed with a graphical interface. Using this, manual categorization carried out on previously unclassified parts. These were used as ground truth and compared with the labels predicted by the network. Only nuts and bracket classes performed poorly in this test. For nuts, the most likely reason is the lack of diversity in the training data, since nuts were retrieved on a consistent basis as evident from the consistently high ‘precision-at-k’ values (table 3.3) for this class. Brackets have poor precision-at-k values; it may thus be inferred that unclassified corpus does not contain any significant number of parts from bracket class.
4.2. Future Work
51 REFERENCES
[1] Ulrich, K. T., & Pearson, S. A. (1993). Does product design really determine 80% of manufacturing cost?
[2] Council, C. (2007). Cyberinfrastructure vision for 21st century discovery. Arlington, VA: National Science Foundation). http://www.nsf.gov/pubs/2007/nsf0728/nsf0728.pdf.
[3] Iyer, N., Jayanti, S., Lou, K., Kalyanaraman, Y., & Ramani, K. (2005). Three-dimensional shape searching: state-of-the-art review and future trends. Computer-Aided Design, 37(5), 509-530.
[4] Ahmed, E., Saint, A., Shabayek, A. E. R., Cherenkova, K., Das, R., Gusev, G., ... & Ottersten, B. (2018). A survey on Deep Learning Advances on Different 3D Data Representations. arXiv preprint arXiv:1808.01462.
[5] Bronstein, M. M., Bruna, J., LeCun, Y., Szlam, A., & Vandergheynst, P. (2017). Geometric deep learning: going beyond euclidean data. IEEE Signal Processing Magazine, 34(4), 18-42.
[6] Su, H., Maji, S., Kalogerakis, E., & Learned-Miller, E. (2015). Multi-view convolutional neural networks for 3d shape recognition. In Proceedings of the IEEE international conference on computer vision (pp. 945-953).
[7] Regli, W. (2016). Data and Manufacturing Innovation. Mechanical Engineering Magazine: Select Articles, 138(09), 40–45. doi:10.1115/1.2016 Sep-2
52 [9] Funkhouser, T., Min, P., Kazhdan, M., Chen, J., Halderman, A., Dobkin, D., & Jacobs, D. (2003). A search engine for 3D models. ACM Transactions on Graphics, 22(1), 83–105. doi:10.1145/588272.588279
[10] Angrish, A., Craver, B., & Starly, B. (2018). “FabSearch” : A 3D CAD Model Based Search Engine for Sourcing Manufacturing Services. doi: arXiv:1809.06329
[11] Ramesh, M., Yip-Hoi, D., & Dutta, D. (2001). Feature Based Shape Similarity Measurement for Retrieval of Mechanical Parts. Journal of Computing and Information Science in Engineering, 1, 245–256. doi:10.1115/1.1412456
[12] Bespalov, D., Regli, W. C., & Shokoufandeh, A. (2006). Local feature extraction and matching partial objects. Computer-Aided Design, 38(9), 1020–1037. doi:https://doi.org/10.1016/j.cad.2006.07.005
[13] Osada, R., Funkhouser, T., Chazelle, B., & Dobkin, D. (2002). Shape distributions. ACM Transactions on Graphics, 21(4), 807–832. doi:10.1145/571647.571648
[14] Iyer, S., & Nagi, R. (1995). Identification and ranking of similar parts in agile manufacturing (Master's thesis, State University of New York at Buffalo).
[15] Horn, B. K. P. (1984). Extended gaussian images. Proceedings of the IEEE, 72(12), 1671-1686.
[16] Wolfson, H. J., & Rigoutsos, I. (1997). Geometric hashing: An overview. IEEE computational science and engineering, 4(4), 10-21. doi: 10.1109/99.641604
[17] Sun, J., Ovsjanikov, M., & Guibas, L. (2009, July). A concise and provably informative multi‐scale signature based on heat diffusion. In Computer graphics forum (Vol. 28, No. 5,
53 [18] Aubry, M., Schlickewei, U., & Cremers, D. (2011, November). The wave kernel signature: A quantum mechanical approach to shape analysis. In Computer Vision Workshops (ICCV Workshops), 2011 IEEE International Conference on (pp. 1626-1633). IEEE. doi: 10.1109/ICCVW.2011.6130444
[19] Maturana, D., & Scherer, S. (2015). VoxNet: A 3D Convolutional Neural Network for real-time object recognition. 2015 IEEE/RSJ International Conference on Intelligent Robots and Systems (IROS). doi:10.1109/IROS.2015.7353481
[20] Riegler, G., Ulusoy, A. O., & Geiger, A. (2017, July). Octnet: Learning deep 3d representations at high resolutions. In Proceedings of the IEEE Conference on Computer Vision and Pattern Recognition (Vol. 3). doi: arXiv: 1611.05009
[21] Su, H., Maji, S., Kalogerakis, E., & Learned-Miller, E. (2015). Multi-view Convolutional Neural Networks for 3D Shape Recognition. 2015 IEEE/RSJ International Conference on Intelligent Robots and Systems (IROS), 945–953. doi:http://doi.ieeecomputersociety.org/10.1109/ICCV.2015.114
[22] Kanezaki, A., Matsushita, Y., & Nishida, Y. (2016). RotationNet: Joint Object Categorization and Pose Estimation Using Multiviews from Unsupervised Viewpoints. arXiv preprint arXiv:1603.06208.
[23] Princeton . (2018). ModelNet. Retrieved from http://modelnet.cs.princeton.edu/
[24] Miller, G. A. (1995). WordNet: a lexical database for English. Communications of the ACM, 38(11), 39–41. doi:10.1145/219717.219748
54 [26] GBIF: The Global Biodiversity Information Facility. What is GBIF?. Available from
https://www.gbif.org/what-is-gbif [13th August 2018].
[27] Shilane, P., Min, P., Kazhdan, M., & Funkhouser, T. (2004, June). The Princeton Shape Benchmark. In Proceedings Shape Modeling Applications, 2004. (pp. 167-178). IEEE. doi: 10.1109/SMI.2004.1314504
[28] Regli, W. C., Foster, C., Hayes, E., Ip, C. Y., McWherter, D., Peabody, M., ... & Zaychik, V. (2001, August). National design repository project: A status report. In International Joint Conferences on Artificial Intelligence (IJCAI), Seattle, WA, Aug (pp. 4-10).
[29] Bespalov, D., Ip, C. Y., Regli, W. C., & Shaffer, J. (2005). Benchmarking CAD search techniques. SPM ’05 Proceedings of the 2005 ACM Symposium on Solid and Physical Modeling , 275–286. doi:10.1145/1060244.1060275
[30] Jayanti, S., Kalyanaraman, Y., Iyer, Natraj, & Ramani, Karthik. (2006). Developing an engineering shape benchmark for CAD models. Computer-Aided Design, 38, 939–953. doi:https://doi.org/10.1016/j.cad.2006.06.007
[31] Pu J., Ramani K. (2005) A 3D Model Retrieval Method Using 2D Freehand Sketches. In: Sunderam V.S., van Albada G.D., Sloot P.M.A., Dongarra J.J. (eds) Computational Science – ICCS 2005. ICCS 2005. Lecture Notes in Computer Science, vol 3515. Springer, Berlin, Heidelberg. doi: https://doi.org/10.1007/11428848_45
55 [33] Wu, Z., Song, S., Khosla, A., Yu, F., Zhang, L., Tang, X., & Xiao, J. (2015). 3d shapenets: A deep representation for volumetric shapes. In Proceedings of the IEEE conference on computer vision and pattern recognition (pp. 1912-1920).
[34] Chang, A. X., Funkhouser, T., Guibas, L., Hanrahan, P., Huang, Q., Li, Z., Savarese, S., Savva, N., Song, S., Su, H., Xiao, J., Yi, L., Yu, F. (2015). Shapenet: An information-rich 3d model repository. arXiv preprint arXiv:1512.03012.
[35] McMaster-Carr. (2018). McMaster-Carr. Retrieved from https://www.mcmaster.com/ [36] LeCun, Y., Bottou, L., Bengio, Y., & Haffner, P. (1998). Gradient-based learning applied to
document recognition. Proceedings of the IEEE, 86(11), 2278-2324.
[37] Su, H., Maji, S., Kalogerakis, E., & Learned-Miller, E. (2015). Multi-view convolutional neural networks for 3d shape recognition. In Proceedings of the IEEE international conference on computer vision (pp. 945-953).
[38] Deng, J., Dong, W., Socher, R., Li, L. J., Li, K., & Fei-Fei, L. (2009, June). Imagenet: A large-scale hierarchical image database. In 2009 IEEE conference on computer vision and pattern recognition (pp. 248-255). Ieee.
[39] Bharadwaj, A., Xu, Y., & Angrish, A. (2019). Development of a pilot manufacturing cyberinfrastructure with an information rich mechanical CAD 3D model repository. In ASME 2019 International Manufacturing Science and Engineering Conference, American Society of Mechanical Engineers.
56 [41] Koch, S., Matveev, A., Jiang, Z., Williams, F., Artemov, A., Burnaev, E. & Panozzo, D. (2019). ABC: A Big CAD Model Dataset For Geometric Deep Learning. In Proceedings of the IEEE Conference on Computer Vision and Pattern Recognition (pp. 9601-9611).
[42] Sadjadi, F. A., & Hall, E. L. (1980). Three-dimensional moment invariants. IEEE Transactions on Pattern Analysis and Machine Intelligence, (2), 127-136.
[43] Cybenko, G., Bhasin, A., & Cohen, K. D. (1997). Pattern recognition of 3 d cad objects: Towards an electronic yellow pages of mechanical parts. INT J SMART ENG SYST DESIGN, 1(1), 1-13.
[44] Tangelder, J. W., & Veltkamp, R. C. (2004, June). A survey of content based 3D shape retrieval methods. In Proceedings Shape Modeling Applications, 2004. (pp. 145-156). IEEE. [45] Saupe, D., & Vranić, D. V. (2001, September). 3D model retrieval with spherical harmonics and moments. In Joint Pattern Recognition Symposium (pp. 392-397). Springer, Berlin, Heidelberg.
[46] Kazhdan, M., Funkhouser, T., & Rusinkiewicz, S. (2003, June). Rotation invariant spherical harmonic representation of 3 d shape descriptors. In Symposium on geometry processing (Vol. 6, pp. 156-164).
[47] Angrish, A., Craver, B., & Starly, B. (2019). “FabSearch”: A 3D CAD Model-Based Search Engine for Sourcing Manufacturing Services. Journal of Computing and Information Science in Engineering, 19(4), 041006.
57 [49] Han, J., Pratt, M., & Regli, W. C. (2000). Manufacturing feature recognition from solid
models: a status report. IEEE transactions on robotics and automation, 16(6), 782-796. [50] El-Mehalawi, M., & Miller, R. A. (2003). A database system of mechanical components
based on geometric and topological similarity. Part II: indexing, retrieval, matching, and similarity assessment. Computer-Aided Design, 35(1), 95-105.
[51] Bespalov, D., Regli, W. C., & Shokoufandeh, A. (2008, June). Reeb graph based shape retrieval for CAD. In ASME 2003 international design engineering technical conferences and computers and information in engineering conference (pp. 229-238). American Society of Mechanical Engineers Digital Collection.
[52] Sundar, H., Silver, D., Gagvani, N., & Dickinson, S. (2003, May). Skeleton based shape matching and retrieval. In 2003 Shape Modeling International. (pp. 130-139). IEEE.
[53] Shah, J. J., & Bhatnagar, A. S. (1989). Group technology classification from feature-based geometric models. Manufacturing Review, 2(3), 204-213.
[54] Chung, Y., & Kusiak, A. (1994). Grouping parts with a neural network. Journal of Manufacturing Systems, 13(4), 262-275.
[55] Iyer, N., Jayanti, S., Lou, K., Kalyanaraman, Y., & Ramani, K. (2005). Three-dimensional shape searching: state-of-the-art review and future trends. Computer-Aided Design, 37(5), 509-530.