International Journal of Innovative Research in Science, Engineering and Technology
An ISO 3297: 2007 Certified Organization Volume 6, Special Issue 4, March 2017
National Conference on Technological Advancements in Civil and Mechanical Engineering – (NCTACME'17)
17th -18th March 2017
Organized by
C. H. Mohammed Koya
KMEA Engineering College, Kerala- 683561, India
Performance Evaluation of Irrigation Systems
under Different Hydro Meteorological Conditions
Jisha S 1, Balamurugan2
Assistant Professor, Department of Civil Engineering, MES institute of Technology and Management, Kollam, India1
Associate Professor, Department of Civil Engineering, Anna University, Tamil Nadu, India2
ABSTRACT: Water is the limiting factor in most of the world. Increasing yields and sustaining food production depend mainly on irrigation. The main objective in the performance evaluation is to decide the performance indicators. The study area was Tamil Nadu and Kerala which are different in hydro-meteorological parameters for the comparison. The six indicators selected were output per cropped area, per unit command, per unit irrigation supply, per unit water consumed, relative water supply and relative irrigation supply. The evaluation revealed that the production values were varying for both the irrigation systems with land as well as water as constraints. From the results obtained, it is concluded that a better performance of the irrigation system can be improved by changing the cropping pattern, cropping intensities and choosing the right variety of crops. In both the systems, it is advised to do strict and active water management system to control the wastage of water and use the available water judiciously.
KEYWORDS: Performance indicators, SGVP, Irrigation systems, Hydrometeorology, Evapotranspiration
Performance indicators, SGVP, Irrigation systems, Hydrometeorology, Evapotranspiration
I. INTRODUCTION
II. PERFORMANCE INDICATORS AND ITS FUNCTION
Performance indicators are classified as external indicators and internal indicators. The internal indicators are used only for the performance assessment within a system and they are data intensive. But external indicators relate output to the input and they are not too data intensive. A total of six external indicators are used for the cross system comparison. The various indicators used in this thesis are: Output per cropped area, Output per unit command, Output per unit irrigation supply, Output per unit water consumed, Relative water supply, Relative irrigation supply The various indicators can be found out using the following Equations:
i. Output per cropped area = Production/Irrigated cropped area ii. Output per unit command = Production / Command area iii. Output per unit irrigation supply =Production/Diverted irrigation supply
iv. Output per unit water consumed =Production/ Volume of water consumed by ET v. Relative water supply = Total water supply/ Crop demand
vi. Relative irrigation supply = Irrigation supply/ Irrigation demand
The Standard Gross Value of Production (SGVP)
The Standardized Gross Value of Production (SGVP) was developed for cross system comparison as there is difference in local prices between the two areas. They help in the comparison of the irrigation systems irrespective of the kind of crops grown. The SGVP considers both local as well as the international preferences and this will be the summation of area, yield, and local price of crops compared with the local price of base crop and multiplied with value of base crop at world. To obtain SGVP, equivalent yield is calculated based on local prices of crops grown, compared to the local prices of predominantly grown base crop. SGVP is calculated using the equation:
SGVP= ∑ (1) Where Yi is the yield of crop i, Pi is the local price of crop i, Pworld is the value of base crop traded, Ai is the area
cropped with crop i, Pb is the local price of base crop
The various data required regarding the production, area cultivated for each crops and the price rates of crops for the year 2010-2011 was collected to find out the productivity at both the study area. The results obtained was analyzed and found out that the productivity of Paddy was higher in A.N. Kuppam anicut system. The following tables show the productivity and rates of crops in both the study areas. Table 1 show the Details of productivity and price rates of crops grown at A. N. Kuppam anicut system for the year 2010-2011. Table 2show the Details of productivity and price rates of crops grown at Kallada Irrigation System for the year 2010-2011.
Table. 1 Details of productivity and price rates of crops at A. N. Kuppam anicut system for the year 2010-2011.
Sl.
No. CROPS
AREA (ha)
PRODUCTION (tones)
PRODUCTION (kg)
PRODUCTIVITY (kg/ha)
PRICE (Rs/kg)
1 Paddy 390.96 1958.7 1958700 5780 9.61
2 Groundnut 25 19.5 19500 780 35
Table. 2 Details of productivity and price rates of Kallada Irrigation System for the year 2010-2011.
Sl. No. CROPS AREA
(ha)
PRODUCTION (tones)
PRODUCTION (kg)
PRODUCTIVITY (kg/ha)
PRICE (Rs/kg)
1 Paddy 172 440.62 440624 2562.51 9.9
2 Sugarcane 0.38 2.25 2250 5921.20 5.18
3 Pepper 120 96.41 96410 803.44 114.95
4 Banana 249 1652.85 1652850 6637.5 19.5
the cropped area for paddy is higher here. In A. N. Kuppam anicut system, the farmers mainly depend on irrigated agriculture than depending too much on the rainfall. Thus, the production of paddy depends on the amount of water diverted to the fields which is higher in A. N. Kuppam anicut system.
Table.3 Net crop demand and Net irrigation demand calculated for Kallada Irrigation System.
Sl.
no Crops
Area (ha)
Net crop water requirement (mm/season)
Net irrigation requirement (mm/season)
Total net
crop demand (mm/season)
Total net
irrigation demand (mm/season)
SGVP (US$)
1 Paddy 172 539 256.6
728.33 318.26
407857
2 Sugarcane 0.38 1607.2 382.7 370.49
3 Pepper 120 498.5 73.5 350847
4 Banana 249 1054.9 478.7 1026300
TOTAL 541.3 1785374
Table. 4 Net crop demand and Net irrigation demand calculated for A. N .Kuppam anicut system.
Sl.
no Crops
Area (ha)
Net crop water requirement (mm/season)
Net irrigation requirement (mm/season)
Total net
crop demand (mm/season)
Total net
irrigation demand (mm/season)
SGVP (US$)
1 Paddy 391 518.9 262
518.27 269.65 1233987
2 Groundnut 25 508.4 389.3 22371.2
TOTAL 416 1256358
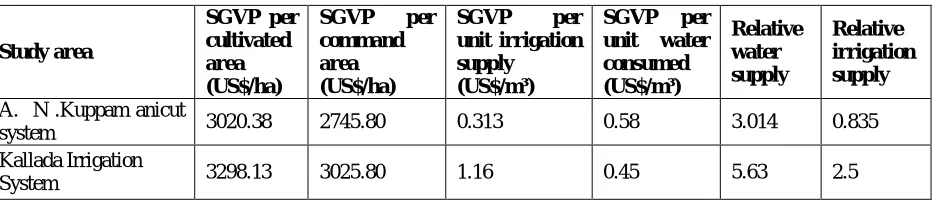
The six performance indicators for both the study area were calculated and the results were tabulated. Table 5 shows the results of the six performance indicators calculated for both the study area.
Table. 5 Results of the six performance indicators calculated for both the study area.
Study area
SGVP per cultivated area (US$/ha)
SGVP per
command area (US$/ha)
SGVP per
unit irrigation supply
(US$/m³)
SGVP per
unit water consumed (US$/m³) Relative water supply Relative irrigation supply
A. N .Kuppam anicut
system 3020.38 2745.80 0.313 0.58 3.014 0.835 Kallada Irrigation
System 3298.13 3025.80 1.16 0.45 5.63 2.5
SGVP per cropped area
SGVP per cropped area is found to be higher in Kallada Irrigation System where most of the area is occupied by banana cultivation. Whole area cannot be cultivated due to fallow land and certain socio economic factors in the irrigation system. The irrigated area and the cropping pattern can be changed from year to year. If the un- irrigated area is irrigated, the SGVP per cropped area can be increased to a limit of US$ 3200 to 3700 per ha. Precautions should be taken to decrease fallow land and farmers should be given training for this. SGVP per cropped area can be improved through increase in production, reduction in cost of cultivation and inputs and providing proper support price for the produce. Figure 6 below shows the variation of SGVP per unit cultivated area (US$/ha) for both the study area considering all the crops grown in the area.
It was found that the SGVP per cropped area for the crop paddy alone in A. N. Kuppam anicut system was US$ 3156.3/ha and that in Kallada Irrigation System was US$ 2371.95/ha. It is seen that considering the paddy crop alone, SGVP per cropped area is higher for A. N . Kuppam anicut system. Figure 7 below shows the variation of SGVP per unit cultivated area for both the study area considering paddy crop alone.
SGVP per unit command area
SGVP per unit water consumed
The SGVP per unit water consumed is computed considering the Evapotranspiration of the crops. The value of this indicator was found to be US$ 0.58 /m3 for A. N .Kuppam anicut system and US$ 0.45 /m3 for Kallada irrigation system. The total net crop demand for Kallada Irrigation system was obtained as 728.33mm/season and that of A.N.Kuppam anicut system was obtained as 518.27mm/season. This reveals that the production value per unit of water consumed is little better in A. N .Kuppam anicut system than Kallada Irrigation System. Figure 9shows the graph showing the variation of SGVP per unit water consumed (US$/m3) for both the study area.
But considering the SGVP per unit water consumed for the paddy crop alone, it is seen that the value ranges from US$ 6.47/m3 in A. N .Kuppam anicut system to a value of US$ 15.74/ m3 in Kallada Irrigation System. This values obtained reveals that the production value of paddy obtained per unit of water consumed in Kallada Irrigation system is better than A. N .Kuppam anicut system. Figure 10 shows the variation of SGVP per unit water consumed for the paddy crop alone.
SGVP per unit irrigation supply
This indicator specifies production value per unit of irrigation supply. The value of this indicator was found to be US$ 0.313/m3 for A.N.Kuppam anicut system and US$ 1.16/m3 for Kallada Irrigation System. Higher value of this indicator in Kallada Irrigation System indicates lower irrigation supply. In Kallada Irrigation system, the amount of water diverted is lower compared to A. N. Kuppam anicut system. This is because the farmers in this system are depending on the rainfall for the crop production and irrigation supply is done only when the rainfall is insufficient to meet the needs of crops.
Relative water supply and Relative irrigation supply
Relative water supply ratio relates water supply to demand and indicates the condition of water abundance or scarcity and how tightly supply and demand is matched. The relative water supply which measures the compensation of water demand was obtained as 4.5 for A. N. Kuppamani cut system and 5.63 for Kallada Irrigation System. The value more than 1 indicates that the water supply is enough to meet the crop demand. The results relate the value of water per unit diverted and the value per unit of water needed and it shows that the excessive irrigation water was used. Relative irrigation supply relates irrigation supply to demand. The value of this indicator computed was obtained as 3.8 for A. N .Kuppam anicut system and 2.5 for Kallada Irrigation System. The value more than 1 indicates that the irrigation supply is enough to meet the crop demand. Figure 12 shows the variation of relative water supply and relative irrigation supply for both the study area.
III. CONCLUSIONS
REFERENCES
[1] CagatayTanriverdi., HasanDegirmenci., SertanSesveren., (2011), ’ Assessment of irrigation schemes in Turkey based on management types’,
African Journal of Biotechnology, Vol. 10 (11), pp 1997-2004.
[2] Cakmak.B. Kendirli.B., Ucar.Y. (2007), ‘Evaluation of Agricultural water use: A case study of Kizilirmark’, Journal of Tekirdag agricultural faculty, Vol. 4 (2), pp 175-185.
[3] FongsamuthPhengphaengsy., Hiroshi Okudaira., (2008), ‘Assessment of irrigation efficiencies and water productivity in Paddy fields in the
lower Mekong River Basin’; Paddy Water Environ (2008), Vol 6, pp 105-114.
[4] Gorantiwar S.D., Smout I.K., (2005), ‘Performance assessment of irrigation water management of heterogeneous irrigation schemes: a
framework for evaluation’, Irrigation and Drainage Systems, Vol 19, pp 1-36
[5] HasanDeuurmencu., HakanKcangaz B.Y., Hayrettin Kupcu., (2003), ‘Assessment of Irrigation Schemes with Comparative Indicators in the
Southeastern Anatolia Project’, Turk Journal for Agriculture, Vol. 27, pp.293-303.
[6] Molden., David J., Sakthivadivel R., Christopher J. Perry., Charlotte de Fraiture., Wim H. Kloezen., (1998), Indicators for comparing