ISSN(Online): 2319-8753 ISSN (Print) : 2347-6710
I
nternational
J
ournal of
I
nnovative
R
esearch in
S
cience,
E
ngineering and
T
echnology
(A High Impact Factor, Monthly, Peer Reviewed Journal)
Visit: www.ijirset.com
Vol. 8, Issue 3, March 2019
Application of It’s in Delay and Material
Supply Chain Management
Raajam Priyadharshini R1, Prof. P. Brightson2
PG Student, Dept. of Civil Engineering, Arunachala College of Engineering for Women, Nagercoil,
Tamilnadu , India
Professor, Dept. of Civil Engineering, Arunachala College of Engineering for Women, Nagercoil,
Tamilnadu , India
ABSTRACT: The main aim of this project is to determine the delay time for the delivery of construction materials from the industry to the construction site because of the traffic congestion. Time management is an important factor in the Project Management especially when it comes to Construction Projects. Time Management is a deciding factor of which whether the project is quality worth or not. There are various factors that affects the time management. Some of them are Delay in contracts, Delay in purchasing equipments and materials, Shortage of money, Accidents, Union strike, Poor cash flow, Delay in material delivery, Poor inventory control etc. Of that, delay in material delivery can be happen if there is Poor inventory control, Unavailability of raw materials, Delay in material transportation etc.
In this project, delay in material transportation from the industry to the construction site will be calculated with respect to the present and future Traffic Volume values and those values will be compared. The final output are presented in the form of graph by using MAT LAB. Also this paper suggests the methods to reduce the traffic congestion and therefore rate of fatalities can be get reduced. To calculate the traffic volume six highly populated places in the Nagercoil Town are selected. They are Kottar, Chettikulam, Derik Junction, Vadasery, Ozhuginasery and Parvathipuram. The volume of vehicles were analysed by using Intelligent Transport System such as sensors.
I. INTRODUCTION
1.1 GENERAL
Population and economic growth has given boost to rapid outgrowth of vehicles on the streets of urban
areas throughout India. India has experienced tremendous increase in the number of registered vehicles from about 0.3 million in 1951 to about 142 million in 2011 with Compound Annual Growth Rate (CAGR) of 9.9% between 2001 and 2011. Apart from economy, rural to urban migration has amplified the demand for vehicular travel and ultimately the demand for vehicles and transportation infrastructure. However the Indian urban areas are not capable enough to tackle this upsurge of vehicular growth and have resulted into higher traffic congestion levels on the roads, posing a massive challenge for urban authorities and decision makers.
ISSN(Online): 2319-8753 ISSN (Print) : 2347-6710
I
nternational
J
ournal of
I
nnovative
R
esearch in
S
cience,
E
ngineering and
T
echnology
(A High Impact Factor, Monthly, Peer Reviewed Journal)
Visit: www.ijirset.com
Vol. 8, Issue 3, March 2019
II. LITERATURE REVIEW
2.1 Road safety in Greece
This paper analyse the road safety in Greece and confirmed that the drivers of young age and two wheeler riders at high risk of danger. This is a study paper which suggests the present road condition of Greece and it has made a risk evaluation from which they confirmed that in overall, drivers account for 66%, passengers account for 20% and pedestrians accounts for around 14% of dangers which leads to fatalities.
2.2 Creative approaches to organization and safety of road traffic
The main aim of this paper is to improve the safety at the intersection of main road and streets. For the purpose of safety improvements this paper has suggests various recommendations such as
a) Solid line marking and dashed line marking for the purpose of orientation of driving.
b) By introducing the transverse lines across the roads so as to reduce the speed of vehicles.
c) By using effective lighting system and sensor system for signaling
By implementing above techniques in the accident prone area the chances of getting accidents may be reduced to some extent. In this paper they have used sensors for improvement of safety.
2.3 Tools for road infrastructure safety management
The purpose of this article is to ensure that the risk on roads can be identified, assessed, eliminated and controlled when the roads are planned, designed, built and used. This paper involves with the risk management in highway engineering that deals with the assessment of possibility of risks and the response that have to be taken when the assessed risks are supposed to happen.
Risk response includes various methods such as road safety impact assessment method, road safety audit, road safety ranking, road safety inspection.
Road safety assessment: Road safety assessment is made at the earlier stage when the planning is done. In this stage the stuffs that do not match with the road safety standards must have been rejected.
2.4 Method of assessment and prediction of temperature conditions of roadway surfacing as a factor of the road safety
The main objective of this article is the determinate the temperature conditions of road surface and thus make a solution to reduce socio economic losses caused due to road accidents. The conclusion of this paper can be made by analyzing average temperature which are required to calculate the factors of roadway surfacing. Variations in temperature in the roadway surfacing structure are one of the important determining factors in its characteristics changes during operation.
2.5 Investigating road safety issues through a micro simulation model
In this paper they have used a micro simulation model to fix the road safety issues. Here they have used a micro simulation model namely TRITONE which is capable of controlling the speed of vehicles and also can identify the vehicle location. TRITONE can also provide the safety performance measures such as Deceleration rate to avoid a crash, Time to Collision, Crash Potential Index, Post Encroachment Time, Proportion of stopping distance.
2.6 The use of smart phone to assess the feasibility of a cooperative ITS based on surrogate measures of safety
ISSN(Online): 2319-8753 ISSN (Print) : 2347-6710
I
nternational
J
ournal of
I
nnovative
R
esearch in
S
cience,
E
ngineering and
T
echnology
(A High Impact Factor, Monthly, Peer Reviewed Journal)
Visit: www.ijirset.com
Vol. 8, Issue 3, March 2019
2.7 Traffic safety analysis of intersections between the residential entrance and urban road
The main aim of this paper is to ensure the safety parameters in the intersections between urban road and residential area entrance, which is an accident prone area. This paper provides preventive and protective measure from the aspects such as Entrance design, Driving management, Parking management, Design of traffic signs, Consummation of laws and regulation etc.
2.8 Speed management for local and regional rural roads
The main aim of this paper is to control the speed of the vehicle in order to reduce the probability of getting accident. The experiment was carried out by following a vehicle with a video VBox device. The device equipped with an external antenna and video recorder allows for the determination of speed of vehicle and coordinates of vehicle. The accuracy of the device will be higher even if the signal is temporarily lost.
III. DATA COLLECTION
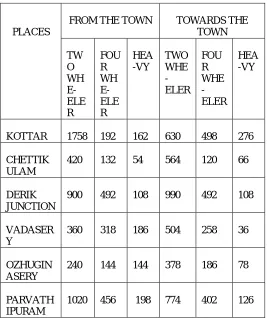
3.1 Traffic volume
Traffic volume is defined as the number of vehicles crossing a section of road per unit time at any selected period.
Table 1.1 Volume of traffic in Nagercoil Town
PLACES
FROM THE TOWN TOWARDS THE
TOWN
TW O WH E-ELE R
FOU R WH E-ELE R
HEA -VY
TWO WHE - ELER
FOU R WHE - ELER
HEA -VY
KOTTAR 1758 192 162 630 498 276
CHETTIK ULAM
420 132 54 564 120 66
DERIK JUNCTION
900 492 108 990 492 108
VADASER Y
360 318 186 504 258 36
OZHUGIN ASERY
240 144 144 378 186 78
PARVATH IPURAM
ISSN(Online): 2319-8753 ISSN (Print) : 2347-6710
I
nternational
J
ournal of
I
nnovative
R
esearch in
S
cience,
E
ngineering and
T
echnology
(A High Impact Factor, Monthly, Peer Reviewed Journal)
Visit: www.ijirset.com
Vol. 8, Issue 3, March 2019
3.2 Traffic delay
Traffic delay is defined as the additional travel time experienced by a driver, passenger or pedestrian due to
circumstances that impede the desirable movement of traffic. It is measured as the time difference between actual travel time and free flow travel time. It can be calculated by using the following formula.
Dz = L [(1/Vz) – (1/Vf)] where
Dz = Delay
L = Length of traffic congested area Vz = Speed in the traffic congested area Vf = Freeway speed
Site 1: L = 0.7, Vz = 1, Vf = 40, Therefore, Dz = 40.95 Site 2: L = 0.6, Vz = 1, Vf = 35, Therefore, Dz = 34.971 Site 3: L = 0.5, Vz = 1, Vf = 45, Therefore, Dz = 29.33 Site 4: L = 0.3, Vz = 1, Vf = 30, Therefore, Dz = 17.4 Site 5: L = 0.4, Vz = 1, Vf = 35, Therefore, Dz = 23.314 Site 6: L = 0.6, Vz = 1, Vf = 35, Therefore, Dz = 34.971 Site 7: L = 0.4, Vz = 1, Vf = 40, Therefore, Dz = 23.4 Site 8: L = 0.5, Vz = 1, Vf = 40, Therefore, Dz = 29.25 Site 9: L = 0.4, Vz = 1, Vf = 30, Therefore, Dz = 23.2 Site 10: L = 0.6, Vz = 1, Vf = 35, Therefore, Dz = 34.971
Average delay time = (40.95 + 34.971 + 29.33 + 17.4 + 23.314 + 34.971 + 23.4 + 29.25 + 23.2 + 34.971)/10 = 29.18 minutes
3.3 List of accidents
IV. DATA PROCESSING
4.1 Future prediction of traffic volume
YEAR NUMBER OF ACCIDENTS
ISSN(Online): 2319-8753 ISSN (Print) : 2347-6710
I
nternational
J
ournal of
I
nnovative
R
esearch in
S
cience,
E
ngineering and
T
echnology
(A High Impact Factor, Monthly, Peer Reviewed Journal)
Visit: www.ijirset.com
Vol. 8, Issue 3, March 2019
4.2 Future delay calculation
Total number of present traffic volume = 13770 Total number of future traffic volume = 68850
Delay time in material delivery with respect to present traffic volume = 29.18 min Therefore delay time in material delivery with respect to future traffic volume
= (29.18/13770) X 68850 =145.900 minutes
4.3 Comparing the values
Future delay time is approximately five times higher when compared to the present delay time. Therefore it should be reduced in order to carry out the construction project a successful one without any delay.
V. CONCLUSION
Day to day increase in traffic volume makes our life more complicated in one or another way. This project has analysed the probability of getting delay in delivery of materials in construction site due to heavy traffic volume after 5 years. This type of delay which caused due to heavy traffic congestion can be resolved by reducing the traffic volume. By implementing the above mentioned methods the traffic volume can be get reduced to some extent and thus the conflicts arise in the construction site due to late material delivery can be fixed. And the main benefit of reducing the traffic volume is that the probability of occurring accident can be minimized and thus the number of fatalities can be reduced. By valuing the human lives the most and in order to get minimize the accident rate it is must to reduce the traffic volumes.
ACKNOWLEDGEMENT
First and foremost I thank the almighty God for his wonderful presence with me throughout the completion of this project. This is great pleasure to express my deep sense of gratitude and thanks to our HOD Prof. B. Parthasarthi M.E.,(Ph.D)., Project Guide and Publishing Guide Prof. Brightson M.E., (Ph.D)., for their valuable ideas, instantaneous help, effective support for the completion of this project.
REFERENCES
1. George Yannis and Eleonora Papadimitriou (2012), Road safety in Greece, Procedia – Social and Behavioral Sciences, pp. 2839 – 2848 2. Kazimierz Jamroz and Marcin Budzynski (2014), Tools for road infrastructure safety management, Transportation Research Procedia, pp. 730 -
739
3. Manzhen Duan and Hongying Ya (2013), Traffic safety analysis of intersections between the residential entrance and urban road, Procedia – Social and Behavioral Sciences, pp. 1001 - 1007
4. Oksana Batishcheva and Alexander Ganichev (2017), Creative approaches to organization and safety of road traffic, Transportation Research Procedia, pp. 36- 40
5. Stanislaw Gaca and Mariusz Kiec (2016), Speed management for local and regional rural roads, Transportation Research Procedia, pp. 4170 - 4179
6. Vittorio Astarita and Alessandro Vitale (2011), Investigating road safety issues through a micro simulation model, Procedia Social and Behavioral Sciences, pp. 226 - 235