Abstract
KATSIOLOUDIS, PETROS JOSEPH. Identification of Quality Indicators of
Visual-based Learning Material in Technology Education Programs for Grades 7-12. (Under the direction of Dr. Aaron Clark.)
The purpose of this study was to identify the quality indicators of visual-based learning material in technology education for grades 7-12. A three-round modified Delphi method was used to answer the following research questions: RQ1: What indicators should quality visual-based learning material in technology education have to be effective and efficient in transmitting information for grades 7-12? RQ2: What are the indicators of the learner’s characteristics that impact the selection of visual-based learning material in
IDENTIFICATION OF QUALITY INDICATORS OF VISUAL-BASED LEARNING MATERIAL IN TECHNOLOGY EDUCATION
PROGRAMS FOR GRADES 7-12
by
PETROS JOSEPH KATSIOLOUDIS
A dissertation submitted to the Graduate Faculty of North Carolina State University
In partial fulfillment of the Requirements for the Degree of
Doctor of Education
TECHNOLOGY EDUCATION
Raleigh, NC 2007
APPROVED BY:
___________________________ ___________________________ Aaron Clark V.W. DeLuca
Committee Chair
Dedication
Biography
Petros Joseph Katsioloudis was born in Nicosia, Cyprus. He is one of the three children of Joseph and Joanna Katsioloudi. Joseph is a technology education teacher, and Joanna is an accountant for Cyprus Airways.
Petros received a Bachelor of Science and a Master of Education from California University of Pennsylvania. His undergraduate degree is in Science and Technology and his master’s degree is in Technology Education. Petros also received a Gunsmith certificate of trade from the Pennsylvania Gunsmith School.
Acknowledgments
Table of Contents
Section Page
List of Tables---ix
List of Figures---x
Chapter One: Introduction ---1
Need for Study ---2
Purpose of the Study---4
Significance of the Study ---4
Research Questions ---4
Assumptions ---5
Limitations---6
Research Methodology ---7
Definition of Terms--- 11
Chapter Summary--- 13
Chapter Two: Literature Review--- 14
Learning Styles--- 15
Kolb’s Learning Styles --- 17
Preferred Sensory Modalities--- 20
Teaching and Learning Style Research in Technology Education --- 21
Table of Contents (Continued)
Section Page
Visual Literacy --- 25
Visual Thinking --- 27
Visual Learning --- 28
Spatial Visualization--- 29
Importance of Visualization --- 33
Unsolved Visualization Problems--- 36
Descriptive and Depictive Representations --- 40
Instructional Materials--- 41
Scientific and Technical Visualization Curriculum --- 43
Technology Education--- 44
Technology Education and Visualization --- 48
Visual-based Learning Material Grants --- 49
Quality --- 55
Quality Indicators --- 56
Quality in Higher Education --- 56
Quality in Technology Education --- 57
Quality Instructional Material --- 58
Chapter Summary--- 58
Table of Contents (Continued)
Section Page
Delphi Method --- 60
Computer-based Delphi --- 63
Web-based Delphi --- 63
Delphi Panel Selection --- 64
Sources for Potential Panelists --- 64
Delphi Panel Selection --- 63
Sources for Potential Panelist--- 63
Group Nomination --- 67
Instruments Design and Implementation --- 72
Chapter Summary--- 79
Chapter Four: Research Findings --- 81
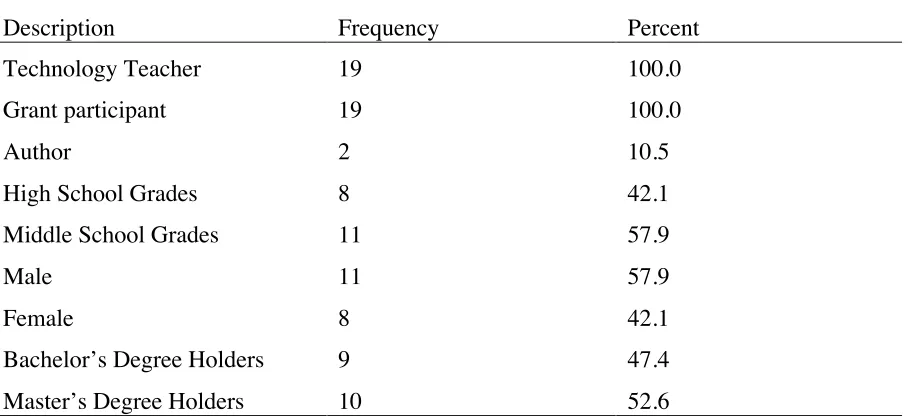
Demographic information about participants --- 82
Round One of the Modified Delphi Method --- 84
Round Two of the Modified Delphi Method --- 90
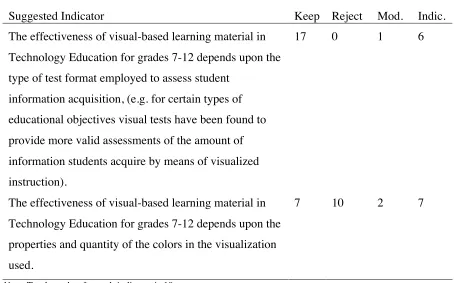
Visual-based Quality Indicators Identification --- 95
Indicators Rating ---101
Round Three of the Modified Delphi Method ---109
Chapter Summary---112
Chapter Five: Conclusions and Recommendations ---113
Table of Contents (Continued)
Section Page
Conclusion for Hypotheses ---116
Implications of the Research---120
Implications for conducting Future Research---121
Recommendations for Further Research ---123
Chapter Summary---124
References ---126
List of Tables
Table Page
Table 1. Kolb’s Learning Styles --- 18
Table 2. Kolb’s definition of Four Learning Modes--- 19
Table 3. Chaomei’s 10 unsolved visualization problems --- 36
Table 4. Technology Education definitions --- 44
Table 5. The twelve VisTE units--- 51
Table 6. The TECH-Know units --- 53
Table 7. SciVis Objectives --- 54
Table 8. Summary of Demographic Information on Expert Panel --- 83
Table 9. Delphi Round One Suggested Indicators --- 86
Table 10. Modifications made to Indicators from Round I to Round II --- 88
Table 11. Suggested New Indicators for Round II--- 89
Table 12. Overall Means and Standard Deviations for Round II --- 92
Table13. Kruskal-Wallis and Mann-Whitney Test results --- 97
Table 14. Spearman’s Rho Test---102
Table 15. Ten most Important Indicators from High & Middle School ---105
Table 16. Ten least Important Indicators from High & Middle School ---107
Table 17. Mann-Whitney Test results for Final round ---110
List of Figures
Figure Page
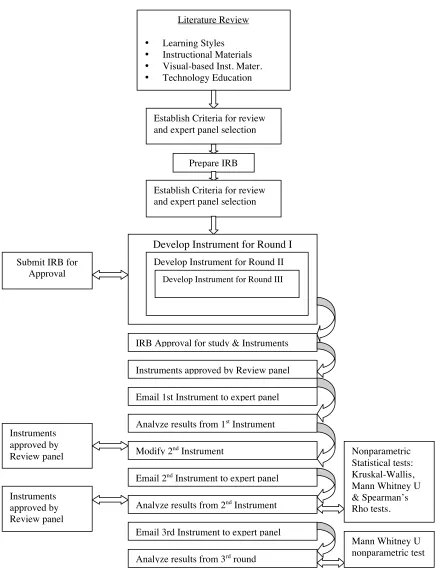
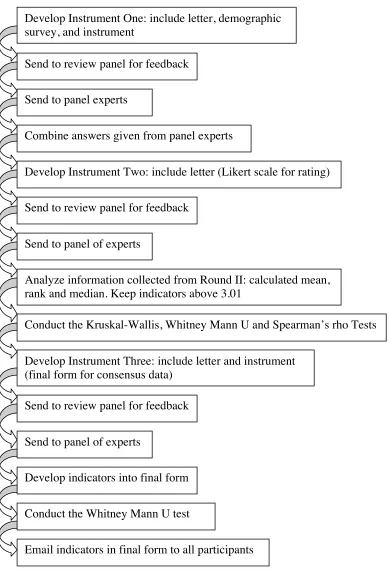
Figure 1. Outline of Methodology --- 10
Figure 2. Outline of Literature Review --- 14
Figure 3. Relationships of Areas of Study in Visual Literacy --- 26
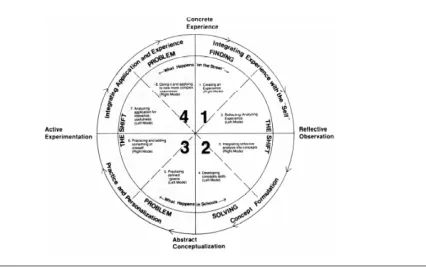
Figure 4. The complete 4MAT System Model --- 42
Figure 5. Conceptual Framework of the VisTE Instructional Materials --- 50
Chapter One: Introduction
In learning environments throughout education, the visual elements of courses, lessons, and presentations play an important role in learning. Well-conceived and rendered visuals help any audience understand and retain information (Wileman, 1993).
According to Clark and Mathews (2000), the use of visual technology enhances learning by providing a better understanding of the topic as well as motivating the students. Visualization methods are widely credited for simplifying the presentation of difficult subjects as well as aiding cognition; their use in the power engineering industry and education is enjoying significant growth. (Idowu, Brinton, Hartamn, Nehard, Abraham & Boyer, 2006). Even though the success by which content visualization will facilitate the learner’s acquisition of information is related to the individual’s level of perceptual and associative learning in the content area, the individual must have sufficient experience and maturity to realize that using visualization is merely an attempt to represent reality
vicariously (Dwyer, 1978). Much of intended visual communication or self-expression is not perceived, or often misunderstood, especially if it is complex (Lantz, 2000). In addition to the individual’s experience, the visualization itself plays an important role in the learning
process.
whether one type of visual is any more effective than another in transmitting certain types of information (Dwyer, 1978). The lack of quantifiable measures of quality and benchmarks will undermine information visualization advances, especially their evaluation and selection (Chaomei, 2005).
The significance of this dilemma is brought into focus when one becomes aware of the amount of visual-based learning materials that are being used today in the private and public educational sector. “As might be expected, the types of visual-based materials used for instructional purposes are the ones that have become most readily available” (Dwyer, 1978, p. 4).
However, the extensive use of a certain type of visual-based material does not necessarily justify its effectiveness and efficiency. The profusion of visual displays of
information without an educated guide to meanings discerned from the information has led to a groundswell of movements seeking to develop metrics and quantifiable quality measures (Idowu, Brinton, Hartamn, Nehard, Abraham & Boyer, 2006).
Need for Study
youth and adults in middle school, high school and college level " (U.S. Department of Education, 2003).
Since the early 1980s there has been very little research to use when selecting specific types of visuals that will be most effective and efficient in facilitating student achievement of designated learning objectives.
What is urgently needed is systematic research efforts focused on three basic areas designed to provide data on: (a) what specific individual difference variables in learners actually make a difference in student achievement in the teaching learning process, (b) which of these individual difference variables interact significantly with different kinds of visualization used to complement oral/printed instruction, and (c) what is the extent of the range within specific individual difference variables that are accommodated by the use of specific types of visualization (Dwyer, 1978, p. 5). Once we can describe what makes a particular visual successful to us, we can apply this knowledge to the design of completely new visuals (Lantz, 2000, p. 19). In instruction, an image may be studied for a long time by the viewer and still be unsuccessful (Lantz, 2000, p.20).
Purpose of the Study
Presently, educators, when faced with a choice of selecting one type of visual-based learning material from a plethora of available materials, have difficulty knowing whether one type of visual-based materials is any more effective than another in transmitting certain types of information. As a result, these differences have been found to have differential effects on the achievement level of students (Dwyer, 1972a). In terms of technology education, the availability of many different types of visual-based learning materials is confusing and may make the selection of the most effective impossible.
Therefore, the purpose of this study will be to identify those indicators in visual-based learning material to provide effective knowledge transmission in technology education materials for middle school and high school grades (7-12).
Significance of the Study
The study data are essential in making informed decisions about choosing specific indicators (see definitions) of visual-based learning material for most effective and efficient student achievement of designated learning objectives. It is expected that the indicators identified by this study will be beneficial to technology educators developing visual-based learning material. In the future, this study also will provide information to authors of visual-based learning material and can serve as a guide for future middle and high school material.
Research Questions
The major emphasis of this study involved determining the indicators that visual-based learning material used in technology education for grades 7-12 must have to transmit
to such material. To achieve this task two research questions were proposed dealing with visual-based learning material:
1. What indicators must visual-based learning material in technology education for grades 7-12 have to be effective in transmitting information?
2. What are the indicators of the learner’s characteristics that impact the selection of visual-based learning material in technology education for grades 7-12?
Assumptions
The following assumptions will be considered throughout the process and procedures used within the study:
1. There is a need to establish quality indicators to be used as benchmarks in technology education visual-based learning material for grades 7-12.
2. Teachers, grant participants and other experts will respond to the data-collecting instrument in a non-biased way.
3. Teachers, grant participants and other experts participating in the study will be knowledgeable of visual-based learning material in technology education. 4. Teachers participating in the study will have at least three years of teaching
experience in middle or high school and will have served as full-time technology education teachers.
5. Teachers, grant participants and other experts responding to the data collecting instruments will understand all directions.
7. Quality indicators will be validated through three rounds of a modified Delphi process using a panel of experts in technology education.
8. Teachers, grant participants and other experts participating in the study own a computer with Internet connection and email accounts.
Limitations
1. The potential limitations of this study are biases introduced by the methods used to select participants, design questionnaires, and process results (Lang, 1998).
2. Information generated for this study about the indicators that a visual-based learning material must have is linked fundamentally to panel members’personal values, concepts, ideas, experience, and quality opinions (Woudenberg, 1991).
3. For this study, the web-based modified Delphi method was used for collecting information and achieving consensus. Therefore, participation was limited to individuals who have Internet access.
4. Due to distance, costs and time constraints, three data-collecting instruments and three follow-up emails were used to gather information for the modified Delphi method.
5. Respondents in this study were limited to individuals who were identified by predetermined criteria.
Research Methodology
The procedures for this research study began with a proposal for conducting the study and a review of literature to acquire information related to the subject and subject matter. The study used a modified Delphi method for identifying the quality indicators of supplemental technology education visual-based learning material for the middle and high school grades. The approach used in this study to achieve its purposes was the online modified Delphi methodology. Many existing research studies in the area of information technology utilize the Internet and the World Wide Web as media to collect consensus data (Nesbary, 2000). This study involved three rounds to achieve consensus among a group of experts in visual-based learning material who were experienced technology teachers involved in pilot and field-testing for visual-based learning material grants. The number of rounds depended on reaching consensus among panel members. Most Delphi studies find that more than three rounds do not add significant value (Clayton, 1997). All data was gathered via a web site created to host the study and the World Wide Web as a primary mode of communication using Web-based instruments. Upon completion of the modified Delphi method, the
indicators of visual-based learning material for middle and high school technology education courses were identified.
also helped to prevent bias by the researcher during the editing and modifications made to the instruments between rounds. The review panel also participated as a test-piloting group to ensure the instrument being used for a given round was reader-friendly and easily understood (Meyers & Booker, 1990).
The instrument for Round I of the modified Delphi method was developed from information found in the literature of review. Examples of quality indicators were established and placed in a survey instrument. Once the review panel approved the instrument, the expert panel was given access to the instrument on the web through a username and password. An email also was sent to panel members after two weeks as a reminder to complete and return the instrument. Results from Round I were tabulated, with like indicators collapsed together. Participants remained anonymous to each other, avoiding influences of reputation, authority or affiliation. This enabled panel members to change their opinions without losing face (Martino, 1993).
hypothesis-testing situation involving a design with two independent samples and testing for significant difference between the two medians.
Round III consisted of ranking the information gathered from Round II. Indicators kept from this round were those that ranked in the upper 50 percent above the statistic mean from Likert scale. Those indicators were kept since each was ranked highest by the expert panel, and, therefore, had the highest consensus. In Round III each expert panel member was asked to approve the final outcomes as established from Round II of the modified Delphi method. Once the review panel approved, the third and final round access was given to the experts to complete the instrument. Expert panel members were asked to accept or reject each indicator kept from Round II. The Mann-Whitney U nonparametric test was employed with ordinal (rank-order) data in a hypothesis-testing situation involving a design with two independent samples and testing for significant difference between the two medians.
Figure 1. Outline of Methodology
Establish Criteria for review and expert panel selection
Establish Criteria for review and expert panel selection
Develop Instrument for Round I Develop Instrument for Round II
Develop Instrument for Round III
Instruments approved by Review panel Email 1st Instrument to expert panel Analyze results from 1st Instrument Modify 2nd Instrument
Email 2nd Instrument to expert panel Analyze results from 2nd Instrument Email 3rd Instrument to expert panel Analyze results from 3rd round IRB Approval for study & Instruments
Instruments approved by Review panel Instruments approved by Review panel Literature Review • Learning Styles • Instructional Materials • Visual-based Inst. Mater. • Technology Education
Prepare IRB
Submit IRB for Approval
Nonparametric Statistical tests: Kruskal-Wallis, Mann Whitney U & Spearman’s Rho tests.
Definition of Terms
Delphi Method – “Delphi may be characterized as a method for structuring a group communication process so that the process is effective in allowing a group of individuals, as a whole, to deal with a complex problem” (Linstone & Turoff, 2002).
Modified Delphi Method – “It utilizes rounds of a survey, with questions
dropping off, new questions being added, and participants being able to see anonymous responses from other participants. Unlike the original Delphi, a modified Delphi method provides panelists with opportunity to provide their comments between the rounds” (Murray & Hammons, 1995).
Visual-based Learning Material –“Learning material that includes various types of visual aids such as pictures, animations, drawings and prototypes that can be used effectively to teach facts, data, directions, processes, and invisible concepts that are often complex or elusive” (Wileman, 1993).
Technology Education –“Provides a wholesome change in learners by enhancing the understanding of how technology is changing the human-made world and the natural
environment. It allows learners to experience the activities and habits of a designer, scientist, technologist, engineer, architect, producer, historian, and social critic as they engage in technological problems and issues of the present and future” (ITEA, 1995).
ITEA –“The International Technology Education Association is the largest
institutions throughout the world in more than 45 countries with the primary membership in North America” (ITEA, 1995).
Web-Based Delphi –“Web-Based Delphi, a kind of Technology-Enhanced Delphi, is an electronic form of Delphi using the Internet and the World Wide Web as a primary data collection” (Andrews & Allen, 2002),
Interquartile Range (IQR) – The absolute value of the difference between the 25th and the 75th
quartiles, with smaller values indicating higher degrees of consensus.
Expert – “An expert is someone who has acquired extensive knowledge that affects what they notice and how they organize, represent, and interpret information in their environment” (Council, 2000).
Visualization Indicators –“Indicators of visualization that determine the relative effectiveness with which different kinds of Visual material facilitate student achievement of different types of educational objectives” (Dwyer, 1978).
TECH-Know – “The TECH know Project is based on 20 technology-based problems issued by the Technology Student Association (TSA). The problems cover a wide variety of topics in construction, communication, manufacturing, and transportation technology. The competition engages students in hands-on, problem-based learning and is based upon fundamental science, mathematics, and technology concepts” (TECH-Know, 2004).
VisTE – “Visualization in Technology Education is a National Science Foundation funded project, that promotes technological literacy by linking to the Standards for
technology education in grades 8-12” (VisTE, 2005).
Visualization – “Visualization is the process of constructing methods that are able to synthesize interesting and informative images from data sets in order to simplify the process of interpreting the data” (Olsson, 2004).
Visual Literacy – “The individual’s ability to analyze, discuss, gain meaning, interpret, and express self through various visual forms, such as advertising, dance, word poetry, paintings, photographs, cartoons, etc. . .’’ (Golubieski, 2003).
Chapter Summary
Being able to satisfy students with different learning styles by promoting efficient knowledge transmission has been a challenge for the last 50 years. Educators from around the globe are trying to identify the most competent instructional material to achieve this task. The challenge is even greater for technology education material that relates to visual learning since only a limited amount of research exists. Therefore, it is of great importance to conduct a study that will identify the quality indicators of visual-based learning material in
technology education to help educators choose the most appropriate material for specific learning environments. Through a three-round modified Delphi method, this study attempted to identify those quality indicators. More research will be needed beyond this study to facilitate the goal of improving the quality of visual-based learning material in technology education for grades 7-12.
Chapter Two: Literature Review
Figure 2. Outline of Literature Review History of Visual
Pedagogy Instructional Materials Technology Education Kolb’s Learning Styles Preferred Sensory Modalities Visual Literacy Visual Thinking Learning Styles Descriptive and Depictive Representations Tech.Ed Visual Material Grants Realism in Visualization Technology Education Visual -based Instructional Material Visual Illustrations TECH-Know Technology Education and Visualization Importance of Visualization Unsolved Visualization Problems VisTE Scientific and Technical Visualization Curriculum History of Technology Education Visual Learning Teaching & Learning Style in
Technology Education
Learning Styles
As defined by Light and Cox, learning is “an active and meaningful construction of facts, ideas, concepts, theories, and experiences in order to work and manage successfully in a changing world of contexts” (Light & Cox, 2001). Learners make the most out of
information when they can select information and organize it into representations that make sense to them (Jonassen, 1999; Mayer & Moreno, 2000; Mayer, 1996; Mayer, 1999b; Wittrock, 1990). Those sense-making indicators that determine individual differences in learning are the learning styles. Learning styles can be defined broadly as “the characteristic behaviors of learners that serve as relatively stable indicators of how they perceive, interact with, and respond to the learning environment” (Keefe, 1979).
Many researchers have proclaimed the significance of identifying preferred teaching styles and preferred learning styles. Claxton and Ralston (1978, in Miller, 1982) alluded to this significance:
The research findings on learning styles offer substantial promise to teachers, counselors, and the students themselves in terms of finding better ways for students to learn. But while matching learning style with instructional mode apparently facilitates positive interpersonal relations, and while it would seem to point the way for increased learning, the empirical data that support this idea are rather scarce. Such a significant gap in the research must be filled if knowledge about learning styles is to become a significant force in improving college and university teaching (p. 36).
the different areas of style can be overwhelming for educators. Corbett and Smith (1984) stated:
Learning style is a complex construct involving the interaction of numerous elements; thus, at the outset, the experimenter is faced with the difficult task of having to decide which dimensions of learning style to elucidate and which interactions might be meaningful, in a practical sense, in understanding their contribution to achievement (p. 212).
According to Kelly (1997), there are two major benefits to understanding one’s learning style. First, it helps people to understand areas of weakness and second, it helps people to realize their strengths. This gives students the opportunity to become more proficient. Using a learning style inventory helps students to understand their learning styles, and as stated by Knox (1986), “make transitions to higher levels of personal and cognitive functioning “ (p.25). In addition to being beneficial to the student, knowing a student’s learning style can benefit the teacher as well. It allows the teacher to cover materials in a way that best fits the diversity of the classroom (Kelly, 1997). According to DeBello (1985), Giannitti (1988), and Miles (1987), students learn more and like learning better when taught using their identified learning styles.
preferences for learning that favor some learning abilities over others. He reports that there are four basic learning modes: concrete experience, reflective observation, abstract
conceptualization, and active experimentation that describe the learning preferences of everyone.
Kolb’s Learning Styles
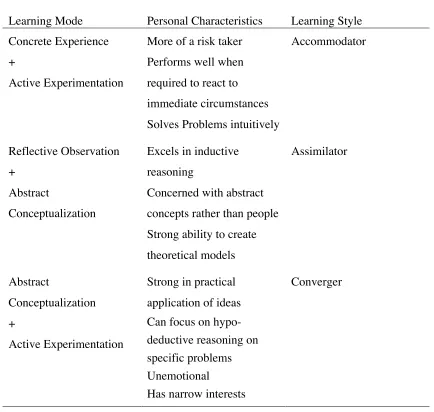
Visual-based learning material for technology education programs uses only one form among all learning styles: the visual learning. However, for a comprehensive, well-rounded study, the familiarization with all learning styles is of great importance. One of the leading researchers for learning styles was Kolb who created the Learning Style Inventory, where he explains in great detail all known learning styles and their indicators.
The Learning Style Inventory (LSI) was created by Kolb (1984) to “assess individual orientations toward learning” (p.67). He developed this instrument with four design objectives. First, “the test should be constructed in such a way that people would respond to it in somewhat the same way as they would a learning situation” (p.67). Second, “a self-description format was chosen for the inventory” (p.68). Kolb stated that a person giving a description of his/her self image would be more powerful than not providing a personal image. Third, “the inventory was constructed with the hope that it would prove to be valid – that the measures of learning styles would predict behavior in a way that was
Table 1
Kolb’s Learning Styles
Learning Mode Personal Characteristics Learning Style Concrete Experience
+
Active Experimentation
More of a risk taker Performs well when required to react to immediate circumstances Solves Problems intuitively
Accommodator
Reflective Observation +
Abstract
Conceptualization
Excels in inductive reasoning
Concerned with abstract concepts rather than people Strong ability to create theoretical models Assimilator Abstract Conceptualization + Active Experimentation
Strong in practical application of ideas Can focus on hypo-deductive reasoning on specific problems Unemotional
Has narrow interests
Converger
Table 2
Kolb’s Definition of four Learning Modes Learning Mode Description
Concrete Experience Focuses on being involved in experiences and dealing with immediate human situations in a personal way. It emphasizes feeling as opposed to thinking; a concern with the uniqueness and complexity of present reality as opposed to theories and
generalization; an intuitive, artistic approach as opposed to the systematic, scientific approach to problems.
Reflective Observation
Focuses on understanding the meaning of ideas and situations by carefully observing and impartially describing them. It emphasizes understanding as opposed to practical application; a concern with what is true or how things happen as opposed to what will work; and emphasis on reflection as opposed to action.
Abstract
conceptualization
Focuses on using logic, ideas, and concepts. It emphasizes thinking as opposed to feeling; a concern with building general theories as opposed to intuitively understanding unique, specific areas; a scientific as opposed to an artistic approach to problems. Active
Experimentation
Focuses on actively influencing people and changing situations. It emphasizes practical applications as opposed to reflective
understanding; a pragmatic concern with what works as opposed to what is the absolute truth; an emphasis on doing as opposed to observing.
Understanding one’s preferred learning style has two benefits: It helps us understand our areas of weakness, giving us the opportunity to work on becoming more
Therefore, in the case of visual-based learning material development, it is essential to be familiar with all learning styles, including visualization, since some students will have more than one preferred learning style.
Preferred Sensory Modalities
Learning styles are categorized by sensory modalities, which include visual, auditory, tactile and kinesthetic. Barbe and Swassing (1979) were the first researchers to develop a standardized performance measure of learning style based on modality strength. Modalities are defined as the channels through which individuals receive and retain information. The educationally relevant modalities are visual, auditory, kinesthetic and reading.
Modality strength and a modality preference are not the same. A modality strength means superior functioning in one or more perceptual channels. A modality preference is just a preference and is usually measured by self-report instruments (Barbe & Milone, 1981). Auditory learners use their voices and their ears as the primary mode for learning. Some learners find their visual modality is stronger in helping them
understand and remember new concepts. Some people learn better when they touch and are physically involved in what they are learning. Many successful learners can function in more than one modality. An individual’s dominant modality is that channel through which information is processed more proficiently. Many people also process a second modality (Guild & Garger, 1998).
or musical performances. Finally, the third sensory channel expressed in students is a
kinesthetic awareness. Kinesthetic learners explore the environment with their entire body, in activities such as playing musical instruments, using creative movement, and dancing
(Cambell & Kassner, 1995).
The basic question in instruction is how to proceed in order to facilitate the acquisition of essential background information by individuals who have not had the opportunity to benefit from first-hand experience or other forms of experiential learning (Dwyer, 1978). The answer to this question is not a simple one since there are many objects, situations, and processes that are not easily accessible to the student. However, the strategy commonly used to fulfill the need for concrete personal experience and to facilitate learning has been to integrate visual-based learning by trying to reproduce the conditions and
environment of certain learning conditions as closely as possible to real life settings. To achieve the task of learning environment reproduction, teachers use tools such as animation software, visualizations and visual-based learning material.
Teaching and Learning Style Research in Technology Education
Industrial arts teachers demonstrated a high preference for working with things and preferred direct experience as opposed to the lecture approach of instruction (Reed, 2000). These findings reflect the unique history and support the theoretical base of technology education (Anderson, 1926; Bennett, 1926, 1937; Martin, 1995; International Technology Education Association, 1985, 1988, 1991; Technology for All Americans Project,
1996, 2000).
Technology Education Association (ITEA) members, the Myers-Briggs Type Indicator (MBTI) was administered in an attempt to distinguish technology teachers from the general population and from secondary educators. Wicklein and Rojewski found that 69 percent of their sample was practical, realistic, and preferred to solve problems conceptually
through structured investigation and inquiry. Comparing the results to the general population, Wicklein and Rojewski's (1995) sample demonstrated a greater preference for a sensing-judgment temperament type and a lower preference for a sensing-perception temperament.
Kuskie and Kuskie (1999) created a learning style instrument for use in secondary technology education classrooms. Specifically, the Learning Channels Inventory
(LCI) was designed "(a) to enhance the learning of technology curriculum, (b) to consider how students might most effectively learn and use the technology
equipment, and (c) to expand the instructional methods of the technology teacher" (Kuskie and Kuskie, 1999, p. 77). The LCI is a paper and pencil test that measures visual, auditory, and psychomotor preferences. After conducting the study, Kuskie and Kuskie noted that using a variety of visual, auditory or psychomotor activities can enchance individual and cooperative learning.
Similar to Kuskie and Kuskie, Tappenden (1983) examined the learning styles of secondary vocational education and non-vocational education students. Tappenden used the Learning Style Inventory (LSI) created by Dunn, Dunn and Price (1984). According to Reed (2000), Tappenden found that vocational and non-vocational students have significantly different learning styles.
of matching the perceptual strengths of technology education students with instructional materials that complemented their strongest perceptual inclinations. Using a sample of 65 technology education students and 65 non-technology education students, Kroon gave the LSI test to identify preferred learning style. Based on the results Kroon concluded that technology education students preferred tactual (related to the sense of touch) activities but did not prefer kinesthetic (related to the sense of motion) activities.
The research on teaching and learning styles in technology education demonstrates support for a variety of teaching methods and emphasizes the differences between the learning styles of technology education teachers, the general population, and secondary teachers. One of the learning styles used in technology education is the visual (Reed, 2000).
History of Visual Pedagogy
During the second half of the twentieth century, the world was marked by the global expansion of the communications media and the burgeoning visual culture, radically altering the dissemination and production of information and knowledge. In the educational world, however, visual media culture was perceived as a threat to literacy but also was touted as a potentially powerful tool for educators (Goldfarb, 2002).
and to use language – in the forms of reading, writing and speech-as politicized action. (Freire, 1968).
However, Freire wrote during a period when technologies of the word were being transformed through new media forms such as television and computers in public education. These media supplemented the hallowed forms they embodied, and his followers viewed written word with electronic and digital image and text as seductive techniques of
institutional and bureaucratic control. Therefore, the visual media were disparaged for their perceived status as pedagogical tools for global capitalism (Goldfarb, 2002, p.3).
The transition from voice and writing to media and a visual logic of knowledge production occurred not only in the elite western institution but also in the third world settings that were the basis for Freire’s early ideas about pedagogy. From the late 1950’s through the 1970’s, the third world was tapped as a testing ground for educational-technology systems that would transform educational philosophy and practice in United States schools and institutions in the 1980’s and 1990’s (Goldfarb, 2002, p.4). One of
Despite political reasons and interests, the desire for cost-efficient ways to educate large numbers of people for the benefit of serving larger and more diverse populations in a globalizing economy was one factor that motivated the testing of educational media both locally and at a distance. Another view that held sway was that language difference and illiteracy could be surmounted using graphic and visual symbols to introduce “more complex” discursive forms. This concept also was supported by Jean Piaget’s popular theories of child psychology, which consider symbolic language acquisition as a more primitive, basic precursor to the complexities of learning written language (Goldfarb, 2002, p.6). However, literature challenges the belief that the visual occupies lower levels of knowledge than writing forms. The philosophy, for example, of the electronic classroom intersects in a complex way with the philosophy of hands-on media production training. As Ira Shor (1970) explains, a pedagogical philosophy of vocationalism under the name of career education blossomed in the U.S. public school system in the early1970’s. Hands-on experience with media was one of the career skills worth cultivating in public school
workforce training. Technological know-how did not replace book learning but rather it was a class-based view of media production’s potential to transform politics of difference in schools (Goldfarb, 2002, p.6).
Visual Literacy
Before I begin describing the theoretical roots, I would like to establish a baseline from which to work regarding the discipline of visual literacy, which is a general term containing the subcategories of visual thinking, visual learning, and visual
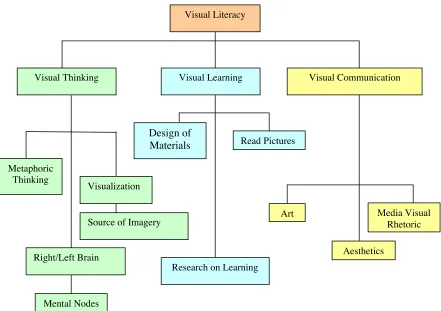
Figure 3. Relationships of Areas of Study in Visual Literacy
The umbrella term, visual literacy, encompasses visual thinking, visual learning and visual communication (Brizee, 2003). In the broader terms then, visual literacy in this diagram is the overall discipline with subcategories related to the use of visuals from the most
rudimentary (visual thinking), to the acquisition of information through visuals (visual learning), to the use of visuals to convey data (visual communication). The reason this diagram is presented in this study is to provide a clear baseline for the parameters visual-based learning material needs to cover to be efficient as it relates to knowledge transmission.
Visual Literacy
Visual Thinking Visual Learning Visual Communication
Metaphoric Thinking
Right/Left Brain
Mental Nodes
Visualization
Source of Imagery Design of
Materials Read Pictures
Research on Learning
Art Media Visual
Visual Thinking
Rudolph Arnheim in his landmark text, Visual Thinking, re-ignited the debate between educators on the subject of visual cognition and its influence on our thinking and learning process (Arnheim, 1969). According to Arnheim, our thinking process is heavily influenced by our visual interaction with the world around us and the key elements of our cognitive abilities are tied to visual thinking. Therefore, educators must re-integrate visual learning at the elementary school stages of education rather than splitting visual thinking away from the study of letters and numbers (Brizee, 2003, p. 7).
Arnheim claims that visual thinking is an essential step in human cognition and that this visual cognitive process contributes to our ability to think. Detailing this process,
Arnheim explains the innate cognitive qualities of visual thinking when he states: At early organic levels, the stimulus compels the reaction. When a strong light enters the visual field, the infant turns toward it as though directed by an outer controlling power …this is the prototype of a cognitive response unconditionally surrendered to the object of attention. The response is steered by the stimulus rather than by the initiative of the observer (p. 21).
deep-seated uncertainty within western philosophy which even now profoundly affects our teaching. In our earliest classes, we play with and use brightly colored blocks, large images of animals and fire engines, and more recently, striking computer graphics to discover the world around us. Visual thinking and learning is an intricate part of our cognitive process, and Arnheim states that we should re-integrate it into our education systems (Brizee, 2003).
Visual Learning
Visual Learning is the “permanent change in behavior brought about through visual simulation either from the environment or through self-imposed imagery, often on a one-trial or single exposure nature (Imeokratia, 1995 p.45). Using pictorial information in learning and instruction has a long tradition. According to Schnotz (2002) in the seventeenth century when Comenius published his “Didacta Magna,” he “emphasized that envisioning
information is extremely important for effective learning” (p. 101). Learning from verbal and pictorial information has generally been considered as (potentially) beneficial to learning. The acquisition and application of image categories are basic operations underlying the organization of human knowledge.
Spatial Visualization
The term “visualization” is used often in many different ways, so it is often difficult to understand or interpret the true intent of its use (Koch, 2006). From the late 1800’s to the 1970’s, two major factors were identified: spatial visualization and spatial orientation (McGee, 1979; Smith & Strong, 2001). McGee (1979) defined spatial visualization as “an ability to mentally manipulate, rotate, twist, or invert pictorially presented visual stimuli” (p. 3) and that spatial visualization involves recognition, retention, and recall.
On the other side, spatial orientation “involves the comprehension of the arrangement of elements within a visual stimulus pattern, the aptitude for remaining unconfused by the changing orientations in which a configuration may be presented…” (McGee, 1979, p. 4).
Even though, today, visualization is considered to be an essential element of
intelligence measurement, that did not always exist, and until recently it had not received the same emphasis as verbal skills. Spatial visualization and spatial orientation are shown to be more highly correlated with technical, vocational, mathematical, and occupational domains than verbal ability (Bertoline & Wiebe, 2003; Elliot & Smith, 1983; Gillespie, 1994).
relationships of spatial abilities with other factors such as age, sex, ability, and previous experience (Gillespie, 1985; Strong & Smith, 2001). There is a possibility also for a fourth phase, one that focuses on computer technology and its relationship to spatial visualization skills (Strong & Smith, 2001).
Koch (2006) states that research supports the idea that visualization can be learned and improved through practice. Gillespie (1995) studied the effects of tutorials in teaching solid modeling on visualization. In his experiment, Gillespie examined students enrolled in an engineering graphics course at the University of Idaho. Sixty-seven participants, 41 of whom completed the study, were divided into three groups. Each group was pre-tested using three tests: a mental rotations test; a paper folding test; and a rotated block test. Gillespie developed the rotated block instrument similar to the “Purdue Spatial Visualization Test/Test of Rotations” (PSVT/TR). One group was treated with 10 weeks of 17 modules on solid modeling. The two control groups received traditional 2D graphics instruction. All groups improved their scores from pre-test to post-test, and the treatment group improved
significantly over the two control groups.
Knowing that visualization can be learned and improved through practice is very important for visual-based learning material development. There is now hope for learners who do not have visual learning as a primary modality, to benefit from visual-based learning material too, since all they have to do is go through a series of instruction and practice to improve their visual skills.
changed a great deal. The software at that time typically involved the use of wireframes, Boolean operations, and oftentimes confusing movement of a user coordinated systems (UCS) icon. Modern solid modeling software is simpler and more efficient to use (Kurland, 1994).
The images were more realistic with rendered representations and more realism in them. According to Devon, Engel, Foster, Sathianathan, and Turner (1994), this makes visualization easier and accelerates or improves the advantages of using solid modeling. However, according to a study conducted by Haynie (1978), it was concluded that realistic and enhanced photographs were relatively equal in their instructional effectiveness and that they should occupy approximately the same position for visual learning. To reach that
conclusion, Haynie used five treatment groups for his study: Group I, control, saw no visuals; Group II saw abstract line drawings; Group III saw detailed, shaded drawings; Group IV saw realistic photographs; and Group V saw enhanced photographs-a photograph that is made by using special lighting techniques and other special techniques to ensure adequate visibility (Haynie, 1978, p. iii). The results of this study have great benefits for visual-based learning material development since they set the foundations of the kind of visuals that need to be present in such material to promote more efficient student learning and understanding.
in scores on the Minnesota Paper Forms Board Test (MPFBT) were related to increased drafting experience. In the study, students were divided into four groups based on levels of experience or exposure to drafting and CAD: 1) no drafting experience; 2) some drafting experience; 3) CAD experience; and 4) rapid prototyping experience. Of the 68 students studied, those with no drafting experience scored the lowest on the visualization test. Those with manual drafting experience scored slightly higher, and students with CAD and solid modeling scored the highest. Again the results of this study indicate the type of material that needs to be imbedded when developing visual-based learning material. However, this study only cover a small percentage of different types of visual aids, therefore more studies are necessary.
visualizations promote better understanding and improvement of visual skills. Therefore, according to the study more 3-D visualizations than 2-D should be used in the development of visual-based learning material.
Godfrey (1999) has also conducted a study related to 3-D visualization skills using solid modeling among 76 engineering and technology students. The control group received 2D CAD instruction and the treatment group received solid modeling instruction. The PSVT/VR was used at weeks 9 and 16 of the treatments. No significant differences were reported between the groups, but there were differences at the 9-week and 16-week intervals. The solid modeling group showed gains in the first 9 weeks and the 2-D group showed gains in the period from week 9 to 16. According to Godfrey this suggests a logical teaching progression going from solid or 3-D modeling to the more abstract 2-D CAD. Godfrey’s study is important for visual-based learning material development since it supports a sequence of presentation of visualizations according to their level of complexity. Knowing the correct sequence of visual material presentations can increase the performance and validity of the visual-based instructional material.
Importance of Visualization
early studies of the type criticized by Lumsdaine and May (1965) include Brown (1928) which compared motion pictures to film slides; McCowen (1940), Murray (1960), and Vernon (1946), which compared the use of visuals to conventional methods of instruction (p. 10).
Visualization has been identified as one of the most important skills related to engineering and technical graphics (Gillespie, 1995). “Spatial visualization skills are an important component of engineering because of their direct relationship to the graphical communication associated with design” (Devon et al., 1994, p. 4). Strong spatial
visualization skills have been shown to correlate to success, achievement, and retention in engineering programs and success in mathematics (McGee, 1979).
Vocational students have had difficulty translating 2-D schematics and blueprints into 3-D objects and converting 3-D objects into 2-D representations. This may be due to the lack of development of visualization skills (Rosenfeld, 1985). Visualization is particularly important to engineers because they must be able to solve problems involving abstract
objects. They need to be able to communicate those solutions and understand the drawings or solutions of others (Mack, 1992).
visualization differences between males and females prior to puberty. After puberty significantly different levels were evident, with males having a higher ability. In studies where differences were evident, males typically had stronger visualization skills (McGee, 1979). Devon et al. (1994) reported no significant gender differences when they examined the fall and spring semesters separately. The classes that received extensive solid modeling showed clear gender differences. However, other reasons, besides the effects of solid modeling, may be responsible for the noticeable differences. Reasons such as the larger number of females in the group and the fact that the lower pre-test scores of the females made for larger gains than many of the males may be responsible.
In Gillespie’s study (1994), gender differences were found to be significant at the .10 level, but this finding was not consistent with many previous studies. He found that the females had higher spatial visualization scores. Possible reasons for this were that the small number of females (5) might not have been a representative sample and one female had exceptional gains which skewed the results.
More differences between males and females such as the visual cues regarding the rotation of an object have been seen. Branoff (1998) examined the addition of coordinate axes on mental rotation tasks and found that males scored higher on the preliminary test that did not have coordinates. The three-dimensional coordinates system provides an extra dimension in space: depth perception. Depth perception is the result of identifying visual cues within the image which allow the observer to interpret the retinal image as
more holistic approach to visualization and females more of an analytical approach. By adding a reference, the coordinated axes on the drawings, biases were eliminated (Branoff, 1998).
Unsolved Visualization Problems
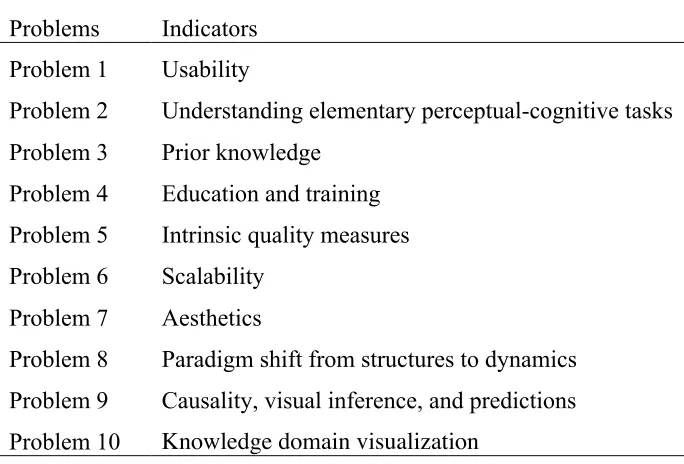
Chaomei (2005), lists ten high-priority unsolved information visualization problems compiled by a panel of experts at the Institute of Electrical and Electronics Engineers, (IEEE) Visualization Conference in 2004. Chaomei‘s 10 top unsolved problems of visualization are displayed in Table 3.
Table 3
Chaomei’s 10 unsolved visualization problems (Chaomei, 2005)
Problems Indicators Problem 1 Usability
Problem 2 Understanding elementary perceptual-cognitive tasks Problem 3 Prior knowledge
Problem 4 Education and training Problem 5 Intrinsic quality measures Problem 6 Scalability
Problem 7 Aesthetics
Problem 8 Paradigm shift from structures to dynamics Problem 9 Causality, visual inference, and predictions Problem 10 Knowledge domain visualization
Chaomei’s study is of great importance for this dissertation since it is a miniature of it. With the only differences being the number of participants and slightly different research
Presented as unsolved visualization problems, those indicators form a category of quality indicators that every visualization must have in order to be more effective. Therefore, knowing these indicators and being familiar with Chaomei’s study is a necessity.
The complexity of the underlying analytic process involved in most information visualization systems is a major obstacle; end-users cannot see how their raw data is
magically turned into colorful images (Chaomei, 2005, p. 12). In other words, designers and users need to find empirical evidence that is both generic and specific enough to inform their decision-making process. Chaomei also mentions that we need new evaluative
methodologies and that the majority of existing usability studies heavily relied on methodologies that predated information visualization (Chaomei, 2005, p.12).
Understanding elementary and secondary perceptual–cognitive tasks is a fundamental step toward engineering information visualization systems. Tasks such as browsing and searching, and even judging the relevance of information, require a level of cognitive activities higher than that of identifying and decoding visual objects (Chaomei, 2005, p.13).
Prior knowledge can serve as a vehicle for communicating abstract information. The intended extraterrestrial audience is assumed to know modern physics and our solar system. The alien is also expected to figure out from the line drawings of a man and woman that the pioneer is coming in peace from a small planet. Information visualization and its users must have a common ground (Chaomei, 2005, p. 13). In conjunction with prior knowledge is the fourth problem that relates to education and training.
field of information visualization to learn and share various principles and skills of visual communication and semiotics (Chaomei, 2005, p. 13). Workshops and publications are necessary to spread the new knowledge and educate other researchers so they don’t have to reinvent the wheel of already-known information.
Intrinsic quality measures appear as the fifth problem on the list. It is vital for the information visualization field to establish intrinsic quality measures (Chaomei, 2005, p. 14). Chaomei explains that the lack of quantifiable measures of quality and benchmarks will undermine information visualization advances, especially their evaluation and selection. The sixth problem on the list is scalability.
Parallel computing and other high-performance computing techniques have not been used in the field of information visualization as much as in the scientific visualization and a few other fields (Chaomei, 2005, p. 14). The reason that state-of-the-art technology is not being used for all different fields of information visualization is because there is not enough funding to allow it. More research and funded grants are needed to explore technology in more fields.
The purpose of information visualization is the insights into data that it provides, not just pretty pictures. What can we learn from making a pretty picture and enhancing the representation of insights? Aesthetics appears as the seventh problem into Chaomei’s list. It is important to understand how insights and aesthetics interact, and how these two goals could sustain insightful and visually appealing information visualization (Chaomei, 2005, p. 15).
emerging trend is to shift the structure – centric paradigm to the visualization of dynamic properties of underlying phenomena (Chaomei, 2005, p. 15). There are more profound challenges that visualizing changes over time. Even if a trend or a sharp change is recorded in a data set it might be impossible for the user to identify the change unless a second representation emphasizes the change. Therefore a collaboration of a visual that presents the change and one with a change detection mechanism are necessary for users to receive the correct results.
According to Chaomei (2005), because of the exploratory and decision-making nature of such tasks, users need to interact freely with raw data as well as its visualization to find causality. Techniques such as multiple coordinated views will enhance the discovery process. Having interactive visual representations that allow the users impact can be extremely valuable for the learning process as well a promoter of realistic results. It also serve as an error prevention mechanism.
According to Chaomei (2005), the greatest advantage of information visualization is its ability to show the amounts of information that are beyond the capacity of textual display. Therefore, we need more visual representations that are rich in detail, large in scale,
extensive in duration, and widespread in scope. As Chaomei (2005), states in the conclusion of his article, the purpose of this study is to provoke some thinking, stimulate some debates, but most importantly, to inspire a constantly revised and updated list of top unsolved
However, to better understand the unsolved problems of visualization it is essential that we study visualization and representations with in a greater detail. The next topic of this study will try to achieve this task by defining the different categories of visual representations.
Descriptive and Depictive Representations
Representations are objects or events that stand for something else (Peterson, 1996). Representations can differ from one another with respect to their informational content and their usability. The informational content of a representation refers to the set of information that one can extract from the representation with the help of available procedures (Schnotz, 2002, p. 103). Texts and visual displays belong to different classes of representations: descriptive and depictive representations.
Descriptive representations consist of symbols describing an object that have an arbitrary structure. Symbols are related to the content they represent by means of a convention (ibid.). Descriptive representations contain signs for relations. A depictive representation consists of iconic signs, such as pictures, sculptures, or physical models.
Instructional Materials
According to Reed (2000) despite the fact that many learning style researchers often promote the need for teacher flexibility (Ellis, 1979; Guild and Garger, 1985; Marshall, 1991; and Reiff, 1992), there are only a few researchers who have developed instructional models based on their learning style theories. Since the visual-based learning materials for
technology education assessed in this study,were developed based on visual learning theories it is of great importance to familiarize our selves with the 4MAT system. With the 4MAT system, one should be able to see the connection of visual-based learning with the rest of the learning styles. Understanding the connection between different learning styles is beneficial when trying to assess instructional material since it gives the individual a holistic view of the knowledge to be transmitted and all available tactics to do so.
Bernice McCarthy’s (1980) 4MAT System is a very well known and widely used instructional model. McCarthy developed the 4MAT System in 1980 as a result of her classroom teaching experience, her dissertation (McCarthy, 1979) and a conference she held in Chicago in 1979 (McCarthy, 1987). According to McCarthy, a similarity exists in the learning style theories she researched. Two ways of perceiving information and two ways of processing information were defined; thereby, she was able to develop composites of four different types of learners (McCarthy, 1987).
Imaginative learners. These learners perceive information concretely and process it reflectively. They need to be involved personally and their favorite question is why? (McCarthy, 1987).
(McCarthy, 1987). McCarthy recommends that teachers give them facts that will deepen their understanding (McCarthy, 1985).
Common sense learners. These learners perceive information abstractly and process it actively. Dynamic learners are problem solvers that commonly ask how? (McCarthy, 1987). Teachers should let this type of learners see how things works by letting them try things (McCarthy, 1985).
Dynamic learners: These learners are primarily interested in self-discovery and often ask the question if? (McCarthy, 1987). Teachers should let these learners teach themselves and others (McCarthy, 1985). Figure 4 shows the complete 4MAT system model.
_______________________________________________________________________
________________________________________________________________________ Figure 4. The complete 4MAT System Model (McCarthy, 1980, p. 122
implementation of a tech prep program; Kelley (1990) developed a model for implementing 4MAT lessons in law school and Kearney and Thacker (1994) use 4MAT lessons to teach photography in a youth correctional facility.
Scientific and Technical Visualization Curriculum
Based on visual learning, the Scientific and Technical Visualization Curriculum was designed to increase interest and understanding of geometry and science concepts; enhanced capabilities to visualize in both two (2-D) and three (3-D) dimensions; improved presentation skills as applied to mathematical and scientific concepts; higher competency in using the internet for accessing, processing, and sharing information (Clark and Mathews, 2000). According to Clark and Wiebe (2000) state that the scientific visualization courses, with which the scientific and visualization curriculum is created, expose students to all of the major and conceptual areas associated with visualization and give them experience in a broad range of graphic techniques. Also through this curriculum, students use analytical and
communication tools to gain better understanding and appreciation and the advantage of being able to apply the new acquired skill – visualization — to further study the sciences enter the workforce or continue their study in multiple professions (Clark and Mathews, 2000).
The primary areas covered in the scientific and visualization curriculum courses include: basic design process, graphing, image processing, animation, simulation,
presentation, and publication (Clark and Mathews, 2000). Althoug the Scientific and
can be integrated easily into mathematics, science, and technology education classes (Clark & Wiebe, 2000).
Technology Education
Kaspryzk (1980) wrote that the word “technology” was originally derived from the ancient Greek words té chne (or techné) and logos and it has been synonymous with manual and oratory skill, rhetorical, “art ”productive science, wisdom and disciplined faculty (Kaspryzk, 1980, p.21). In 330 B.C. Aristotle combined techné and logos in order to derive the word “technologia.” This was eventually changed to “technology” by Johan Beckmann of Gottigen University in his book Introduction to Technology (Engstrom, 2000).
In 1981, Snyder and Hales defined technology in their monograph entitled Jackson’s Mills Curriculum For Industrial Arts. For definition see Table 4. Also many educators have viewed the term “technology education” differently (see Table 4). Table 4
Technology Education definitions
Mills Curriculum, 1981 Savage and Sterry, 1990 The knowledge and study of
human endeavors in creating and using tools, techniques and recourses, and systems to manage the man-made and natural
environment for the purpose of extending human potential and the relationship of these to individuals, society and the civilization process (Snyder and Hales, 1981, p.2).
Valesey (2003) states that one of the philosophical foundations for technology education was pragmatism. She describes John Dewey (1859-1952) as the best-known pragmatist who suggested that the “purpose of reflective thought is to turn obscurity into clarity, and that this is knowledge” (p.32). Dewey’s (1940) belief in practical hands-on education is reflected with this passage from The Child and the Curriculum:
We cannot overlook the importance for educational purposes of the close and intimate acquaintance got with nature at first hand, with real things and materials, with the actual process of manipulation, and the knowledge of their social necessities and uses. The educative forces of the domestic spinning and weaving, of the sawmill, the gristmill, the cooper shop, and the blacksmith forge, were continuously operative (p.11).
In writing specifically about vocational education, Dewey (1944) remarked:
Nothing is more tragic than failure to discover one’s true business in life, or to find that one has drifted or been forced by circumstances into an uncongenial calling. The right occupation means simply that the aptitudes of a person are in adequate play, working with a minimum of friction and a maximum of satisfaction (p.308). Reed (2003) states the connection between earlier curricula and the ones used today:
One of the earlier curriculums, The Maryland Plan was developed by Donald Maley of the University of Maryland and focused on reviewing technological approaches involving tools and machines, power and energy, and transportation and communication (Stotter, 2004). The Maryland Plan supported the notion that technological problems could be incorporated in an anthropological study of modern industry, and Maley introduced the technological systems approach in the design of technology education programs. Maley’s design included communications, production, transportation, and their subsystems (Maley, 1969).
In A Curriculum to Reflect Technology (Warner, 1947), the major subject classifications were based upon six areas of industry; power, transportation, manufacture, construction, communication, and personnel management (Warner, 1947). A subsequent book by Delmar W. Olson (1963), Industrial Arts and Technology, proposed a design approach that put emphasis on the individual student searching for a unique solution instead of building teacher designed projects.
In 1966, Paul W. DeVore of the State University of New York-Oswego proposed that industrial arts should emphasize the study of man and technology as demonstrated in the areas of products, transportation and communication as well as the utilization of the
properties of matter and energy. According to DeVore the rejection of the occupational and pre-vocational curriculum for the development of industrial arts favored long-term goals rather than short-term goals and it was necessary (1988).
praxiological.” This last term, praxiological knowledge, was described as the knowledge of practice and was roughly equivalent to the description of technology proposed by Warner (1947, p.255).
During the same period that the IACP project was being formulated at OSU, the American Industry Project (AIP) was developing curriculum at the University of Wisconsin-Stout (Stotter, 2004). The AIP endeavor suggested that the central focus of industrial arts should be the 13 basic concepts of industry: “communication, transportation, finance, property, research, procurement, relationships, marketing, management, production, materials, processes, and energy” (1947, p.255).
According to Stotter (2004), in 1981 the curriculum committee of the American Industrial Arts Association gathered 21 leaders representing all geographical areas of the nation. The purpose of this project, known as the Jackson’s Mill Industrial Arts Curriculum Symposium, was an effort to chart a unified direction for industrial arts. The project report was the culmination of three meetings over a two-year period. The Jackson’s Mill Industrial Arts Curriculum Theory (Snyder, 1981) was based on human productive activities.
The model determined that the focus of industrial arts should be on the study of industry and technology and their impact on society and culture. The model proposed that industrial arts should include the human productive activities of communication, construction,
manufacturing, and transportation.
Technology Education and Visualization
By using simple and complex visualization tools, students can conduct research, analyze phenomena, solve problems and communicate major topics identified in the
Standards for Technology Literacy (STL) as well as topics aligned with national science and mathematics standards (Wiebe, Clark, Petlick & Ferzli, 2004).
Ernst and Clark (2006), state that a technologically literate person understands and effectively communicates basic technological concepts, processes, and interrelationships with engineering, mathematics, science, and society. Communication technology is an integral component of technological literacy; therefore, modeling, visualizations, and presentations enforce communication technology concepts (Ernst & Clark, 2006). Having strong
communication concepts strengthens individual’s technological and scientific knowledge and abilities while providing students with an opportunity to gain a firm grasp of engineering principles behind the technologies (Newhagen, 1996).
Visual-based Material Grants VisTE
According to Ernst and Clark (2006) in May 2002, the Department of Mathematics, Science and Technology Education in North Carolina State University’s College of Education received a three-year grant from the National Science Foundation to develop instructional units that utilize scientific and technical visualization. VisTE (Visualization in Technology Education) promotes technological literacy by attempting to link engineering, mathematics, science and technology concepts (Ernst & Clark, 2006).
Figure 5. Conceptual Framework of the VisTE Instructional Materials (Wiebe, Clark, Ferzli & McBroom, 2003).
Three years after the starting date, the VisTE project has developed 12 units for technology education for grades 6 to 12. The VisTE units are based on benchmarks