CopyrightÓ2011 by the Genetics Society of America DOI: 10.1534/genetics.110.124776
Comparison of Constitutional and Replication Stress-Induced Genome
Structural Variation by SNP Array and Mate-Pair Sequencing
Martin F. Arlt,* Alev Cagla Ozdemir,* Shanda R. Birkeland,
†Robert H. Lyons, Jr.,
‡Thomas W. Glover* and Thomas E. Wilson*
,†,1*Department of Human Genetics,†Department of Pathology,‡Department of Biological Chemistry and University of Michigan DNA Sequencing Core, University of Michigan Medical School, Ann Arbor, Michigan 48109
Manuscript received October 29, 2010 Accepted for publication December 23, 2010
ABSTRACT
Copy-number variants (CNVs) are a major source of genetic variation in human health and disease. Previous studies have implicated replication stress as a causative factor in CNV formation. However, existing data are technically limited in the quality of comparisons that can be made between human CNVs and experimentally induced variants. Here, we used two high-resolution strategies—single nucleotide polymorphism (SNP) arrays and mate-pair sequencing—to compare CNVs that occur constitutionally to those that arise following aphidicolin-induced DNA replication stress in the same human cells. Although the optimized methods provided complementary information, sequencing was more sensitive to small variants and provided superior structural descriptions. The majority of constitutional and all aphidicolin-induced CNVs appear to be formed via homology-independent mechanisms, while aphidicolin-aphidicolin-induced CNVs were of a larger median size than constitutional events even when mate-pair data were considered. Aphidicolin thus appears to stimulate formation of CNVs that closely resemble human pathogenic CNVs and the subset of larger nonhomologous constitutional CNVs.
I
N recent years, submicroscopic structural variants (SVs) have been found to be widely distributed throughout the human genome where they represent an important component of genetic variation and phenotypic diversity (Iafrate et al. 2004; Sebat et al. 2004; Sharp et al.2005; Conrad et al. 2010b). These include deletions, duplications, insertions, and inver-sions, with the majority being copy-number variations (CNVs) discovered in systematic studies using micro-arrays (Conrad et al. 2010b; Park et al. 2010). More than 10,000 CNVs have now been described in healthy individuals that represent gains or losses of1 kb to.1 Mb. CNVs can alter gene expression in affected regions, confer redundancy, and provide substrates for evolu-tion. Spontaneous CNVs are also known to be a major cause of genetic and developmental disorders, in-cluding mental retardation, autism, schizophrenia, epi-lepsy, skeletal defects, and many others (Stankiewicz and Beaudet 2007; Cook and Scherer 2008; Kirov et al.2009; Tamet al.2009; Zhanget al.2009; Milleret al. 2010). Systematic studies of human population CNVs have provided further correlation to human conditions including Crohn’s disease, rheumatoid arthritis, and diabetes (Craddocket al.2010). Related systematic efforts have finally also revealed a high degree of submicroscopic chromosomal structural alterations in cancer (Stratton et al. 2009; Bignell et al.2010).
Despite their importance, there is limited under-standing of how SVs arise (Hastings et al. 2009b; Stankiewicz and Lupski 2010). The exceptions are local genome rearrangements that occur by unequal recombination between neighboring low-copy repeated sequences or segmental duplications, a process known as non-allelic homologous recombination (NAHR) (Sasaki et al. 2010). Such events are well described and underlie the specific recurrent alterations respon-sible for a variety of human microdeletion syndromes (Sasaki et al. 2010; Stankiewicz and Lupski 2010). However, the majority of both nonrecurrent pathogenic CNVs and those observed in the normal population do not appear to proceed by NAHR but instead show, at most, limited microhomology at the breakpoint junc-tions (Visserset al.2009; Conradet al.2010a). Multiple pathways might catalyze the formation of such junc-tions, including the best-described nonhomologous end-joining (NHEJ) pathway of DNA double-strand break repair (Lieber2010; Lieberand Wilson2010), alternative end-joining pathways recently implicated in Supporting information is available online athttp://www.genetics.org/
cgi/content/full/genetics.110.124776/DC1.
Array data have been deposited in the NCBI Gene Expression Omnibus under accession no. GSE26121. Mate-pair sequence data have been deposited in the NCBI Sequence Read Archive under study no. SRP003289. Called SVs have been deposited in NCBI dbVar.
1Corresponding author:Department of Pathology, University of Michigan Medical School, 2065 BSRB, 109 Zina Pitcher Place, Ann Arbor, MI 48109-2200. E-mail: [email protected]
chromosomal translocations (McVey and Lee 2008; Boboila et al. 2010; Simsek and Jasin 2010), and entirely distinct pathways in which stalled replication structures are processed by mechanisms variably known as template switching or microhomology-mediated break-induced replication (MMBIR) (Leeet al.2007; Hastings et al.2009a).
To date, these mechanisms have largely been inferred by examination of human CNV breakpoint sequences (Korbelet al.2007; Visserset al.2009; Conradet al. 2010a). To begin to explore CNV mechanisms experi-mentally, we recently reported a system in which normal human fibroblasts were treated with the replication inhibitor aphidicolin (Arltet al.2009). Treatment was associated with a substantially increased frequency of new CNVs in subclones, as detected by array compara-tive genome hybridization (aCGH). The observed CNVs were generally consistent with many normal and path-ogenic human CNVs and suggested either template switching or nonhomologous repair formation mecha-nisms (Lee et al. 2007; Hastings et al.2009a; Lieber 2010; Lieberand Wilson2010). However, the resolu-tion of the aCGH method used left uncertainty as to the full spectrum of CNVs that are induced by aphidicolin as compared to those observed in the human germline.
To address these issues, we have explored and opti-mized various methods for detecting CNVs and other SVs with a focus on those with sufficient power and low-enough cost for routine experimentation. We report an in-depth analysis of two complementary technologies—-high-density SNP arrays and whole-genome mate-pair sequencing—and use them to compare aphidicolin-induced CNVs to the baseline constitutional CNVs in the same experimental samples. Our software platform, VAMP (Birkelandet al.2010), was expanded to support the many bioinformatics aspects of the study. We found a surprisingly low correspondence between array and sequencing methods in the detection of constitutional SVs and accordingly identified.600 SVs by mate-pair analysis that were not previously known from systematic array-based studies (Conrad et al. 2010b; Park et al. 2010). A much higher method correspondence was observed for aphidicolin-induced CNVs mainly because these events were consistently larger than most constitu-tional CNVs even when the higher resolution of mate-pair sequencing was brought to bear in the analysis.
MATERIALS AND METHODS
Human cell lines: All experiments were performed with normal human fibroblast cell line HGMDFN090 (090), which was obtained from the Progeria Research Foundation Cell and Tissue Bank (Peabody, MA). The source individual is a female of European descent with a normal 46,XX karyotype who does not carry the mutation for Hutchinson-Gilford progeria. Two aphidicoltreated subclones of 090 that contain novel in-duced CNVs, called A3A2 and A1A1, which were obtained prior to immortalization of 090, have also been described
(Arltet al. 2009). More recently, 090 was immortalized by stable transfection with vector pBABE-Hygro-hTERT (Counter et al. 1998). A hygromycin-resistant clone was isolated, ex-panded, and called 090D2. Parental (i.e., not aphidicolin-treated) SNP array and mate-pair analyses were performed with 090D2 when specified. Genomic DNA was prepared from cell lines using the Blood and Cell Culture DNA Mini Kit (Qiagen). SNP microarrays: Microarrays were the Illumina Human-Omni1-Quad BeadChip, which has both SNP and non-SNP probes selected by the vendor to optimize the detection of human CNVs. One microgram of genomic DNA was submitted to the University of Michigan DNA Sequencing Core for labeling, array hybridization, and scanning according to the manufacturer’s instructions. X, Y, log-R ratio and B allele-frequency values were obtained using Illumina BeadStudio.
Mate-pair sequencing:Genomic DNA (20–40mg) was used to construct mate-pair libraries using the Illumina Mate Pair Library Prep Kit followed by paired end sequencing by the University of Michigan DNA Sequencing Core according to the manufacturer’s instructions. Image analysis and base-calling were performed using the Illumina programs Firecrest and Bustard, respectively.
Data analysis:All further data analysis was performed using an expanded version of our VAMP software platform (Birkeland et al. 2010), which is available for download at http://tewlab. path.med.umich.edu/vamp.html. Seesupporting information, File S1,Figure S1, Figure S2,Figure S3,Figure S4,Figure S5, Figure S6, Figure S7, andFigure S8 for a description of the platform, logic, and parameters. Human genome Build 36 (hg18) served as the reference genome.
SNP microarray analysis was performed using moving average windows of 5, 10, 20, and 50 probes and a threshold of 5 standard deviations (SD) from the array mean. Candidate genome regions identified with these parameters were sub-jected to further filtering during visualization that required the best segment call within a region to have either (i) a change in the log 2 of the intensity ratio (log2R) of at least 0.15 or (ii) a change in the B allele frequency of informative probes of at least 0.083, as well as (iii) aZ-statistic of at least 7. The Z-statistic is the deviation of the average value of a contiguous segment of probes relative to the average value over all probes in the array, expressed as the number of standard errors of the array mean. Thus,Zis influenced by the absolute deviation of a segment, the number of probes within it, and the noise level of the array. All passing genome regions were individually examined and CNVs were manually adjusted and committed. Constitutional CNV analysis was performed on 090D2 array data alone. A3A2 was analyzed using 090D2 as the normaliza-tion reference.
For mate-pair sequencing, mapping filters allowed up to five mismatches relative to hg18, including indels, and up to 10 initial genome map positions per read. The combined 090 data, used to detect constitutional CNVs and as the reference for detecting induced CNVs in A3A2 and A1A1, merged four sequencing lanes—two derived from 090 libraries and two derived from 090D2 libraries. Candidate genome regions were identified by seeking sets of anomalous fragments as described in Birkelandet al. (2010) and inFile S1. Sets were subjected to filtering during visualization that required them to have (i) no more than 40% promiscuously mapped fragments, (ii) a fractional overlap of no more than 90%, (iii) an average fragment size deviation,D, of no more than 3 population SD, (iv) no more than 40% of fragments whereDexceeded 2 SD, and (iv) no more than 10% of fragments in the region contributed by the reference sample (comparative studies only). For insertions, an additional filter required that the set contain at least five fragments. All passing sets were individu-ally examined and manuindividu-ally committed.
CNV segments predicted by SNP arrays and mate-pair sequencing were finally compared to each other, to an analysis of 090 performed using PennCNV (Wanget al.2007), and to CNVs from published compendia (Conradet al.2010b; Park et al. 2010). Two events were declared as matching if the overlap of the two spans was at least 5% of the larger of the two spans. Conclusions were not substantially different when calculated at a match threshold of 33%, given that most events showed either no match or a strong match of.50% (Figure S9;Figure S10).
Breakpoint analysis:For a subset of CNVs detected by mate pairs, a single PCR primer pair that flanked the anomalous junction predicted by the analysis inFigure S3was designed. Occasionally, the first primer pair failed to give a product, but in most such cases products were obtained by moving the primers to different positions that were nonetheless consistent with the same junction. All products were then subjected to standard sequencing.
Data availability: Array data have been deposited in the NCBI Gene Expression Omnibus (http://www.ncbi.nlm.nih. gov/geo/) under accession GSE26121, mate-pair sequence data have been deposited in the NCBI Sequence Read Archive (http://www.ncbi.nlm.nih.gov/Traces/sra) under study no. SRP003289, and called SVs have been deposited in NCBI dbVar (http://www.ncbi.nlm.nih.gov/dbvar).
RESULTS
Detection of aphidicolin-induced CNVs: We first sought to compare the ability of SNP microarrays and mate-pair sequencing (Table 1) to detect induced CNVs in A3A2 and A1A1, two aphidicolin-treated subclones of the normal human fibroblast cell line 090, including CNVs previously identified by aCGH (Arltet al.2009) as well as potentially unknown events. All CNVs shown in Table 2 were detected by at least one of the three methods and subsequently validated—in two cases by confirming loss of heterozygosity of informative SNPs in the deleted region (A3A2, chromosome 7; A1A1, chromosome 13 (Arltet al. 2009) and in all other cases by flanking PCR and se-quencing of the junction (Table S1). Although concor-dance was high, no one technique identified all novel CNVs in the samples. As a trend, microarrays were least robust at detecting the smallest events because discovery algorithms are strongly influenced by the probe count. Not limited by probe density, mate-pair sequencing detected three new events not called by either the SNP array or aCGH (A3A2, chromosome 4; A1A1, chromosome 1; and A1A1, chromo-some 16; Table 2), even though these could be appreciated in array data once attention was directed to the region. All were copy-number gains, which can be difficult to detect by microarray due to their smaller signal deviation, a limitation not applicable to mate-pair sequencing as it detects novel junctions directly. Mate-pair sequencing in turn failed to detect a pericentromeric deletion on A3A2, chromosome 7, which, because of repeat content, had too many arti-factual mappings for reliable event calling. The A1A1 de-letion on chromosome 13 was also missed, almost certainly as a result of the lower sequencing coverage of this sample (Table 1).
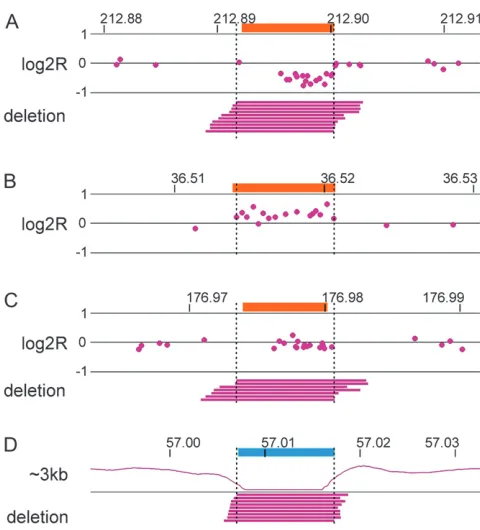
When using optimized filtering parameters (see materials and methods), the list of candidate new CNVs returned from A3A2 SNP array data did not include any false positives. A larger number of false-positive CNVs were returned as candidates from mate-pair data (20 per sample). These false events all failed to show the expected change in coverage of the normal 3-kb fragments within the putative CNV and were not corroborated by array data, in contrast to real events (Figure 1;Figure S11). They also consistently had only two crossing mate pairs and thus likely correspond to stochastic artifactual fragments or mappings. These artifacts were easy to dismiss with experience, but visual inspection of all candidate events was necessary and CNV calling was most reliable when parallel array and mate-pair data could be compared.
Detection of constitutional CNVs:We next sought to explore the content of constitutional CNVs in 090 for comparison to induced CNVs and to better understand the capabilities of the methods. Table 3 shows the number of copy-number gains and losses called from SNP array and mate-pair sequence data, grouped ac-cording to their correspondence to the other detection method (see Table S2for a complete list). Consistent with other human individuals (Korbel et al. 2007; Wheeleret al. 2008; Conradet al. 2010b; Panget al. 2010; Park et al. 2010), .103 CNVs were discovered, with more losses than gains (1513vs.146, respectively). Unlike induced CNVs, a surprisingly large number of constitutional CNVs were called by only one of the two detection methods (1329, or 80% of all CNVs; Table 3, rows A–C; see Figure 2 for examples). A small number of events were judged to be false-negative calls (Table 3, row D). Other failed detections were attributable to technical limitations, in particular to having too few array probes (Table 3, last column) or too small an event size for mate-pair detection. However, even after these factors were considered, many CNVs that might have been detected by both methods were not.
We entertained many explanations for the low con-cordance between SNP arrays and mate pairs. First, VAMP might give poor detection of CNVs from SNP array data. Use of other CNV calling algorithms such as PennCNV (Wang et al. 2007) did not improve the concordance, however (Figure S9). Moreover, the array data in genomic regions called as mate-pair-specific CNVs were not statistically different from the array average (Table 3, rows H and I; Figure 3). This dichotomy could not be attributed to a specific array run (Figure 3). An alternative would be that VAMP substantially overcalled CNVs from mate-pair data. Many observations suggest that this is not the case. The three categories of mate-pair CNVs showed little or no quality difference in the number of associated mate-pair mappings or rate of base mismatches in associated reads (Table 3, row J and K; Figure S12). Also, when mate-pair-specific CNVs had adequate array probe
coverage, the fraction that matched a known human CNV remained very high (Table 3, row E).
Interestingly, the category of mate-pair-specific SVs having too few SNP probes for array detection (Table 3, last column, row G) was notably different in having a low rate of correspondence to human CNVs detected by
ultra-high-density aCGH (Table 3, row E) (Conradet al. 2010b; Park et al. 2010). We looked for systematic factors that might make these events amenable to mate-pair as opposed to array detection. Most CNVs created by underlying inversions were not well sampled by the SNP array (66, or 94% of all inversion CNVs; TABLE 1
Mate-pair sample summary
Aphidicolin treated
Untreated 090 A3A2 A1A1
Lanes 4 3 2
Libraries 4 2 2
Read length 35–39 35–36 35–36
Mean fragment length (kb) 2.9–4.4 2.8–3.4 2.9–3.0
SD fragment length (kb) 0.22–0.42 0.24–0.55 0.29–0.35
Mate pairs 5.93107 2.93107 1.73107
Unique mate pairs 4.43107(74%) 2.13107(74%) 1.23107(73%)
Fraction mapped reads 84% 81% 83%
3-kb fragments 2.43107(56%) 8.33106(39%) 6.03106(48%)
Haploid fragment coverage 24.9 8.7 5.8
Diploid fragment coverage 12.4 4.3 2.9
Haploid read coverage 0.6 0.2 0.1
Diploid read coverage 0.3 0.1 0.1
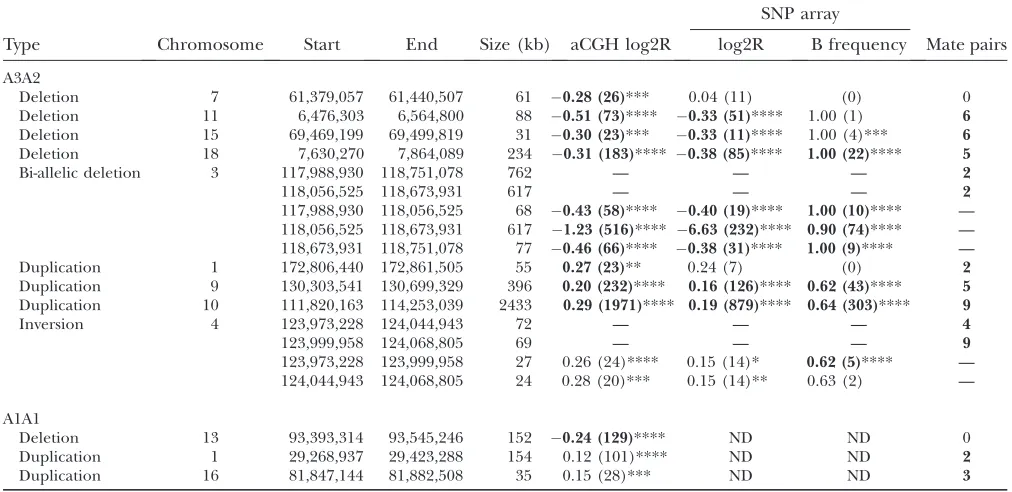
TABLE 2
Aphidicolin-induced CNVs
SNP array
Type Chromosome Start End Size (kb) aCGH log2R log2R B frequency Mate pairs
A3A2
Deletion 7 61,379,057 61,440,507 61 0.28 (26)*** 0.04 (11) (0) 0
Deletion 11 6,476,303 6,564,800 88 0.51 (73)**** 0.33 (51)**** 1.00 (1) 6
Deletion 15 69,469,199 69,499,819 31 0.30 (23)*** 0.33 (11)**** 1.00 (4)*** 6
Deletion 18 7,630,270 7,864,089 234 0.31 (183)**** 0.38 (85)**** 1.00 (22)**** 5
Bi-allelic deletion 3 117,988,930 118,751,078 762 — — — 2
118,056,525 118,673,931 617 — — — 2
117,988,930 118,056,525 68 0.43 (58)**** 0.40 (19)**** 1.00 (10)**** — 118,056,525 118,673,931 617 1.23 (516)**** 6.63 (232)**** 0.90 (74)**** — 118,673,931 118,751,078 77 0.46 (66)**** 0.38 (31)**** 1.00 (9)**** —
Duplication 1 172,806,440 172,861,505 55 0.27 (23)** 0.24 (7) (0) 2
Duplication 9 130,303,541 130,699,329 396 0.20 (232)**** 0.16 (126)**** 0.62 (43)**** 5 Duplication 10 111,820,163 114,253,039 2433 0.29 (1971)**** 0.19 (879)**** 0.64 (303)**** 9
Inversion 4 123,973,228 124,044,943 72 — — — 4
123,999,958 124,068,805 69 — — — 9
123,973,228 123,999,958 27 0.26 (24)**** 0.15 (14)* 0.62 (5)**** — 124,044,943 124,068,805 24 0.28 (20)*** 0.15 (14)** 0.63 (2) — A1A1
Deletion 13 93,393,314 93,545,246 152 0.24 (129)**** ND ND 0
Duplication 1 29,268,937 29,423,288 154 0.12 (101)**** ND ND 2
Duplication 16 81,847,144 81,882,508 35 0.15 (28)*** ND ND 3
Columns ‘‘log2R’’ and ‘‘B frequency’’ show the average log2of the sample to reference ratio or the average B allele frequency, respectively, followed by the number of probes in parentheses, followed by a significance value calculated by using thet-test com-paring all event probes to the mean value for the array: ****P,0.00001; ***P,0.0001; **P,0.001; *P,0.01. Boldface type indicates that the event was called by the detection algorithm. For the complex A3A2 bi-allelic deletion (chromosome 3) and inversion with flanking duplications (chromosome 4), rows show either the anomalous junctions with corresponding mate-pair counts or the CNV spans created by these junctions with corresponding array parameters. ND, not done; —, not applicable.
Table 3, row L), perhaps because they were relatively small (median size: 1.6 kb; range: 0.1–20 kb). A majority (67%) of mate-pair events with insufficient array probe coverage contained short tandem repeat elements (Benson 1999) whose contraction might lead to size loss by a non-CNV mechanism (Table 3, row M). Some mate-pair-specific events also likely represent simple deletions of mobile repetitive elements, such as long interspersed nuclear elements (LINEs) and human en-dogenous retroviruses (HERVs), for which array probes often cannot be meaningfully designed (e.g., Figure 2D). Finally, we examined the smaller number of CNVs identified by SNP arrays but not by mate pairs. The array statistics for these events were consistently robust (Table 3, rows H and I; Figure 3), and they once again showed a high concordance with known human CNVs (Table 3, row E).
In summary, most constitutional event calls could be validated either internally by virtue of detection by both methods or externally by correspondence to known human CNVs, despite the low concordance between
SNP arrays and mate pairs. Mate-pair-specific SVs were the largest unvalidated group, so we randomly selected 35 such events and attempted to amplify the anomalous junctions by PCR (Table S1). These SVs encompassed most observed event types, including CNVs with and without sufficient probes for array detection. Only two SVs had been previously described by systematic array studies (Conradet al.2010b; Parket al.2010). Nearly all showed a PCR product consistent with the predicted SV (31/35, or 89%, Table S1), confirming the high re-liability of mate-pair calls.
Fine structure of aphidicolin-induced CNVs: Mate-pair sequencing was very robust at describing SV structures. With regard to aphidicolin-induced CNVs, this included recognition that one breakpoint of a deletion on chromosome 15 fell 0.4 kb from a known human population CNV, as well as the unambiguous characterization of the two alleles underlying a homo-zygous deletion on chromosome 3 (Figure 1, A and B). Most strikingly, mate pairs described the precise struc-ture of a complex inversion that created two duplication segments on chromosome 4, an event difficult to detect and impossible to describe from array data alone (Figure 1C). Similar observations held true for consti-tutional events, including the identification of CNVs associated with 38 inversions with a median inverted segment size of 2.3 kb (range: 0.1–28 kb,Table S2).
Aphidicolin-induced CNVs are large compared to many constitutional CNVs:Our last and most important goal was to compare constitutional and aphidicolin-induced SVs to explore the hypothesis that replication stress induces events typical of human polymorphic CNVs and whether the detection method had any effect on this conclusion. As expected, the size distribution of constitutional 090 SVs matched the pattern described for other human individuals and the human population (Korbelet al.2007; Wheeleret al.2008; Conradet al. 2010b; Panget al.2010; Parket al.2010), with an inverse correlation between size and frequency down to a lower detection limit of 1 kb (Figure 4). Array CNVs ma-tched many known human CNVs particularly closely, as expected since the SNP array was designed to target these events. Mate-pair events showed a slightly different pattern in being very sensitive for small gains and losses in regions not as easily sampled by arrays, but overall the methods gave a similar result that most constitutional CNVs (94%) were,10 kb.
In marked contrast to the constitutional CNVs, 93% of aphidicolin-induced CNVs were .10 kb (median 148 kb; Figure 4), a data set that includes all aphidicolin-induced CNVs that we have described previously (Arlt et al. 2009), in the current study, and in ongoing unpublished analyses using Illumina 1M SNP arrays. We have noted this different size distribution previously but had not known whether it might simply reflect a bias of arrays against detecting small induced events (Arlt et al.2009). In contrast to the deliberate oversampling of Figure1.—Examples of aphidicolin-induced CNVs.
Inten-sity data (log2R) from SNP arrays are at the top of each panel with mate pairs of the indicated type below. Array data are av-eraged over a five-probe window. Individual mate pairs are drawn as bars connecting the two reads as mapped to the ref-erence genome. Blue denotes the refref-erence 090 sample and magenta the aphidicolin-treated A3A2 sample. Chromosome coordinates are in megabases. (A) An induced deletion on chromosome 15 that overlaps a constitutional CNV. The or-ange box denotes the position of a known human population CNV. (B) A bi-allelic deletion on chromosome 3. (C) A com-plex inversion on chromosome 4 that creates two associated copy-number gains. One potential underlying allele is drawn as an event chain similar toFigure S7.
constitutional CNV regions, most induced CNVs are sampled at the average density of 0.37 probes per kilobase, so that14 kb are required to cross the five probes needed for CNV calling. Mate pairs are not subject to this limit and indeed were readily able to detect constitutional changes as small as 1 kb (Figure 4). Despite this, mate pairs did not reveal a new and more frequent class of small aphidicolin-induced CNVs in two different subclones. Some new aphidicolin-induced CNVs were discovered by mate pairs that were indeed smaller than those previously known from aCGH, but these were nonetheless.10 kb (Table 2).
Aphidicolin-induced and constitutional CNVs show similar nonhomologous junctions:To assess the mech-anisms likely to underlie formation of the observed CNVs, we sequenced a subset of breakpoint junctions (Table S1). Extending previous observations (Arltet al. 2009), all seven aphidicolin-induced events showed microhomologies, blunt joints, and insertions and thus were inconsistent with NAHR. Constitutional CNV junctions revealed a mixture of apparent mechanisms typical of previous reports (Korbelet al.2007; Vissers et al.2009; Conrad et al. 2010a), with 2 of 14 (14%) showing extended homology indicative of NAHR and 12 of 14 (86%) being homology independent. We further observed that only 337 of 1351 090 mate-pair deletions and duplications (25%) had a homology segment (at least 75 bp and 80% identity within 500 bp of the predicted junction) available to support NAHR (24 of 80 (30%) and 313 of 1271 (25%) for events larger than and,10 kb, respectively). Thus, nonhomologous me-chanisms must also account for most observed consti-tutional CNVs regardless of size.
Despite the different size distribution, examining the exact breakpoint structure of all available se-quenced aphidicolin-induced and human constitu-tional homology-independent CNVs did not reveal an
obvious difference when comparing either aphidicolin-induced CNVs to constitutional CNVs or large CNVs to small CNVs (Table S1; data not shown). Thus, aphidi-TABLE 3
Constitutional CNVs
Detection method: SNP array Mate pair
Detected by other method: Yes No Yes No ,5 probes
A Gains 4 98 4 22 22
B Losses 326 120 322 382 685
C Total events 330 218 326 404 707
D False-negative calls — 1 (0.5%) — 27 (7%) —
E Matches known CNV 326 (99%) 202 (93%) 319 (98%) 376 (93%) 92 (13%)
F Median size (kb) 1.8 1.9 3.1 2.6 2.6
G Median fold probe densityvs. array 20.8 18.4 12.2 12.7 0.0
H Median (log2R) 0.48 0.33 0.45 0.13 —
I Median (Z statistic) 13.4 8.9 13.1 3.0 —
J Median mate pairs — — 13 9 8
K Median fraction mismatched bases — — 0.007 0.008 0.008
L Created by inversion 1 (0.3%) ? 1 (0.3%) 3 (0.7%) 66 (9%)
M Tandem repeat (losses only) 112 (34%) 82 (68%) 170 (53%) 291 (76%) 458 (67%)
?, cannot be determined; —, not applicable.
Figure2.—Examples of constitutional CNVs. Major classes of constitutional CNVs observed in 090 are depicted similarly to Figure 1. Orange boxes highlight known human CNVs. (A) An 8.2-kb deletion on chromosome 2 evident in both ar-ray and mate-pair data. (B) A 6.5-kb gain on chromosome 18 evident in array but not mate-pair data. (C) A 6.5-kb deletion on chromosome 2 evident in mate-pair but not array data. (D) A 10.2-kb deletion on chromosome 12 evident in mate-pair data in a region with no array probes. A trace shows the relative density of normal 3-kb mate-pair mappings, and a cyan box highlights a HERVK element in the reference genome.
colin-induced CNVs appear typical of all larger non-homologous CNVs.
DISCUSSION
Much recent work has been devoted to the descrip-tion of CNVs and other SVs in the human genome. We approached this subject from the specific perspective of optimizing an experimental cell system being used to probe the environmental and genetic influences on SV formation (Arltet al.2009). The combined data pro-vide a strong basis for comparing the properties of induced and constitutional CNVs as well as their me-thods of detection.
Constitutional compared to replication stress-induced CNVs: We have described the constitutional SVs in a female of European descent who is not one of the com-monly studied individuals. We nonetheless observed a
very similar overall pattern of genetic changes as previous studies (Korbelet al.2007; Wheeleret al.2008; Conrad et al.2010b; Panget al.2010; Parket al.2010), including the number of SVs observed and the relatively small 2.5-kb median event size (Table 3; Figure 4; Table S2). Similar to human population studies (Conrad et al. 2010a), we infer that the majority (75%) of SV junctions were formed by homology-independent mech-anisms regardless of event size and type, a fact confirmed in the 14 new junction sequences reported (Table S1). The potential impact of these changes on shaping inter-individual variation is evident in the 180 distinct genes having at least one exon affected by a SV (Table S3). Importantly, the event list here contained .600 pre-viously undocumented SVs. Although some of these may have been missed in population studies due to method-ological considerations below, some likely represent low-frequency population polymorphisms or private alleles in our individual.
Relative to the constitutional CNVs, aphidicolin-induced CNVs showed a much larger median size of 148 kb and exclusive utilization of homology-independent mecha-nisms (Figure 4;Table S1). Importantly, although most constitutional CNVs are ,10 kb, larger homology-independent events are still readily observed in most individuals (Korbel et al. 2007; Wheeler et al. 2008; Conradet al.2010a,b; Panget al.2010; Parket al.2010). Thus, aphidicolin-induced CNVs are best described as correlating mainly to the subset of germline SVs that are both larger and homology independent (Figure 4). Several factors might contribute to this pattern. First, we Figure3.—Array run correlation by CNV category. Scatter
plots show the correlation of two different SNP array runs of 090. where the top panel shows all data and the bottom panel is magnified to the region near the origin, corresponding to predicted heterozygous events. Green circles are the array log2R values of CNV regions detected by both array and mate pairs, blue circles are CNVs detected only by array, and red circles are CNVs detected only by mate pairs for which array probes were present.
Figure4.—Size distribution of SVs. Histograms show the fraction of events by event size within each of four groups. ‘‘Const. array’’: constitutional CNVs observed in 090D2 by SNP array (blue circles). ‘‘Const. mate-pair’’: constitutional SVs observed in 090 and/or 090D2 by mate-pair sequencing (red circles). ‘‘APH array’’: new CNVs observed in a series of 23 independent aphidicolin-treated subclones of 090 or 090D2 by SNP array and/or aCGH (open circles). ‘‘APH mate-pair’’: new CNVs observed in aphidicolin-treated sub-clones A3A2 and A1A1 by mate-pair sequencing (black circles). Also shown is a trace of the CNVs detected by micro-array from two published compendia (green circles) (C on-radet al.2010b; Parket al.2010). Numbers in parentheses indicate the total number of events in each group. Array traces combine both gains and losses, while mate-pair traces combine deletion and duplication sets.
have analyzed only two aphidicolin-treated subclones and 11 observed CNVs by the higher-resolution mate-pair method. Nontechnical factors include that consti-tutional events in any human individual have been subjected to a much greater negative selection pressure than what we observe in cell culture. This almost certainly skews population polymorphisms toward sma-ller events inherently less likely to disturb gene function. An interesting corollary observation is that most human pathogenic CNVs are large, including nonhomologus CNVs (Visserset al.2009), but once again these have mostly been discovered using low-resolution arrays (Stankiewiczand Beaudet2007; Cookand Scherer 2008; Kirov et al.2009; Tam et al.2009; Zhanget al. 2009; Milleret al.2010).
A nonexclusive possibility is that the mechanisms contributing to formation of constitutional CNVs are more diverse than those stimulated by aphidicolin. This is certainly true for the subset of small SVs manifest as changes in variable number tandem repeats (VNTRs) or mobile genetic elements. Beyond these special cases, we found no obvious structural signature that could distinguish the nonhomologous junctions that charac-terize most aphidicolin-induced and constitutive CNVs of any size, although sequence information is scant for constitutional CNVs.30 kb. Regardless of size or source, most CNVs are variably characterized by micro-homologies, blunt ends, and/or short inserted sequen-ces, features that might result from many mechanisms including NHEJ, alternative end joining, MMBIR, and template switching (Lee et al. 2007; McVey and Lee 2008; Hastingset al.2009a; Lieber 2010; Lieberand Wilson 2010). It cannot be judged from current data whether aphidicolin induces just a subset of these mechanisms that are more diversely utilized in consti-tutional events or whether some unknown feature causes the same mechanism(s) to be used for joint formation but with a tendency toward larger segment jumps when inhibited replication is the underlying stimulus.
SNP arrays compared to mate-pair sequencing: Overall, mate-pair sequencing had the best power for describing SVs as compared to 1M feature SNP arrays. This was apparent not only in the increased detection of bona fideinduced and constitutional events, but also in the markedly superior descriptions of their underlying structure (Tables 2 and 3; Figures 1 and 2). Array an-alysis nonetheless had its advantages, among them a much greater simplicity and lower cost. Moreover, because arrays use an entirely different basis of de-tection, they often helped to clarify mate-pair data and uniquely detected a number of events. Indeed, the best descriptions of SVs were undoubtedly obtained when array and mate-pair data could be compared.
The failed correlations of arrays and mate-pair se-quencing highlight the limitations of each technique. An overriding issue was the strong dependence on the
genome locations sampled by the array design. Human population CNVs are often small (1 kb) but could be detected by the 1M feature SNP array because these regions were deliberately oversampled. This obviously limits arrays for detection of unknown small events sampled at the average array density, such as might be induced in our cell system or underlie a pathology of interest. Genomic regions that are difficult to sample will be further underrepresented. Indeed, the largest single category of method discrepancies was events detected by mate pairs in regions that had too few probes for array detection (Table 3). A less obvious problem is the potential negative impact of oversam-pling on probe quality, including the use of non-SNP probes and the increased frequency of probes placed in repetitive elements. This is evident in the large number of known human CNVs unambiguously detected by mate pairs in 090 for which the SNP array data were not statistically deviant from the array average (Figure 3).
For mate-pair sequencing, a main limitation was genome coverage, easily appreciated by comparing the A3A2 and A1A1 samples (Tables 1 and 2). However, present technology is substantially advanced over that used to obtain much of our data so that a single Illumina sequencing lane now provides sufficient coverage for three or more crossing fragments per junction. More challenging is mapping mate pairs and making event calls. False-negative calls are the most likely errors as a result of CNVs contained entirely within highly re-petitive genome regions where accurate mapping is all but impossible. A special class of false-negative calls might occur when the reference genome itself carries a duplication common to the studied sample. Here, mate pairs would not detect an anomaly but array methods would still reveal the increased copy number. This phenomenon might help account for the bias of array-specific calls toward copy-number gains (Table 3; Figure 3). False positive mate-pair calls are possible but much less likely when multiple independent fragments pre-dict an event. In this context, many factors likely co-ntribute to the seemingly large number of mate-pair-specific calls. First, all calls were relative to Build 36/ hg18 and need not represent true SVs. Indeed, at least once, a sequenced SV mapped correctly to an alterna-tive genome assembly. Copy-number neutrality might also be consistent with a mate-pair event if there are corresponding gains and losses on different alleles for which one allele escaped mate-pair detection. Most importantly, mate-pair analysis detects all manner of SVs that are invisible to arrays, including tandem repeat expansions and gain or loss of mobile genetic elements. Recent descriptions of data from the 1000 Genomes Project and other high-coverage human genome se-quences highlight final limitations of both SNP arrays and low-depth mate-pair sequencing (Durbin et al. 2010; Panget al.2010; Sudmantet al.2010). First, it is now clear that the frequency of human population
CNVs increases continuously with decreasing event size and does not show the rapid drop-off below1 kb as observed here (Figure 4), which for SNP arrays and mate-pair sequencing reflect the limitations of probe density and fragment size distribution, respectively. Further, the new ability to compare deep sequencing of multiple human individuals has established the high frequency of human CNVs in repetitive genome seg-ments such as segmental duplications (Sudmantet al. 2010), regions inherently difficult to study by either microarray or low-depth mate-pair sequencing. None-theless, results here demonstrate the robust detection of most induced CNVs in an experimental setting by either SNP arrays or low-depth mate-pair sequencing.
We thank Jun Li and Steve Qin for many helpful discussions regarding mate-pair sequencing in the early phases of this project. This work was supported by National Institutes of Health grant RCI-ES018672 to T.E.W. and T.W.G. and by a research grant from the March of Dimes Foundation to T.W.G.
LITERATURE CITED
Arlt, M. F., J. G. Mulle, V. M. Schaibley, R. L. Ragland, S. G. Durkin et al., 2009 Replication stress induces genome-wide copy number changes in human cells that resemble polymorphic and patho-genic variants. Am. J. Hum. Genet.84:339–350.
Benson, G., 1999 Tandem repeats finder: a program to analyze DNA sequences. Nucleic Acids Res.27:573–580.
Bignell, G. R., C. D. Greenman, H. Davies, A. P. Butler, S. Edkins et al., 2010 Signatures of mutation and selection in the cancer genome. Nature463:893–898.
Birkeland, S. R., N. Jin, A. C. Ozdemir, R. H. Lyons, L. S. Weismanet al., 2010 Discovery of mutations inSaccharomyces cerevisiaeby pooled link-age analysis and whole genome sequencing. Genetics186:1127–1137. Boboila, C., M. Jankovic, C. T. Yan, J. H. Wang, D. R. Wesemann et al., 2010 Alternative end-joining catalyzes robust IgH locus deletions and translocations in the combined absence of ligase 4 and Ku70. Proc. Natl. Acad. Sci. USA107:3034–3039. Conrad, D. F., C. Bird, B. Blackburne, S. Lindsay, L. Mamanova
et al., 2010a Mutation spectrum revealed by breakpoint se-quencing of human germline CNVs. Nat. Genet.42:385–391. Conrad, D. F., D. Pinto, R. Redon, L. Feuk, O. Gokcumenet al.,
2010b Origins and functional impact of copy number variation in the human genome. Nature464:704–712.
Cook, E. H., Jr., and S. W. Scherer, 2008 Copy-number variations associated with neuropsychiatric conditions. Nature455:919–923. Counter, C. M., W. C. Hahn, W. Wei, S. D. Caddle, R. L. Beijersbergen et al., 1998 Dissociation among in vitro telomerase activity, telo-mere maintenance, and cellular immortalization. Proc. Natl. Acad. Sci. USA95:14723–14728.
Craddock, N., M. E. Hurles, N. Cardin, R. D. Pearson, V. Plagnol et al., 2010 Genome-wide association study of CNVs in 16,000 cases of eight common diseases and 3,000 shared controls. Na-ture464:713–720.
Durbin, R. M., G. R. Abecasis, D. L. Altshuler, A. Auton, L. D. Brookset al., 2010 A map of human genome variation from population-scale sequencing. Nature467:1061–1073.
Hastings, P. J., G. Iraand J. R. Lupski, 2009a A microhomology-mediated break-induced replication model for the origin of hu-man copy number variation. PLoS Genet.5:e1000327. Hastings, P. J., J. R. Lupski, S. M. Rosenberg and G. Ira,
2009b Mechanisms of change in gene copy number. Nat. Rev. Genet.10:551–564.
Iafrate, A. J., L. Feuk, M. N. Rivera, M. L. Listewnik, P. K. Donahoe et al., 2004 Detection of larscale variation in the human ge-nome. Nat. Genet.36:949–951.
Kirov, G., D. Grozeva, N. Norton, D. Ivanov, K. K. Mantripragada et al., 2009 Support for the involvement of large copy number variants in the pathogenesis of schizophrenia. Hum. Mol. Genet. 18:1497–1503.
Korbel, J. O., A. E. Urban, J. P. Affourtit, B. Godwin, F. Grubert et al., 2007 Paired-end mapping reveals extensive structural var-iation in the human genome. Science318:420–426.
Lee, J. A., C. M. Carvalhoand J. R. Lupski, 2007 A DNA replication mechanism for generating nonrecurrent rearrangements associ-ated with genomic disorders. Cell131:1235–1247.
Lieber, M. R., 2010 The mechanism of double-strand DNA break repair by the nonhomologous DNA end-joining pathway. Annu. Rev. Biochem.79:181–211.
Lieber, M. R., and T. E. Wilson, 2010 SnapShot: nonhomologous DNA end joining (NHEJ). Cell142:496–496.e1
McVey, M., and S. E. Lee, 2008 MMEJ repair of double-strand breaks (director’s cut): deleted sequences and alternative end-ings. Trends Genet.24:529–538.
Miller, D. T., M. P. Adam, S. Aradhya, L. G. Biesecker, A. R. Brothman et al., 2010 Consensus statement: chromosomal microarray is a first-tier clinical diagnostic test for individuals with developmen-tal disabilities or congenidevelopmen-tal anomalies. Am. J. Hum. Genet.86: 749–764.
Pang, A. W., J. R. MacDonald, D. Pinto, J. Wei, M. A. Rafiqet al., 2010 Towards a comprehensive structural variation map of an individual human genome. Genome Biol.11:R52.
Park, H., J. I. Kim, Y. S. Ju, O. Gokcumen, R. E. Mills et al., 2010 Discovery of common Asian copy number variants using integrated high-resolution array CGH and massively parallel DNA sequencing. Nat. Genet.42:400–405.
Sasaki, M., J. Langeand S. Keeney, 2010 Genome destabilization by homologous recombination in the germ line. Nat. Rev. Mol. Cell Biol.11:182–195.
Sebat, J., B. Lakshmi, J. Troge, J. Alexander, J. Young et al., 2004 Larscale copy number polymorphism in the human ge-nome. Science305:525–528.
Sharp, A. J., D. P. Locke, S. D. McGrath, Z. Cheng, J. A. Baileyet al., 2005 Segmental duplications and copy-number variation in the human genome. Am. J. Hum. Genet.77:78–88.
Simsek, D., and M. Jasin, 2010 Alternative end-joining is suppressed by the canonical NHEJ component Xrcc4-ligase IV during chromo-somal translocation formation. Nat. Struct. Mol. Biol.17:410–416. Stankiewicz, P., and A. L. Beaudet, 2007 Use of array CGH in the evaluation of dysmorphology, malformations, developmental de-lay, and idiopathic mental retardation. Curr. Opin. Genet. Dev. 17:182–192.
Stankiewicz, P., and J. R. Lupski, 2010 Structural variation in the hu-man genome and its role in disease. Annu. Rev. Med.61:437–455. Stratton, M. R., P. J. Campbelland P. A. Futreal, 2009 The
can-cer genome. Nature458:719–724.
Sudmant, P. H., J. O. Kitzman, F. Antonacci, C. Alkan, M. Malig et al., 2010 Diversity of human copy number variation and mul-ticopy genes. Science330:641–646.
Tam, G. W., R. Redon, N. P. Carterand S. G. Grant, 2009 The role of DNA copy number variation in schizophrenia. Biol. Psychiatry 66:1005–1012.
Vissers, L. E., S. S. Bhatt, I. M. Janssen, Z. Xia, S. R. Lalaniet al., 2009 Rare pathogenic microdeletions and tandem duplications are microhomology-mediated and stimulated by local genomic architecture. Hum. Mol. Genet.18:3579–3593.
Wang, K., M. Li, D. Hadley, R. Liu, J. Glessneret al., 2007 PennCNV: an integrated hidden Markov model designed for high-resolution copy number variation detection in whole-genome SNP genotyping data. Genome Res.17:1665–1674.
Wheeler, D. A., M. Srinivasan, M. Egholm, Y. Shen, L. Chenet al., 2008 The complete genome of an individual by massively par-allel DNA sequencing. Nature452:872–876.
Zhang, F., W. Gu, M. E. Hurlesand J. R. Lupski, 2009 Copy num-ber variation in human health, disease, and evolution. Annu. Rev. Genomics Hum. Genet.10:451–481.
Communicating editor: J. C. Schimenti
GENETICS
Supporting Information
http://www.genetics.org/cgi/content/full/genetics.110.124776/DC1
Comparison of Constitutional and Replication Stress-Induced Genome
Structural Variation by SNP Array and Mate-Pair Sequencing
Martin F. Arlt, Alev Cagla Ozdemir, Shanda R. Birkeland, Robert H. Lyons, Jr.,
Thomas W. Glover and Thomas E. Wilson
M. F. Arlt et al.
2 SI
FILE S1 Supporting Methods
Mate-pair analysis. For sequence analysis, VAMP software takes as input the called bases of paired short sequence reads. Unique read-pairs are mapped to the reference genome by either the PASS (CAMPAGNA et al. 2009) or Bowtie
(LANGMEAD et al. 2009) algorithms in a previously described iterative fashion designed to yield all possible mappings for each
mapped pair (BIRKELAND et al. 2010). The main library peak is localized and the mean and standard deviation (SD) of DNA
fragment sizes are estimated. From this information, most mate-pairs are assigned to the pool of fragments expected from the
reference genome. Remaining paired mappings are assigned to anomalous pair types according to published logic (DEW et al.
2005; KORBEL et al. 2007), wherein inward facing pairs (after correcting read orientations for the inversion caused by mate-pair
fragment circularization) bigger than the population mean are presumptive deletions, inward facing pairs that are too small are
presumptive insertions, outward facing pairs are presumptive duplications, and co-linear pairs are presumptive inversions. The
final step in the initial analysis phase is to find candidate sets of anomalous paired mappings where each source DNA fragment in
a set is inferred to have crossed the same anomalous SV junction, as previously described (BIRKELAND et al. 2010).
Set quality scores. Once internally consistent sets of anomalous paired mappings are identified, a series of filterable
quality scores are calculated. These quality scores are of particular relevance when the sequenced genome contains a high repeat
content, such as the human genome, and when data are obtained at low genome coverage. The first filter recognizes that
mate-pairs may still give rise to multiple paired mappings that each participate in sets (Figure S1), only one of which can be correct.
Such mate-pairs result from repetitive DNA regions and are termed “promiscuous”. A filter determines the maximum allowed
fraction of promiscuous mappings in a set. Most bona fide anomaly sets were comprised almost entirely of mate-pairs that
contributed to just that one set (Figure S1).
Another common artifact occurs when one or both ends of the paired mappings in a set are closely spaced. The
probability of this happening for the true mappings of randomly placed overlapping fragments is low (Figure S2A). To assess
this probability for a given set, VAMP transforms the positions and orientations of the paired mappings in the set into a
prediction of the physical size of the actual sequenced DNA fragments (Figure S3). In this way, an estimate of the size of the set
overlap region can be made. A filter determines the maximal fractional overlap allowed for a set, which correlates to the
closeness of the read spacing at each end. Called sets had a broad distribution of overlap sizes biased toward small overlaps and
exclusive of a peak of inferred aberrant overlaps of > 90% (Figure S2B).
The data transformation in Figure S3 also reveals the distribution of fragment sizes in a set. Too wide of a size
distribution is inconsistent with a true set (Figure S4A and B). Two filters determine (i) the maximal allowed average size
M. F. Arlt et al. 3 SI
fragments for which exceeds 2 SD (Figure S4C and D). Called sets consistently had fragment size distributions that matched
the source libraries as evidenced by a low mean (Figure S4D).
A final filter requires a specified minimum number of mate-pair mappings within candidate sets so as to ignore random
co-localizations, evident as a large number of candidate sets with just two or three mate-pairs (Figure S5). These low mate-pair
count sets were mostly of the insertion class due to a leading edge often observed in the main peak. True sets showed the
expected broad distribution of mate-pair counts consistent with the diploid genome coverage obtained (Table 1).
Small deletions and insertions. VAMP uses additional approaches for identifying genome regions bearing an insertion
or deletion too small to cause most crossing fragments to deviate from the population mean by more than 3 SD. A Z statistic is
calculated for each genome position using the average map size of all inward-facing mapped pairs crossing the position and the
average and SD of this value across the entire genome. Blocks of genome positions with a Z score in excess of 3 are candidate
events. A graphical density map is also created to help visualize small deletions and insertions (Figure S6). In this way, events
with a size down to ~1 SD of the fragment distribution can often be detected.
Comparing mate-pair samples. When the goal is to find events unique to a test sample relative to a reference sample,
all libraries from the two samples are temporarily merged and the set finding process performed in one pass so that sets can be
made up of mapped pairs from one or both samples. Source samples are tracked, with a uniqueness filter determining the
maximum allowed fraction of reference mappings in a set.
Predicting CNVs from mate-pair data. The processes described above find structural variation junctions in a sample.
Some but not all of these correspond to CNVs. To find CNVs, VAMP transforms the collection of junctions in a cluster of
overlapping sets into possible underlying allele structures by “chaining” as described in (Figure S7).
Microarray analysis. VAMP began as a tool for analyzing mate-pair data but also incorporates algorithms for
analyzing microarray data. These algorithms identify consecutive probe sets that differ (i) from the array at large, with the
attendant need for noise reduction, and (ii) between two array runs, for example an experimental sample and a control.
Normalization, noise reduction, and event calling. When trying to identify regions of difference between two samples,
best results were obtained by normalizing probe values of one array to another prior to event calling (Figure S8). These
normalized data (or the raw data from a single array) are then subjected to averaging within a moving window of variable size
(Figure S8), specified by parameter nProbes as the number of adjacent probes to be averaged. Thus, VAMP averages in probe
space, not genome space. Data are next searched for blocks of consecutive probe positions whose averaged values exceed a
sensitivity threshold (Figure S8), specified by parameter nStdDevs as the number of SD from the mean averaged value of the
array, taking into account the expected copy number of the sex chromosomes. Block ends are refined by examining the raw
values of all probes that gave rise to the block. This process is repeated for intensity (R) and B allele frequency data over all
M. F. Arlt et al.
4 SI
events. This is important because events of different sizes are detected more robustly with different averaging windows. Quality
scores for filtering candidate events include a Z statistic calculated for all event probe values relative to the mean and SD of the
array, after discarding outlier probes using a Grubb's test.
B allele frequency calculation and transformation. Illumina software calculates the B allele frequency of a SNP from a
polar coordinate transformation of X and Y, the corrected signal intensities of the A and B alleles, respectively. VAMP uses this
value when analyzing a single array. However, we found that an alternative calculation of the B allele frequency, Y / (X + Y),
gave a tighter distribution of normalized results when comparing two arrays (not shown). Once the B allele frequency is
calculated, it is transformed to allow meaningful averaging by expressing it as the frequency of the higher abundance allele
(Figure S8). Finally, B allele frequency averaging is only meaningful for informative probes. Thus, when comparing samples
probes are included only if the transformed B allele frequency of the designated reference sample is <0.8. When analyzing single
samples the same criterion is applied with values normalized to an expected value of 0.5.
REFERENCES
BIRKELAND, S. R., N. JIN, A. C. OZDEMIR, R. H. LYONS, L. S. WEISMAN et al., 2010 Discovery of mutations in Saccharomyces
cerevisiae by pooled linkage analysis and whole genome sequencing. Genetics 186: 1127-1137.
CAMPAGNA, D., A. ALBIERO, A. BILARDI, E. CANIATO, C. FORCATO et al., 2009 PASS: a program to align short sequences.
Bioinformatics 25: 967-968.
DEW, I. M., B. WALENZ and G. SUTTON, 2005 A tool for analyzing mate pairs in assemblies (TAMPA). J Comput Biol 12:
497-513.
KORBEL, J. O., A. E. URBAN, J. P. AFFOURTIT, B. GODWIN, F. GRUBERT et al., 2007 Paired-end mapping reveals extensive
structural variation in the human genome. Science 318: 420-426.
LANGMEAD, B., C. TRAPNELL, M. POP and S. L. SALZBERG, 2009 Ultrafast and memory-efficient alignment of short DNA
M. F. Arlt et al. 5 SI
M. F. Arlt et al.
6 SI
FIGURE S2.—Fractional overlap. (A) By definition, a 90% fractional overlap of two equal length DNA fragments reflects a 5% extension at each end. The probability that two overlapping but otherwise random fragments will show an overlap of 90% or more is thus 5/95 or 5.3%. For N fragments the probability is (0.053)N. (B) A histogram shows the fraction of 090 sets
M. F. Arlt et al. 7 SI
M. F. Arlt et al.
8 SI
FIGURE S4.—Fragment size distribution in anomaly sets. (A) and (B) Mock graphs show the observed distribution of mapped
M. F. Arlt et al. 9 SI
M. F. Arlt et al. 10 SI
FIGURE S6.—Identifying small deletions and insertions. Mapped read data surrounding a small deletion in 090 are plotted as a
M. F. Arlt et al. 11 SI
M. F. Arlt et al. 12 SI
A
B
M. F. Arlt et al. 13 SI
M. F. Arlt et al.
14 SI
M. F. Arlt et al. 15 SI
M. F. Arlt et al.
16 SI
M. F. Arlt et al. 17 SI
REFERENCES
CONRAD, D. F., D. PINTO, R. REDON, L. FEUK, O. GOKCUMEN et al., 2010 Origins and functional impact of copy number
variation in the human genome. Nature 464: 704-712.
PARK, H., J. I. KIM, Y. S. JU, O. GOKCUMEN, R. E. MILLS et al., 2010 Discovery of common Asian copy number variants using
integrated high-resolution array CGH and massively parallel DNA sequencing. Nat Genet 42: 400-405.
WANG, K., M. LI, D. HADLEY, R. LIU, J. GLESSNER et al., 2007 PennCNV: an integrated hidden Markov model designed for
M. F. Arlt et al. 18 SI
TABLES S1-S3
Tables S1-S3 are available for download as Excel files at http://www.genetics.org/cgi/content/full/genetics.110.124776/DC1.
TABLE S1: Breakpoint analysis
TABLE S2: Constitutional SVs