HIGHLIGHTED ARTICLE
GENETICS | COMMUNICATIONS
Massively Parallel Functional Analysis of BRCA1
RING Domain Variants
Lea M. Starita,* David L. Young,* Muhtadi Islam,†Jacob O. Kitzman,*,1Justin Gullingsrud,*
Ronald J. Hause,* Douglas M. Fowler,* Jeffrey D. Parvin,†,2Jay Shendure,*,2and Stanley Fields*,‡,§,2 *Department of Genome Sciences,‡Department of Medicine, and§Howard Hughes Medical Institute, University of Washington, Seattle, Washington 98195, and†Department of Biomedical Informatics and The Ohio State University Comprehensive Cancer Center, The Ohio State University, Columbus, Ohio 43210
ABSTRACT Interpreting variants of uncertain significance (VUS) is a central challenge in medical genetics. One approach is to experimentally measure the functional consequences of VUS, but to date this approach has beenpost hocand low throughput. Here we use massively parallel assays to measure the effects of nearly 2000 missense substitutions in the RING domain of BRCA1 on its E3 ubiquitin ligase activity and its binding to the BARD1 RING domain. From the resulting scores, we generate a model to predict the capacities of full-length BRCA1 variants to support homology-directed DNA repair, the essential role of BRCA1 in tumor suppression, and show that it outperforms widely used biological-effect prediction algorithms. We envision that massively parallel functional assays may facilitate the prospective interpretation of variants observed in clinical sequencing.
KEYWORDSdeep mutational scanning; BRCA1; variants of uncertain significance; human genetic variation; protein function
I
N an era of increasingly widespread genetic testing, DNAsequencing identifies many missense substitutions with un-known effects on protein function and disease risk. In the absence of genetic evidence, experimental measurement is the most reliable way to determine the functional impact of a variant of uncertain significance (VUS). However, initiating an experiment for each new variant observed in a gene is often impractical. When experiments are done, they are nearly
always performed in a retrospective manner (Bouwmanet al.
2013), such that the resulting data are not useful for the patient in whom the VUS was observed.
By prospectively measuring, in a high-throughput fashion, the consequences of all possible missense mutations on a gene’s function, we can generate a look-up table for inter-preting newly observed VUS. Although functional analysis at this scale is made possible by deep mutational scanning
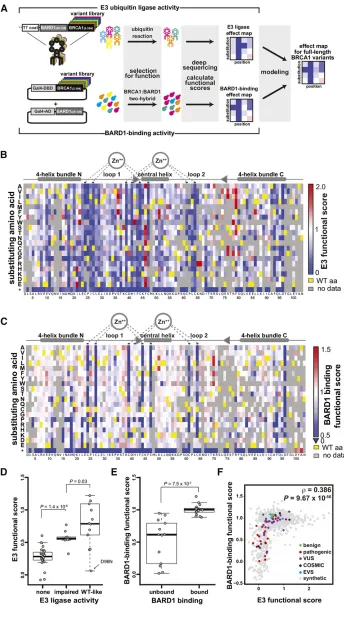
(Fowler and Fields 2014), a central challenge is that any single assay may not recapitulate all the activities of a given protein in human disease. To address this challenge, we hypothesized that integrating the results of assays of multiple biochemical functions would strengthen estimates of the effects of mutations on disease risk (strategy outlined in Figure 1A). As a proof-of-concept, we initiated massively parallel functional analysis of BRCA1, a protein for which there are multiple biochemical functions as well as known pathogenic and benign missense substitutions to benchmark results.
BRCA1 has been subject to intense study since its implica-tion in hereditary, early onset breast and ovarian cancer (Miki
et al. 1994). All missense substitutions in BRCA1 that are known to be pathogenic occur in either the amino-terminal
RING domain or the carboxy-terminal BRCT repeat (http://
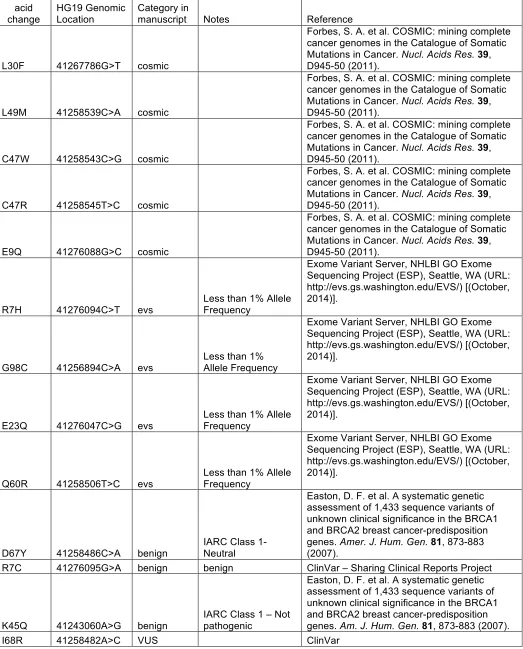
brca.iarc.fr/LOVD/home.php?select_db=BRCA1). Although the RING domain represents only 5% of the BRCA1 protein, 58% of the pathogenic missense substitutions occur within this domain. Sixty-two missense substitutions in the RING domain have been observed in patients, the general population, or tumor samples. Of these, only 22 have been classified—19 as patho-genic and 3 as benign (Supporting Information, Table S1)— by multifactorial models based on information from personal history, family history, and pathological profile and by A-GVGD (Tavtigianet al.2006), a conservation-based, biological-effect prediction algorithm (reviewed in Lindoret al.2012).
Copyright © 2015 by the Genetics Society of America doi: 10.1534/genetics.115.175802
Manuscript received February 23, 2015; accepted for publication March 1, 2015; published Early Online March 30, 2015.
Supporting information is available online athttp://www.genetics.org/lookup/suppl/
doi:10.1534/genetics.115.175802/-/DC1.
1Present address: Department of Human Genetics, University of Michigan, Ann Arbor, MI 48109.
Although BRCA1 has multiple roles in the cell, its activity in homology-directed DNA repair (HDR) is most closely
associated with cancer risk (Moynahanet al.1999; Towler
et al.2013). Cell-based HDR rescue assays on the full-length
BRCA1 protein have been performed for a small number of
variants (Ransburghet al. 2010; Towleret al.2013).
How-ever, those assays are too laborious to be applied to each possible BRCA1 variant. We therefore sought to implement
alternative BRCA1 functional assays that are more amenable to multiplexing.
The BRCA1 RING domain heterodimerizes with the RING domain of BARD1 to comprise an E3 ubiquitin ligase (Hashizumeet al.2001). The structural stability of the hetero-dimer is required for the stability of full-length BRCA1 (Wu
et al. 2010). BRCA1 variants that cannot dimerize result in
defects in HDR and loss-of-tumor suppression (Drost et al.
2011; Ransburghet al.2010). Assays for both BRCA1 E3 ligase activity and interaction with BARD1 are sensitive to amino acid substitutions that destabilize the structure of the heterodimer (Brzovicet al.2003; Morriset al.2006; Ransburghet al.2010). We therefore developed massively parallel assays (Fowleret al.
2010) to measure the impact of thousands of missense substi-tutions on these two functions.
To assay E3 ligase activity, we subjected an allelic series
(Kitzmanet al.2015) (Figure S1) of the BRCA1 N terminus
amino acids (2–304) to a phage display assay (Starita
et al. 2013) that selects for protein variants capable of
autoubiquitination (Christensen et al. 2007). We expressed
BRCA1(2–304) variants on the surface of phage and selected
for BRCA1 ubiquitination activity overfive sequential rounds
of selection in the presence of an E1, an E2, and Flag–
ubiquitin by capturing phage with anti-Flag beads (Figure
S2). Phages that encode active BRCA1 RING variants increase
in abundance and those that encode inactive variants decrease in abundance over the multiple rounds of selection. We used deep sequencing to count each allele in the input phage pop-ulation and after each round. We calculated E3 ligase scores by tracking the changes in the relative abundance of each allele during the selection (Arayaet al.2012). The scores were normalized such that the wild type had a score of one and the mean score for variants with premature termination codons had a score of zero. We obtained scores for 5154 of the 5757 possible single-amino-acid substitutions (Table S2). Using an input frequency threshold (Figure S3A), wefiltered these to
a high-confidence set corresponding to 3170 amino acid
sub-stitutions, with the six replicates having Spearman’s rank cor-relation values between 0.76 and 0.83 (Figure S3B).
E3 ligase activity for variants with missense substitutions ranged from completely nonfunctional (scores of zero) to nearly three times higher than wild type. Scores for residues
in the RING domain (2–103) are shown in Figure 1B and for
residues 104–304 inFigure S4; all scores are reported in
Table S2. As expected, substitutions in the residues that co-ordinate zinc ions and the residues in loop 1 and the central
helix that contact the E2 enzyme (Brzovicet al.2003) were
the most intolerant to mutation (Figure 1B; Wilcoxon rank
sum test (WRST),P= 0.0008), with the exception of Phe46,
where most substitutions were hyperactivating. We com-pared the E3 ligase scores to previous work by splitting the published activities of BRCA1 RING domain variants in
in vitro ubiquitination assays (Brzovic et al. 2003; Morris
et al.2006) into three categories: completely nonfunctional, impaired, or wild-type like. E3 ligase scores corresponding to variants in the nonfunctional category were lower than
those in the impaired category (WRST, P = 1.4 310–5),
which were in turn lower than those in the wild-type-like
category (WRST,P= 0.03, Figure 1D).
In separate experiments, we used a multiplexed yeast two-hybrid assay to select for the ability of BRCA1 RING
domain (2–103) (Brzovic et al. 2001) variants to interact
with the RING domain of BARD1. The DNA-binding domain of the yeast transcription factor Gal4 was fused to the
BRCA1(2–304) allelic series and the Gal4 activation domain
was fused to BARD1(26–126) (Figure S5). Here, BRCA1
binding to BARD1 drives the expression of a selectable re-porter gene such that yeast expressing BRCA1 variants that bind to BARD1 increase in abundance during the selection and those expressing nonfunctional variants decrease. We used deep sequencing to quantify the relative abundance of alleles after transformation into the yeast and at multiple
time points during the selection (Materials and Methodsand
Table S2). We calculated a BARD1-binding score for 1855 of 1938 possible amino acid substitutions, excluding the carboxy-terminal 201 amino acids, which were required only for the autoubiquitination assay but not the BARD1-binding assay (Brzovicet al.2001). Using an input frequency threshold, we
filtered these to a high-confidence subset corresponding
to 1529 substitutions, whose scores were highly reproducible (r= 0.82–0.95,Figure S6andTable S2).
Overall, BARD1-binding scores agreed with what is known
about the RING–RING interaction. The residues that
coordi-nate the zinc ions were the most intolerant to substitution
with the exception of H41 (Brzovic et al.2001) (Figure 1C).
The effect size for most other substitutions was small, which was expected given the large interface between the two RING
domains (Brzovicet al.2001). We compared our results with
those published for co-immunoprecipitation of BRCA1 RING
domain variants with BARD1 (Brzovicet al.2003; Ransburgh
et al. 2010). While the scores from the yeast two-hybrid BARD1-binding assay were lower for BRCA1 variants reported
not to bind to BARD1 (WRST,P= 7.5310–7), these scores
spanned the entire range from zero to one (Figure 1E). In-termediate BARD1-binding scores for BRCA1 variants with weak or no BARD1 binding in co-immunoprecipitation assays may derive from differences in variant thermostability be-tween the yeast assay (carried out at 30°) and the mammalian cell culture assay (carried out at 37°), and the in vivo tran-scriptional readout of the two-hybrid assay being more sensi-tive than co-immunoprecipitation.
We compared the E3 ligase scores to the BARD1-binding scores and observed that neither assay was sufficient alone to accurately discriminate BRCA1 variants with respect to their pathogenicity (Figure 1F, colored points). Because BARD1-binding is required for E3 ligase function, the scores from both assays were modestly correlated (r= 0.386;P= 9.67310–56),
but many more positions were intolerant to substitutions in the E3 ligase assay (Figure 1F). Although the E3 ligase activity of BRCA1 may not be required for HDR and therefore tumor
suppression (Reid et al. 2008; Shakya et al. 2011), the E3
stability of the RING domain. Indeed both assays had some power to discriminate BRCA1 variants with respect to their pathogenicity (Figure 1F, colored points). We hypothesized that these two rich mutational data sets could be combined to accurately identify deleterious substitutions in the BRCA1 RING domain.
A test of whether the results from these high-throughput biochemical assays can be used to discriminate disease risk alleles needs“gold standards”as benchmarks. Since only 22
mutations in the BRCA1 RING domain have been classified
for pathogenicity, we required a larger set of BRCA1 variants with established, disease-relevant functional consequences. Therefore, we tested additional full-length BRCA1 variants in the assay that best correlates with tumor suppression: rescue of HDR at an induced double-strand break by expres-sion of a BRCA1 variant following siRNA knockdown of en-dogenous BRCA1 (Figure 2A). We curated results from this assay (Ransburghet al.2010; Towleret al.2013) for 17 mis-sense substitutions in the BRCA1 RING domain and tested an additional 28 (Figure 2B) for a total of 45. Of the 19 known pathogenic mutants, 8 have now been tested for HDR rescue. As expected, after excluding R71G, a variant that affects
BRCA1 splicing (Vegaet al.2001), these pathogenic mutants
all had low HDR rescue scores (mean = 0.19, max = 0.33) that separate them from the three known benign variants, which have much higher scores (mean = 0.88, min = 0.77;
Figure 2B and Table S2). We defined a BRCA1 HDR rescue
score of 0.53—the value midway between the average HDR
rescue score for known pathogenic BRCA1 variants and the
average score for known benign variants—as the inflection
point for discriminating between functional and nonfunctional
variants, as was done for BRCA2 (Guidugliet al.2014). With
this inflection point, the HDR rescue assay has 100% sensitiv-ity and 100% specificity.
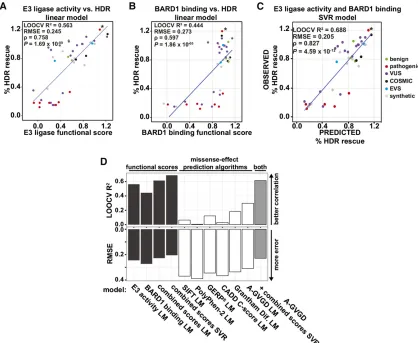
We then asked whether models trained on the E3 ligase and BARD1-binding scores can predict the effects on HDR rescue of substitutions in the full-length protein. We evaluated the accuracy of several models using leave-one-out cross-validation (LOOCV), wherein we serially predicted HDR rescue scores for each of the 44 missense substitutions for which we had
empirical HDR rescue and functional scores from models fit
on the 43 remaining variants. We first compared the
perfor-mance of models tested on scores from the E3 ligase and BARD1-binding assays alone or in combination. A linear model based on scores from both assays outperformed linear models based on scores from either assay alone (Figure 3, A and B). However, because we observed a nonlinear relationship be-tween E3 ligase and BARD1-binding scores (Figure 1F), we tested whether nonlinear models would improve HDR predic-tion results. A support vector regression (SVR) model trained on E3 ligase scores and BARD1-binding scores yielded the best predictive power for HDR rescue (Figure 3C).
We next replaced our experimental data with computa-tional predictions from several popular variant effect pre-diction algorithms (Grantham 1974; Ng and Henikoff 2003;
Cooper et al. 2005; Tavtigian et al. 2006; Adzhubeiet al.
2010; Kircher et al. 2014), which incorporate evolutionary
constraints and/or chemical differences between amino acid side chains, and repeated the model training procedure. In-dividually, these prediction-based models performed poorly at predicting a substitution’s effect on HDR (Figure 3D, white
bars, andFigure S7). Although A-GVGD was the best
perform-ing algorithm, it yielded higher error and lower correlation
than all experimentally-based models (Figure 4D andFigure
S7F). Furthermore, when we added the A-GVGD predictions
to the experimental data and trained a hybrid model, perfor-mance was not enhanced over the experimentally based
models (Figure 3D, gray bar, andFigure S7G). A plausible
explanation for the comparatively poor performance of models trained on computational predictions is that they are largely based on features that are not specific to BRCA1 (e.g., Grantham chemical difference scores) or on evolutionary constraint
in-formation that captures organismalfitness over evolutionary
timescales, which may poorly discriminate subtle and strong molecular effects on BRCA1 function.
Because the SVR model based on combined functional data sets from the two assays was the most accurate, we used it to predict HDR scores for the 1287 BRCA1 RING domain
missense variants with both high-confidence E3 ligase and
BARD1-binding scores (Figure 4, A–C andTable S2), 1225 of which have not yet been reported in clinical sequencing. The distribution of predicted HDR scores is bimodal; 785 missense substitutions are predicted to have little effect on HDR, with
predicted rescue scores .0.77 (Figure 4A). Conversely, 160
substitutions are predicted to be damaging to HDR, with
scores ,0.33; these variants would potentially increase the
risk of hereditary breast and ovarian cancer. Based on this SVR modeling, only 342 variants have predicted scores in the indeterminate region between functional and nonfunctional.
As expected, predicted HDR scores for most of the 19 known pathogenic mutants in the BRCA1 RING domain are low (Figure 4B). Excluding pathogenic mutants known to af-fect splicing or used to train the model leaves 10 pathogenic mutants. All 10 have predicted HDR scores,0.53, the thresh-old for classifying a variant as functional. Nine have predicted
HDR scores,0.33, the maximum empirical HDR rescue score
for a known pathogenic mutant. Thus, our model demon-strates strong performance in predicting HDR activity of known variants (Figure 4B and Table S2). For 31 VUS identified in patients, predicted HDR scores range from near zero to
wild-type-like, with 8 of 31 ,0.53 and 5,0.33, suggesting that
a substantial fraction of individuals with VUS diagnoses may carry pathogenic BRCA1 alleles.
The data in Figure 4C represent a prospective map or look-up table for the effects of missense substitutions in the RING domain of BRCA1 on HDR function. This experimentally-derived map is more accurate than any map that could be generated using current computational tools. In terms of
substitutions with charged or amine-containing polar amino acids; M18 does not tolerate charged, polar, or aromatic sub-stitutions; and F93 and D96 do not tolerate any substitutions. Our data support the idea some variants with defects in the E3 ligase activity are not compromised for HDR and tumor
sup-pression (Reid et al. 2008; Shakya et al. 2011). The benign
variants R7C and D67Y showed no binding defect with BARD1 and were able to rescue HDR but they performed poorly in the E3 ligase selections. However, they may retain enough E3 ligase activity to satisfy a possibly low threshold of requisite activity.
Our results demonstrate the power of empirical measure-ments to assess the impact of missense variants on complex protein functions. Thus, we envision that massively parallel experiments to measure the effects of large numbers of sub-stitutions will meet an urgent need in the clinical translation of genetic information.
Materials and Methods
BRCA1(2-304) single codon substitution library
construction by the Programmed Allelic Series method
Oligonucleotides, 90-mers, to direct the single codon muta-genesis of BRCA1 were synthesized on and released from a 12,000-feature array by Custom Array (Bothell, WA)
(example in Table S3, BRCA1_00284.0). The BARD1(26–
126)–GS–BRCA1(2–304) fusion open reading frame (ORF)
(Christensen et al. 2007) was moved to the pGEM vector
and theEcoRI site in BRCA1 was destroyed. This fragment of
BRCA1 was used as a template for PALS mutagenesis (Kitzman
et al.2015). Sixteen base random barcodes (16N) were added 39of the stop codon in thefinal PCR step. The ligation of the
final mutagenized and barcoded amplicon was transformed into
DH10B electromax cells (NEB) and yielded 250,000 unique transformants of the pGEM_BARD1_GS_BRCA1-var_barcode library.
Subassembly to match 16N barcodes to BRCA1 variants
Since BRCA1(2–304) is too long to be sequenced in one pass by current Illumina technology, we developed a method to create randomly shortened contigs that could be grouped by barcode to use in an assembly method call tag-directed read grouping or subassembly (Hiattet al.2010). A total of 5mg of the plasmid
pGEM_BARD1_GS_BRCA1-var was cut at the 59 end of the
BRCA1 ORF withBamHI and purified. The purified DNA was
digested using the double-strand exonuclease Bal-31 (NEB), 1 unit Bal31 per 1.6 pmol DNA ends at 30°. Aliquots were taken at 0, 3, 7, 11, 13, and 15 min and placed in the DNA-binding buffer from the Zymo clean and concentrate kit to stop the reactions. One-fifth of the digested and cleaned DNA was cut withHindIII and examined by PAGE to determine the degree of digestion. DNA from all time points was pooled and treated with End-it (Epicentre) to blunt and phosphorylate the ends. Blunt-ended, cleaned DNA was A-tailed using goTaq (NEB) and cleaned again. A double-stranded linker containing the Tru-seq Illumina Read 2 primer was ligated onto the A-tailed DNA (W-E4B-subassembly-linker and phosphorylated C-E4B-subassembly linker). The linkered and cleaned DNA was cut withSacI (NEB) to separate the ORF and barcode from the rest of the plasmid. Primers that annealed to the linker and plasmid
DNA directly 39 of the barcode that contain the p5 and p7
Illumina cluster generating sequences (newBRCA1-side_R_CG1 and BRCA1-side_R_CG2) were used to amplify the fragments and barcode for Illumina sequencing in reactions containing the
high-fidelity polymerase KAPA HFHSRM and SYBR green
[conditions: 95°3:00 (98°0:20, 63°0:15, 72°1:50)312–15]. The amplicons were sequenced on an Illumina HiSeq2000 in
paired-end, 2 3101 run mode and with an Illumina MiSeq
paired-end, 23250 kit.
Reads were filtered for quality and grouped by the
sequence of the 16-base barcode. A Smith–Waterman
algo-rithm was used to align the grouped reads to the wild-type
BRCA1(2–304) sequence and a consensus sequence was
de-termined for each barcode group as in Hiattet al.(2010) and
Patwardhanet aI. (2012). A minimum quality score of 20 was
required for a base to contribute to an assembly. Full-length BRCA1(2–304) sequences werefiltered for quality by requir-ing that a given base in the assembly was observed at least twice and was present at an intra-tag group allele frequency of one for positions covered by two to four reads or a frequency of at least 0.8 for positions covered byfive or more reads. If these conditions were not met the assembly was discarded. We assembled 128,237 barcoded variants, of which 60,256
corresponded to 5156 single-amino-acid changes out of the
possible 5757 (89% of the 19 substitutions3303 codons)
in BRCA1(2–304) (seeFigure S1). A database of barcodes
and their associated full-length BRCA1(2–304) assembly
was created to facilitate linking barcodes sequenced from the experimental samples to the full-length subassemblies.
Phage-based E3 ligase assays
The BARD1(26–126)_glycine–serine linker_BRCA1(2–304)
library was subcloned from pGEM_BARD1_GS_BRCA1-var_barcode by cutting and gel purifying theEcoRI andHindIII
fragment and ligating into the genome of T7–Select 10-3b
bacteriophage. Phage genomic DNA was packaged into phage particles, the number of ligation/packaging events was estimated
by titer as 2.56 3 107 plaque-forming units (PFU), and the
phages were amplified in E. coli strain BLT5403 according to the T7Select Cloning Kit instructions (EMD Millipore). The selec-tions for functional BRCA1(2–304) phages were performed as in
Figure 3 Scores from massively parallel E3 ligase and BARD1-binding assays on BRCA1 RING domain variants are better predictors of the HDR activity of the full-length protein. The linear relationship of the E3 ligase scores (A), BARD1-binding scores (B), and HDR scores. (C) A support vector regression (SVR) model of HDR rescue scores from the combination of the E3 ligase and BARD1 binding functional scores. Variants are colored by database of origin. The blue line represents the least-squares fit of the displayed data. Known pathogenic splice variant R71G is marked with an asterisk. (D) Experimentally or computationally derived values for the effect of missense variants on protein function were used to predict the effect on HDR. The LOOCVR2and RMSE for each model is indicated. The RMSE of LOOCV indicates the average distance between the HDR rescue predictions and the true
HDR rescue scores, and the LOOCVR2is the overall correlation between predicted and observed values; low RMSE and highR2indicate better predictive
Staritaet al.(2013) with these differences: amplified phage were never stored more than 24 hr before a sequential round of selection and the 50-ml ubiquitination reactions contained
20ml (13107PFU) of amplified phage, 2 mM ATP, 5 mM
MgCl2, 1 mM wheat E1 ubiquitin activating enzyme, 4 mM
UBE2D3 (UbcH5c), and 8mM Flag-tagged ubiquitin.
DNA from the initial amplified phage population and
amplified phage from each replicate from each offive rounds
of selection was purified from 200 ml of lysate by phenol
chloroform extraction. Barcodes were PCR amplified in
two sequential reactions. Thefirst reaction contained
pri-mers jkA0390_BBcplxcheckF and E4B-index01-8_CG-R or T7_barcodes_common primer_R and 200 ng of phage DNA in
reactions containing the high-fidelity polymerase Phusion
(NEB), 2 mM added MgCl2, and SYBR green [conditions: 95°3:00 (98°0:20, 63°0:15, 72°1:50)310–13]. Reaction
products were monitored by qPCR and removed during expo-nential amplification. The first reactions were purified using the Zymo clean and concentrate kit. One-tenth of that product
was amplified with JK19 and one of the index containing
primers E4B-index01-8_CG-R or common_index_primers such
as NexV2ad2_A1 [conditions: 95°3:00 (98°0:20, 63°0:15,
72°1:50) 34–6]. Again, reaction products were monitored
by qPCR and removed during exponential amplification.
Re-action products were treated with exonuclease I (Affymetrix)
for 15 min at 37° then purified using the Zymo clean and
concentrate kit. Samples were multiplexed and sequenced us-ing primer jkA0390_BBcplxcheckF on an Illumina GAIIx or HiSeq2000 in single end mode.
Yeast two-hybrid-based deep mutational scan for BRCA1-BARD1 binding
The Gal4 DNA-binding domain (Gal4DBD) was amplified from
pOBD2 (Cagney et al.2000) using primersSpeI_Gal4DBD_F
andSpeI_Gal4DBD_R and cloned into p414–ADH (Mumberg
et al. 1995). The BRCA1(2–304) variant library was excised from pGEM_BARD1_GS_BRCA1-var_barcode library by
diges-tion with BamHI (NEB) and PstI (NEB) and ligated into
p414_Gal4DBD to create p414_Gal4DBD_BRCA1_var_barcode,
yielding 1.16 3 105 total transformants. BARD1(26–126)
was amplified from pGEM_BARD1_GS_BRCA1 using primers
EcoRI_BARD1_Ln_F andNcoI_BARD1_Stop_R and cloned into
pOAD (Cagneyet al.2000) containing the Gal4 transcriptional activation domain.
TheS. cerevisiaestrain, PJ69a (Jameset al.1996),
contain-ing pOAD_BARD1 was transformed (Melamed et al. 2013)
with the p414_Gal4DBD_BRCA1_var_barcode library with a yield of1.263106 total transformants. Transformed yeast were transferred to 40 ml SD–Leu–Trp, cultured overnight and stored in 6.7 optical density units (ODU) aliquots at280°.
Two independent experiments (A and B) were per-formed, each consisting of three independent selections: 12.5 ODU (A) or four ODU (B) of cells were collected from each culture at each time point for sequencing. Each ex-periment began by culturing one frozen aliquot of PJ69a transformed with pOAD_BARD1 and p414_Gal4DBD_BRCA1_
var_barcode in SD–Leu–Trp to logarithmic phase (A, 1.01
OD/ml; B, 0.83 OD/ml). Cells from this input population were collected for sequencing and for back dilution into the selec-tion medium (SD–His–Leu–Trp + 10 mM 3-amino-1,2,4 tria-zole (Sigma), A, 5 OD to 200 ml; B, 2 OD to 100 ml) in triplicate. Each replicate was cultured to logarithmic phase (A, 18 hr, 1.1 OD/ml; B, 16 hr, 0.7 OD/ml) after which cells were collected for sequencing and back diluted into fresh se-lection medium (A, 1 OD to 100 ml; B, 0.6 OD to 100 ml). Each replicate was again cultured to logarithmic phase (A, 37 hr, 0.62 OD/ml; B, 40.5 hr, 0.67 OD/ml), after which cells were collected for sequencing and back diluted into fresh se-lection medium (A, 12.5 OD to 125 ml; B, 1.1 OD to 100 ml). Each replicate was again cultured to logarithmic phase (A,
45 hr, 0.43 OD/ml; B, 64 hr, 1.4 OD/ml) and the final time
point was collected.
Plasmid DNA was isolated from the input and samples collected during the selection for growth in the -histidine media using a Zymoprep Yeast Plasmid Miniprep II kit (Zymo Research). Sequencing amplicons were prepared individually for each sample by two successive PCR reactions using Phusion high-fidelity DNA polymerase. In the first reaction, primers jkA0390_BBcplxcheckF and BRCA1-Y2H_commonLin-ker_R were used to amplify the barcoded region of half of the prepared p414_Gal4DBD_BRCA1_var_barcode plasmid. Of
the first reaction, 4% was amplified with primers JK19 and
NexV2ad2_XX to append Illumina cluster generating sequen-ces and a unique sample index sequence. Reaction products of all PCR reactions were monitored on a mini-opticon qPCR
machine (Bio-Rad) and removed during exponential amplifi
-cation. Samples were purified, multiplexed, and sequenced
using primer jkA0390_BBcplxcheckF on a HiSeq2000 in single-end mode.
Slope calculations and normalization
The Illumina reads that matched to barcodes associated with full-length assemblies were retained and unmatched barcodes were discarded. The matched barcodes were converted to the
sequence of the full length BRCA1(2–304) assembly and the
Enrich software package (Fowler et al. 2011) was used to
determine locations and identity of substitutions and to tally the number of times each variant appeared in each population (Table S2).
Sequencing read counts corresponding to a given variant were equal to the sum of read counts from all barcodes matching that variant. For each time point, frequencies were calculated for all variants as the variant’s read count divided by the sum of all read counts at that time point. Variants that dropped out (cannot be found in the selected populations) had their frequencies set to the lowest possible frequency at that time point. Ratios were calculated as the variant’s fre-quency in the selected time point divided by its frefre-quency in the input library. For each variant, a linear model wasfit by least squares to the log ratios over time using numpy.polyfit. The inverse log of this slope corresponds to the percentage change in frequency per unit time. To obtain a normalized score, the average inverse log of the slope for all stop codons was subtracted from all inverse-log-slopes so that stop codons, on average, have a score of 0. These 0 centered values were then divided by the wild-type (WT) inverse-log-slope so that a score of 1 corresponds to WT function.
The normalized score for variantiis
2Slopei2Pm
02Slopem
2SlopeWT ;
where mis the number of stop codons from positions 2–103
related to the frequency in the input population; seeFigure S3
andFigure S6). For each variant, the conservative variance was set to whichever was larger: the variance across all replicates or the value of the Loess curve evaluated at the number of input reads for that variant. This estimate was used to generate the reported confidence intervals (Table S2). Additionally, we used cutoff based on the number of input reads to determine the high-confidence data set that would be used for thefinal HDR predictions. The heuristic to determine the cutoff is
de-scribed in Figure S3 and Figure S6. HDR predictions were
made only for variants with high-confidence scores in both
the E3 ligase and BARD1-binding assays. Finally, a permutation test was used to compare each variant’s slopes to the WT slopes across all replicates. The average difference between paired slopes was used as the test statistic and 10,000 permutations were performed for each variant (Table S2).
Full-length BRCA1 variant construction and HDR assays
Mutations in the BRCA1 RING domain were made by overlap-extension PCR and subcloned into theHindIII andEcoRI sites of pcDNA3–HA–BRCA1 (plasmid described in Chiba and Parvin
2001). All constructs were verified by Sanger sequencing.
BRCA1 rescue of HDR assays were performed in triplicate as
in Ransburghet al.(2010). All BRCA1 HDR rescue scores are
normalized to that of the wild-type protein at HDR rescue = 1. The maximum HDR score for known pathogenic variant of BRCA1 is 0.33. Seven pathogenic variants (excluding splice variant R71G) have been tested for HDR rescue with a mean score of 0.19. Of the only three known benign BRCA1 RING domain variants, all have been tested for HDR rescue and have a minimum score of 0.77 with an average score 0.88.
We defined a BRCA1 HDR rescue score of 0.53—the value
midway between the average HDR rescue scores for known pathogenic BRCA1 variants and the average scores for known benign variants—as the inflection point for discriminating be-tween functional and nonfunctional variants, as was done for
BRCA2 (Guidugliet al.2014).
HDR prediction model building and testing
We obtained SIFT, Polyphen-2, GERP++, and CADD values
from the CADD database (Kircheret al.2014) and
referen-ces therein (http://cadd.gs.washington.edu/download). For
every possible amino acid substitution in BRCA1 (2-103), we obtained Grantham chemical difference values from Grantham(1974), and GVGD values from the A-GVGD BRCA1
web-tool (http://agvgd.iarc.fr/agvgd_input.php). Grantham
deviation (GD) values were used to predict HDR rescue scores. All models werefit and cross-validated using theRpackage
caret (Kuhn 2008). Linear models were fit by least squares.
Support vector regression models used the radial basis func-tion kernel and were validated using a nested cross validafunc-tion scheme (Cawley and Talbot 2010). Briefly, for each step of the LOOCV, an inner LOOCV loop was used to determine model
performance on eachCand sigma pair in the tested parameter
space and the best performing model (based on root mean square error, RMSE) was used to predict the holdout in the
outer loop. The range of sigma values tested in the inner loop
was determined using the sigest function from theRpackage
kernlab and theCvalues tested were 0.1, 1, 2, 5, 10, 100, and
1000. Thefinal model used for HDR predictions was chosen by
picking the parameter pair with the lowest average RMSE across
all iterations of the outer loop (Y2H and E3 model—C= 5
and sigma = 0.1633448, Y2H, E3; GVGD model—C= 5 and
sigma= 0.08220825).
Acknowledgments
We thank Deborah Nickerson, Gail Jarvik, Peter Byers, and Peter Brzovic for comments on the manuscript, Rachel Klevit and Peter Brzovic for the gift of purified E1 and E2 enzymes, Martin Kircher for providing a database of prediction algo-rithm scores for missense substitutions in BRCA1, Charlie Lee for assistance with Illumina sequencing, Amanda Toland for advice regarding the clinical classification of BRCA1 missense variants, and Nancy Lill for providing mutant BRCA1 expres-sion plasmids. This work was supported by National Institutes of Health grants to S.F. (Biomedical Technology Research Resource project no. P41GM103533), J.S. (Director’s Pioneer Award no. DP1HG007811) and D.F. (no. R01GM109110). S.F. is an investigator of the Howard Hughes Medical Institute.
Author contributions: L.M.S. and J.O.K. constructed the BRCA1 allelic series. L.M.S. and J.G. performed the deep mutational scanning experiments. M.I. performed the HDR rescue experiments. L.M.S., D.L.Y., J.G., R.J.H., and D.M.F. analyzed the data. L.M.S., S.F., J.S., D.M.F., D.L.Y., J.G., and J.D.P. wrote the manuscript; all authors reviewed it. S.F., J.D. P., and J.S. supported this project.
Literature Cited
Adzhubei, I. A., S. Schmidt, L. Peshkin, V. E. Ramensky, A. Gerasimova
et al., 2010 A method and server for predicting damaging mis-sense mutations. Nat. Methods 7: 248–249.
Araya, C. L., D. M. Fowler, W. Chen, I. Muniez, J. W. Kellyet al., 2012 A fundamental protein property, thermodynamic stabil-ity, revealed solely from large-scale measurements of protein function. Proc. Natl. Acad. Sci. USA 109: 16858–16863. Bouwman, P., H. van der Gulden, I. van der Heijden, R. Drost, C. N.
Klijnet al., 2013 A high-throughput functional complementation assay for classification of BRCA1 missense variants. Cancer Discov. 3: 1142–1155.
Brzovic, P. S., P. Rajagopal, D. W. Hoyt, M. C. King, and R. E. Klevit, 2001 Structure of a BRCA1–BARD1 heterodimeric RING-RING complex. Nat. Struct. Biol. 8: 833–837.
Brzovic, P. S., J. R. Keeffe, H. Nishikawa, K. Miyamoto, D. Foxet al., 2003 Binding and recognition in the assembly of an active BRCA1/BARD1 ubiquitin-ligase complex. Proc. Natl. Acad. Sci. USA 100: 5646–5651.
Cagney, G., P. Uetz, and S. Fields, 2000 High-throughput screen-ing for protein–protein interactions using two-hybrid assay. Methods Enzymol. 328: 3–14.
Chiba, N., and J. D. Parvin, 2001 Redistribution of BRCA1 among four different protein complexes following replication blockage. J. Biol. Chem. 276: 38549–38554.
Christensen, D. E., P. S. Brzovic, and R. E. Klevit, 2007 E2-BRCA1 RING interactions dictate synthesis of mono- or specific polyu-biquitin chain linkages. Nat. Struct. Mol. Biol. 14: 941–948. Cooper, G. M., E. A. Stone, G. Asimenos, N. I. S. C. C. S. Program,
E. D. Greenet al., 2005 Distribution and intensity of constraint in mammalian genomic sequence. Genome Res. 15: 901–913. Drost, R., P. Bouwman, S. Rottenberg, U. Boon, E. Schut et al.,
2011 BRCA1 RING function is essential for tumor suppression but dispensable for therapy resistance. Cancer Cell 20: 797–809. Fowler, D. M., and S. Fields, 2014 Deep mutational scanning:
a new style of protein science. Nat. Methods 11: 801–807. Fowler, D. M., C. L. Araya, S. J. Fleishman, E. H. Kellogg, J. J.
Stephanyet al., 2010 High-resolution mapping of protein se-quence-function relationships. Nat. Methods 7: 741–746. Fowler, D. M., C. L. Araya, W. Gerard, and S. Fields, 2011 Enrich:
software for analysis of protein function by enrichment and de-pletion of variants. Bioinformatics 27: 3430–3431.
Grantham, R., 1974 Amino acid difference formula to help ex-plain protein evolution. Science 185: 862–864.
Guidugli, L., A. Carreira, S. M. Caputo, A. Ehlen, A. Galli et al., 2014 Functional assays for analysis of variants of uncertain significance in BRCA2. Hum. Mutat. 35: 151–164.
Hashizume, R., M. Fukuda, I. Maeda, H. Nishikawa, D. Oyakeet al., 2001 The RING heterodimer BRCA1–BARD1 is a ubiquitin ligase inactivated by a breast cancer-derived mutation. J. Biol. Chem. 276: 14537–14540.
Hiatt, J. B., R. P. Patwardhan, E. H. Turner, C. Lee, and J. Shendure, 2010 Parallel, tag-directed assembly of locally derived short sequence reads. Nat. Methods 7: 119–122.
James, P., J. Halladay, and E. A. Craig, 1996 Genomic libraries and a host strain designed for highly efficient two-hybrid selec-tion in yeast. Genetics 144: 1425–1436.
Kircher, M., D. M. Witten, P. Jain, B. J. O’Roak, G. M. Cooperet al., 2014 A general framework for estimating the relative patho-genicity of human genetic variants. Nat. Genet. 46: 310–315. Kitzman, J. O., L. M. Starita, R. S. Lo, S. Fields, and J. Shendure,
2015 Massively parallel single amino acid mutagenesis. Nat. Methods.
Kuhn, M., 2008 Building predictive models in R using the caret package. J. Stat. Softw. 28(5).
Lindor, N. M., L. Guidugli, X. Wang, M. P. Vallée, A. N. A. Monteiro
et al., 2012 A review of a multifactorial probability-based model for classification of BRCA1 and BRCA2 variants of un-certain significance (VUS). Hum. Mutat. 33: 8–21.
Melamed, D., D. L. Young, C. E. Gamble, C. R. Miller, and S. Fields, 2013 Deep mutational scanning of an RRM domain of the Saccha-romyces cerevisiaepoly(A)-binding protein. RNA 19: 1537–1551. Miki, Y., J. Swensen, D. Shattuck-Eidens, P. A. Futreal, K. Harshman
et al., 1994 A strong candidate for the breast and ovarian cancer susceptibility gene BRCA1. Science 266: 66–71.
Morris, J. R., L. Pangon, C. Boutell, T. Katagiri, N. H. Keepet al., 2006 Genetic analysis of BRCA1 ubiquitin ligase activity and its relationship to breast cancer susceptibility. Hum. Mol. Genet. 15: 599–606.
Moynahan, M. E., J. W. Chiu, B. H. Koller, and M. Jasin, 1999 Brca1 controls homology-directed DNA repair. Mol. Cell 4: 511–518.
Mumberg, D., R. Müller, and M. Funk, 1995 Yeast vectors for the controlled expression of heterologous proteins in different ge-netic backgrounds. Gene 156: 119–122.
Ng, P. C., and S. Henikoff, 2003 SIFT: predicting amino acid changes that affect protein function. Nucleic Acids Res. 31: 3812–3814.
Patwardhan, R. P., J. B. Hiatt, D. M. Witten, M. J. Kim, R. P. Smith
et al., 2012 Massively parallel functional dissection of mam-malian enhancers in vivo. Nat. Biotechnol. 30: 265–270. Pierce, A.J., P. Hu, M. Han, N. Ellis, and M. Jasin, 2001 Ku DNA
end-binding protein modulates homologous repair of double-strand breaks in mammalian cells. Genes Dev. 15: 3237–3242. Ransburgh, D. J. R., N. Chiba, C. Ishioka, A. E. Toland, and J. D.
Parvin, 2010 Identification of breast tumor mutations in BRCA1 that abolish its function in homologous DNA recombination. Cancer Res. 70: 988–995.
Reid, L. J., R. Shakya, A. P. Modi, M. Lokshin, J.-T. Cheng et al., 2008 E3 ligase activity of BRCA1 is not essential for mamma-lian cell viability or homology-directed repair of double-strand DNA breaks. Proc. Natl. Acad. Sci. USA 105: 20876–20881. Shakya, R., L. J. Reid, C. R. Reczek, F. Cole, D. Egli et al.,
2011 BRCA1 tumor suppression depends on BRCT phospho-protein binding, but not its E3 ligase activity. Science 334: 525–528.
Starita, L. M., J. N. Pruneda, R. S. Lo, D. M. Fowler, H. J. Kimet al., 2013 Activity-enhancing mutations in an E3 ubiquitin ligase identified by high-throughput mutagenesis. Proc. Natl. Acad. Sci. USA 110: E1263–E1272.
Tavtigian, S. V., A. M. Deffenbaugh, L. Yin, T. Judkins, T. Scholl
et al., 2006 Comprehensive statistical study of 452 BRCA1 missense substitutions with classification of eight recurrent sub-stitutions as neutral. J. Med. Genet. 43: 295–305.
Towler, W. I., J. Zhang, D. J. R. Ransburgh, A. E. Toland, C. Ishioka
et al., 2013 Analysis of BRCA1 variants in double-strand break repair by homologous recombination and single-strand anneal-ing. Hum. Mutat. 34: 439–445.
Vega, A., B. Campos, B. Bressac-De-Paillerets, P. M. Bond, N. Janin
et al., 2001 The R71G BRCA1 is a founder Spanish mutation and leads to aberrant splicing of the transcript. Hum. Mutat. 17: 520–521.
Wu, W., K. Sato, A. Koike, H. Nishikawa, H. Koizumi et al., 2010 HERC2 is an E3 ligase that targets BRCA1 for degrada-tion. Cancer Res. 70: 6384–6392.
GENETICS
Supporting Information http://www.genetics.org/lookup/suppl/doi:10.1534/genetics.115.175802/-/DC1
Massively Parallel Functional Analysis of BRCA1
RING Domain Variants
Lea M. Starita, David L. Young, Muhtadi Islam, Jacob O. Kitzman, Justin Gullingsrud, Ronald J. Hause, Douglas M. Fowler, Jeffrey D. Parvin, Jay Shendure, and Stanley Fields
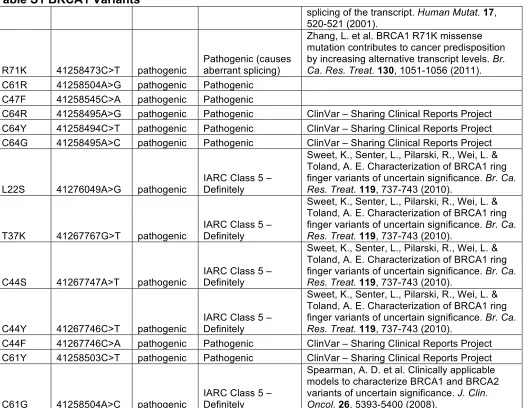
Table S1 BRCA1 Variants
Amino acid change
HG19 Genomic Location
Category in
manuscript Notes Reference
L30F 41267786G>T cosmic
Forbes, S. A. et al. COSMIC: mining complete cancer genomes in the Catalogue of Somatic
Mutations in Cancer. Nucl. Acids Res.39,
D945-50 (2011).
L49M 41258539C>A cosmic
Forbes, S. A. et al. COSMIC: mining complete cancer genomes in the Catalogue of Somatic
Mutations in Cancer. Nucl. Acids Res.39,
D945-50 (2011).
C47W 41258543C>G cosmic
Forbes, S. A. et al. COSMIC: mining complete cancer genomes in the Catalogue of Somatic
Mutations in Cancer. Nucl. Acids Res.39,
D945-50 (2011).
C47R 41258545T>C cosmic
Forbes, S. A. et al. COSMIC: mining complete cancer genomes in the Catalogue of Somatic
Mutations in Cancer. Nucl. Acids Res.39,
D945-50 (2011).
E9Q 41276088G>C cosmic
Forbes, S. A. et al. COSMIC: mining complete cancer genomes in the Catalogue of Somatic
Mutations in Cancer. Nucl. Acids Res.39,
D945-50 (2011).
R7H 41276094C>T evs
Less than 1% Allele Frequency
Exome Variant Server, NHLBI GO Exome Sequencing Project (ESP), Seattle, WA (URL: http://evs.gs.washington.edu/EVS/) [(October, 2014)].
G98C 41256894C>A evs
Less than 1% Allele Frequency
Exome Variant Server, NHLBI GO Exome Sequencing Project (ESP), Seattle, WA (URL: http://evs.gs.washington.edu/EVS/) [(October, 2014)].
E23Q 41276047C>G evs
Less than 1% Allele Frequency
Exome Variant Server, NHLBI GO Exome Sequencing Project (ESP), Seattle, WA (URL: http://evs.gs.washington.edu/EVS/) [(October, 2014)].
Q60R 41258506T>C evs
Less than 1% Allele Frequency
Exome Variant Server, NHLBI GO Exome Sequencing Project (ESP), Seattle, WA (URL: http://evs.gs.washington.edu/EVS/) [(October, 2014)].
D67Y 41258486C>A benign
IARC Class 1-Neutral
Easton, D. F. et al. A systematic genetic assessment of 1,433 sequence variants of unknown clinical significance in the BRCA1 and BRCA2 breast cancer-predisposition
genes. Amer. J. Hum. Gen.81, 873-883
(2007).
R7C 41276095G>A benign benign ClinVar – Sharing Clinical Reports Project
K45Q 41243060A>G benign
IARC Class 1 – Not pathogenic
Easton, D. F. et al. A systematic genetic assessment of 1,433 sequence variants of unknown clinical significance in the BRCA1 and BRCA2 breast cancer-predisposition
genes. Am. J. Hum. Gen.81, 873-883 (2007).
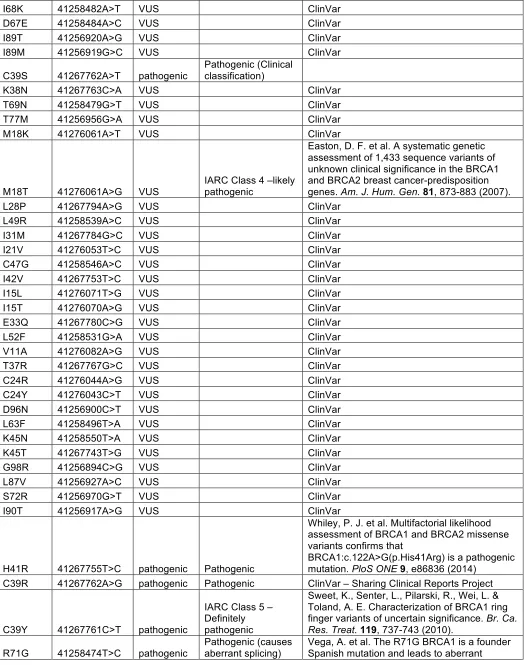
Table S1 BRCA1 Variants
I68K 41258482A>T VUS ClinVar
D67E 41258484A>C VUS ClinVar
I89T 41256920A>G VUS ClinVar
I89M 41256919G>C VUS ClinVar
C39S 41267762A>T pathogenic
Pathogenic (Clinical classification)
K38N 41267763C>A VUS ClinVar
T69N 41258479G>T VUS ClinVar
T77M 41256956G>A VUS ClinVar
M18K 41276061A>T VUS ClinVar
M18T 41276061A>G VUS
IARC Class 4 –likely pathogenic
Easton, D. F. et al. A systematic genetic assessment of 1,433 sequence variants of unknown clinical significance in the BRCA1 and BRCA2 breast cancer-predisposition
genes. Am. J. Hum. Gen.81, 873-883 (2007).
L28P 41267794A>G VUS ClinVar
L49R 41258539A>C VUS ClinVar
I31M 41267784G>C VUS ClinVar
I21V 41276053T>C VUS ClinVar
C47G 41258546A>C VUS ClinVar
I42V 41267753T>C VUS ClinVar
I15L 41276071T>G VUS ClinVar
I15T 41276070A>G VUS ClinVar
E33Q 41267780C>G VUS ClinVar
L52F 41258531G>A VUS ClinVar
V11A 41276082A>G VUS ClinVar
T37R 41267767G>C VUS ClinVar
C24R 41276044A>G VUS ClinVar
C24Y 41276043C>T VUS ClinVar
D96N 41256900C>T VUS ClinVar
L63F 41258496T>A VUS ClinVar
K45N 41258550T>A VUS ClinVar
K45T 41267743T>G VUS ClinVar
G98R 41256894C>G VUS ClinVar
L87V 41256927A>C VUS ClinVar
S72R 41256970G>T VUS ClinVar
I90T 41256917A>G VUS ClinVar
H41R 41267755T>C pathogenic Pathogenic
Whiley, P. J. et al. Multifactorial likelihood assessment of BRCA1 and BRCA2 missense variants confirms that
BRCA1:c.122A>G(p.His41Arg) is a pathogenic
mutation. PloS ONE9, e86836 (2014)
C39R 41267762A>G pathogenic Pathogenic ClinVar – Sharing Clinical Reports Project
C39Y 41267761C>T pathogenic
IARC Class 5 – Definitely pathogenic
Sweet, K., Senter, L., Pilarski, R., Wei, L. & Toland, A. E. Characterization of BRCA1 ring
finger variants of uncertain significance. Br. Ca.
Res. Treat.119, 737-743 (2010).
R71G 41258474T>C pathogenic
Pathogenic (causes aberrant splicing)
Table S1 BRCA1 Variants
splicing of the transcript. Human Mutat.17,
520-521 (2001).
R71K 41258473C>T pathogenic
Pathogenic (causes aberrant splicing)
Zhang, L. et al. BRCA1 R71K missense mutation contributes to cancer predisposition
by increasing alternative transcript levels. Br.
Ca. Res. Treat.130, 1051-1056 (2011).
C61R 41258504A>G pathogenic Pathogenic
C47F 41258545C>A pathogenic Pathogenic
C64R 41258495A>G pathogenic Pathogenic ClinVar – Sharing Clinical Reports Project
C64Y 41258494C>T pathogenic Pathogenic ClinVar – Sharing Clinical Reports Project
C64G 41258495A>C pathogenic Pathogenic ClinVar – Sharing Clinical Reports Project
L22S 41276049A>G pathogenic
IARC Class 5 – Definitely
Sweet, K., Senter, L., Pilarski, R., Wei, L. & Toland, A. E. Characterization of BRCA1 ring
finger variants of uncertain significance. Br. Ca.
Res. Treat.119, 737-743 (2010).
T37K 41267767G>T pathogenic
IARC Class 5 – Definitely
Sweet, K., Senter, L., Pilarski, R., Wei, L. & Toland, A. E. Characterization of BRCA1 ring
finger variants of uncertain significance. Br. Ca.
Res. Treat.119, 737-743 (2010).
C44S 41267747A>T pathogenic
IARC Class 5 – Definitely
Sweet, K., Senter, L., Pilarski, R., Wei, L. & Toland, A. E. Characterization of BRCA1 ring
finger variants of uncertain significance. Br. Ca.
Res. Treat.119, 737-743 (2010).
C44Y 41267746C>T pathogenic
IARC Class 5 – Definitely
Sweet, K., Senter, L., Pilarski, R., Wei, L. & Toland, A. E. Characterization of BRCA1 ring
finger variants of uncertain significance. Br. Ca.
Res. Treat.119, 737-743 (2010).
C44F 41267746C>A pathogenic Pathogenic ClinVar – Sharing Clinical Reports Project
C61Y 41258503C>T pathogenic Pathogenic ClinVar – Sharing Clinical Reports Project
C61G 41258504A>C pathogenic
IARC Class 5 – Definitely
Spearman, A. D. et al. Clinically applicable models to characterize BRCA1 and BRCA2
variants of uncertain significance. J. Clin.
Oncol. 26, 5393-5400 (2008).
Table S2 is available for download as an Excel file at
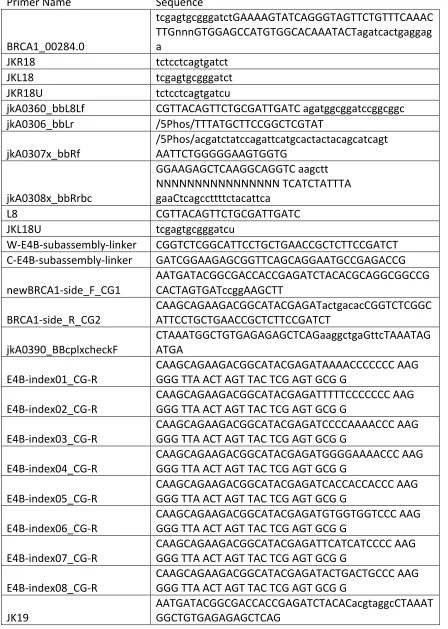
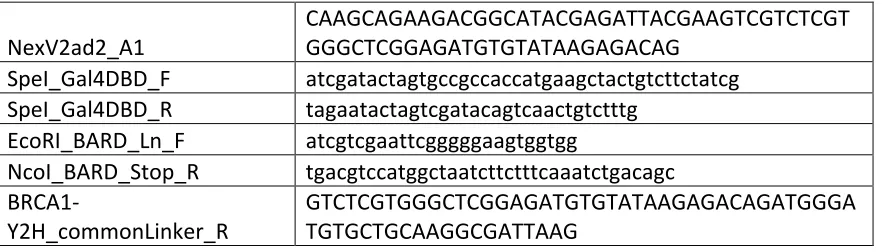
Table S3 Primers
Primer Name
Sequence
BRCA1_00284.0
tcgagtgcgggatctGAAAAGTATCAGGGTAGTTCTGTTTCAAAC
TTGnnnGTGGAGCCATGTGGCACAAATACTagatcactgaggag
a
JKR18
tctcctcagtgatct
JKL18
tcgagtgcgggatct
JKR18U
tctcctcagtgatcu
jkA0360_bbL8Lf
CGTTACAGTTCTGCGATTGATC agatggcggatccggcggc
jkA0306_bbLr
/5Phos/TTTATGCTTCCGGCTCGTAT
jkA0307x_bbRf
/5Phos/acgatctatccagattcatgcactactacagcatcagt
AATTCTGGGGGAAGTGGTG
jkA0308x_bbRrbc
GGAAGAGCTCAAGGCAGGTC aagctt
NNNNNNNNNNNNNNNN TCATCTATTTA
gaaCtcagccttttctacattca
L8
CGTTACAGTTCTGCGATTGATC
JKL18U
tcgagtgcgggatcu
W-‐E4B-‐subassembly-‐linker
CGGTCTCGGCATTCCTGCTGAACCGCTCTTCCGATCT
C-‐E4B-‐subassembly-‐linker
GATCGGAAGAGCGGTTCAGCAGGAATGCCGAGACCG
newBRCA1-‐side_F_CG1
AATGATACGGCGACCACCGAGATCTACACGCAGGCGGCCG
CACTAGTGATccggAAGCTT
BRCA1-‐side_R_CG2
CAAGCAGAAGACGGCATACGAGATactgacacCGGTCTCGGC
ATTCCTGCTGAACCGCTCTTCCGATCT
jkA0390_BBcplxcheckF
CTAAATGGCTGTGAGAGAGCTCAGaaggctgaGttcTAAATAG
ATGA
E4B-‐index01_CG-‐R
CAAGCAGAAGACGGCATACGAGATAAAACCCCCCC AAG
GGG TTA ACT AGT TAC TCG AGT GCG G
E4B-‐index02_CG-‐R
CAAGCAGAAGACGGCATACGAGATTTTTCCCCCCC AAG
GGG TTA ACT AGT TAC TCG AGT GCG G
E4B-‐index03_CG-‐R
CAAGCAGAAGACGGCATACGAGATCCCCAAAACCC AAG
GGG TTA ACT AGT TAC TCG AGT GCG G
E4B-‐index04_CG-‐R
CAAGCAGAAGACGGCATACGAGATGGGGAAAACCC AAG
GGG TTA ACT AGT TAC TCG AGT GCG G
E4B-‐index05_CG-‐R
CAAGCAGAAGACGGCATACGAGATCACCACCACCC AAG
GGG TTA ACT AGT TAC TCG AGT GCG G
E4B-‐index06_CG-‐R
CAAGCAGAAGACGGCATACGAGATGTGGTGGTCCC AAG
GGG TTA ACT AGT TAC TCG AGT GCG G
E4B-‐index07_CG-‐R
CAAGCAGAAGACGGCATACGAGATTCATCATCCCC AAG
GGG TTA ACT AGT TAC TCG AGT GCG G
E4B-‐index08_CG-‐R
CAAGCAGAAGACGGCATACGAGATACTGACTGCCC AAG
GGG TTA ACT AGT TAC TCG AGT GCG G
Table S3 Primers
NexV2ad2_A1
CAAGCAGAAGACGGCATACGAGATTACGAAGTCGTCTCGT
GGGCTCGGAGATGTGTATAAGAGACAG
SpeI_Gal4DBD_F
atcgatactagtgccgccaccatgaagctactgtcttctatcg
SpeI_Gal4DBD_R
tagaatactagtcgatacagtcaactgtctttg
EcoRI_BARD_Ln_F
atcgtcgaattcgggggaagtggtgg
NcoI_BARD_Stop_R
tgacgtccatggctaatcttctttcaaatctgacagc
BRCA1-‐
Y2H_commonLinker_R
GTCTCGTGGGCTCGGAGATGTGTATAAGAGACAGATGGGA
TGTGCTGCAAGGCGATTAAG
# barcodes:
BRCA1 2-304
RING
amino acid substitution
= WT aa = 0
BRCA1 2-304
pGEM BARD1-BRCA1-barcode
16N barcode
A B
custom microarray array-derived oligos
C
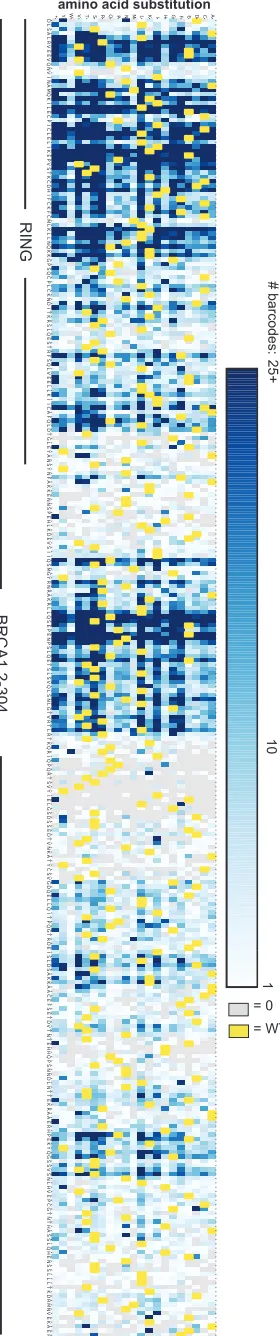
Figure S1 Construction of the BRCA1(2-304) allelic series.
(A) We created an allelic series of variants within BRCA1(2-304) with single amino acid substitutions by the method known as Programmed Allelic Series (Kitzman et al. 2015), which uses mutagenic oligonucleotides synthesized on a programmed microarray to create a pool of variants with single codon changes by overlap-extension PCR. (B) Each variant was barcoded with a random 16-nucleotide tag that we associated with the mutation present in the BRCA1 domain. We assembled 128,237 barcoded variants, of which 60,256 corresponded to 5,156 single amino acid changes out of the possible 5,757 (89% of the 19 substitutions x 303 codons) in BRCA1(2-304). (C) The number of barcodes per assembled BRCA1(2-304) variant is represented in a heatmap. Shades of blue represent the number of barcodes per variant with the maximum color fill set to 25 barcodes. There were many variants that had more than 25 barcodes. Yellow represents wild-type residues and gray potential variants for which there was not a full length BRCA1(2-304) assembly.
25+
10
variant library
BRCA1
T7 coat BARD1(26-126) BRCA1(2-304)
A
Figure S2 Scoring the effects of missense mutation on the E3 ligase activity of the BRCA1 RING domain.
(A) A fusion protein of BARD1(26-126) and BRCA1(2-304) is an active E3 ligase and capable of autoubiquitination in vitro. The allelic series of BARD1(26-126) - BRCA1(2-304) was expressed at the carboxy-terminus of the coat protein of bacteriophage T7. Residues 2-103 are the structured RING domain and lysine residues within 104-304 are required for autoubiquitination.
(B) A phage population displaying the library of BRCA1 variants was incubated in ubiquitination reactions (purified E1, E2 (UbcH5c), Flag-tagged ubiquitin and ATP), in triplicate in two separate experiments. Phages encoding active variants of BRCA1 became ubiquitinated and were collected on anti-Flag beads. After washing, elution by competition with Flag peptide and re-amplification in E. coli, phages were used in the next round of selection. Phage DNA was extracted after each of five sequential rounds of selection and the barcodes were amplified by PCR and sequenced. Barcodes were tallied by single end Illumina sequencing. After converting the barcodes to BRCA1(2-304) variants, we calculated the frequency of each variant in the input and selected populations. For each of the five rounds of selection, we fit a linear curve to the log ratio of the frequency of each variant divided by its frequency in the input population for each of the six replicates. The functional score for each variant is the slope of the fit curve, normalized by setting stop codons to a score of 0 and the wild-type to a score of 1.
ATP, E1, E2
Flag-Ub capture elute
deep sequencing
calculate variant frequency
deep sequencing
calculate selected/input ratio for each variant for each round calculate slope of log2 ratios over 5 rounds of selection
B A
frequency
mean of slopes for WT barcodes over 6 replicates Mean of slopes for WT barcodes averaged over 6 replicates at increasing read cut-offs
Figure S3 Heuristic for filtering high-confidence data set.
(A) The distribution of the log transformed slopes of the nearly 30,000 barcodes (Figure S1) associated with wild-type BRCA1(2-304) sequences (input read cut-offs represented by color). The poor scoring wild-type variants are thought to be due to loss of individual barcodes that follows a Poisson distribution due to experimental bottlenecks. (B) The 800 input read count cut-off maximizes the number of variants contributing to the analysis (black line) while maintaining the maximum Spearman’s rank correlation between the six experimental replicates and minimizing barcode dropout due to bottlenecks (A).
Estimates of variance and 95% confidence intervals can be found for each measurement in Table S2.
Spearman’
s rank correlation
# single amino acid change variants
input library read cut-off Correlation between replicates at increasing input read cut-offs
1.00
0.95
0.90
0.85
0.80
0.75
0.70
100
0 200 400 800 1200 1500 2000
3500
3000 5000
4500
4000
2500
2000 2.0
1.5
1.0
0.5
0.0
0 1
-2 -1
-3
A
Gal4-DBD BRCA1(2-304)
Gal4-AD BARD1BRCA1(26-126)
selection in -histidine
+
variant library
calculate selected/input ratio for each variant for each time point calculate slope of log2 ratios
HIS3 Gal4 binding site
Gal4-AD BARD1
Gal4-DBD BRCA1
transformation, Time 1 Time 2 Time 3
deep sequencing
calculate variant frequency for each time point
deep sequencing deep sequencing deep sequencing
Time 0 B
Figure S5 Diagram of the yeast-two-hybrid selection scheme to measure BRCA1-BARD1 binding.
A B
mean of slopes for WT barcodes over 6 replicates Mean of slopes for WT barcodes averaged
over 6 replicates at increasing read cut-offs at increasing input read cut-offsCorrelation between replicates
Figure S6 Heuristic for filtering high-confidence data set.
(A) The distribution of the log transformed slopes of the nearly 30,000 barcodes (Figure S1) associated with wild-type BRCA1(2-304) sequences (input read cut-offs represented by color). The poor scoring wild-type variants are thought to be due to loss of individual barcodes that follows a Poisson distribution due to experimental bottlenecks. (B) The 800 input read count cut-off maximizes the number of variants contributing to the analysis (black line) while maintaining the maximum Spearman’s rank correlation between the six experimental replicates and minimizing barcode dropout due to bottlenecks (A). Estimates of variance and 95% confidence intervals can be found for each measurement in Table S2.
0 1
-0.10 -0.05
-0.15 0.10
40
30
0.0 20
10
frequency
100 400 200 800 1200
Spearman’
s rank correlation
1.00
0.95
0.90
0.85
0.80
0.75
0.70
input library read cut-off
100
0 200 400 800 1200 1500 2000
1400
1200 2000
1800
1600
1000 # single amino acid
COSMIC EVS pathogenic synthetic VUS benign LOOCV R² = 0.064
RMSE = 0.370
ρ = 0.536
LOOCV R² = 0.005
RMSE = 0.376
ρ = -0.389
% HDR rescue % HDR rescue
A
SIFT linear regressionB
PolyPhen linear regressionP = 0.0002 P = 0.009
0.0 0.4
0.8
1.2
0.0 0.2 0.4 0.6
SIFT value
0.0 0.4
0.8
1.2
0.00 0.25 0.50 0.75 1.00
PolyPhen value * * 0.0 0.4 0.8 1.2
−10 −5 0 5
% HDR rescue
COSMIC EVS pathogenic synthetic VUS benign GERP linear regression
LOOCV R² = 0.122
RMSE = 0.354 ρ = -0.512
P = 0.001 GERPS value
C
0.25 0.50 0.75 1.00 1.255 10 15 20 25
CADD, scaled C-score LOOCV R² = 0.029
RMSE = 0.366
ρ = -0.287
% HDR rescue
D
CADD linear regressionLOOCV R² = 0.181
RMSE = 0.336
ρ = -0.434
% HDR rescue
E
P = 0.003 0.0
0.4
0.8
1.2
0 50 100 150 200
Grantham Chemical Difference Grantham Chemical Difference
linear regression
*
% HDR rescue
Grantham deviation
F
0.0 0.4 0.8 1.20 50 100 150 200
*
LOOCV R² = 0.298
RMSE = 0.310
ρ = -0.540
P = 1.53 x 10⁻⁴
Grantham deviation linear regresssion COSMIC EVS pathogenic synthetic VUS benign * PREDICTED % HDR rescue LOOCV R² = 0.614
RMSE = 0.229 ρ = 0.832
P = 4.69 x 10⁻¹²
0.0 0.4
0.8
1.2
0.0 0.4 0.8 1.2 Combined E3 and BARD binding
functional scores + Grantham Dev SVR
G
OBSERVED % HDR rescue
*
Figure S7 Scatter plots of regressions (models) of HDR rescue scores.
Model type and data source are indicted. Points are colored by database source or clinical classification of variant. LOOCV R2, RMSE, Spearman’s