HIGHLIGHTED ARTICLE
GENETICS | INVESTIGATION
Adaptation, Clonal Interference, and
Frequency-Dependent Interactions in a Long-Term
Evolution Experiment with
Escherichia coli
Rohan Maddamsetti,*,†Richard E. Lenski,*,†and Jeffrey E. Barrick†,‡,1 *Program in Ecology, Evolutionary Biology and Behavior, Michigan State University and†BEACON Center for the Study of Evolution in Action, Michigan State University, East Lansing, Michigan 48824, and‡Department of Molecular Biosciences, Institute for Cellular and Molecular Biology, Center for Systems and Synthetic Biology, University of Texas at Austin, Austin, Texas 78712 ORCID ID: 0000-0003-3370-092X (R.M.)
ABSTRACTTwelve replicate populations ofEscherichia colihave been evolving in the laboratory for.25 years and 60,000 gener-ations. We analyzed bacteria from whole-population samples frozen every 500 generations through 20,000 generations for one well-studied population, called Ara21. By tracking 42 known mutations in these samples, we reconstructed the history of this population’s genotypic evolution over this period. The evolutionary dynamics of Ara21 show strong evidence of selective sweeps as well as clonal interference between competing lineages bearing different beneficial mutations. In some cases, sets of several mutations approached fixation simultaneously, often conveying no information about their order of origination; we present several possible explanations for the existence of these mutational cohorts. Against a backdrop of rapid selective sweeps both earlier and later, two genetically diverged clades coexisted for .6000 generations before one went extinct. In that time, many additional mutations arose in the clade that eventually prevailed. We show that the clades evolved a frequency-dependent interaction, which prevented the immediate competitive exclusion of either clade, but which collapsed as beneficial mutations accumulated in the clade that prevailed. Clonal interference and frequency dependence can occur even in the simplest microbial populations. Furthermore, frequency dependence may generate dynamics that extend the period of coexistence that would otherwise be sustained by clonal interference alone.
KEYWORDSexperimental evolution; clonal interference; frequency-dependent selection; beneficial mutations; asexual populations; mutational cohorts
T
HE long-term evolution experiment (LTEE) spans .25 years and 60,000 generations of bacterial evolution. In this experiment, 12 replicate populations ofEscherichia colihave been propagated in a simple environment, and samples of each population have been frozen at 500-generation inter-vals. This experiment originally focused on whether and to what extent the populations would diverge in their mean fit-ness and other phenotypic properties as they adapted to iden-tical environments (Lenski et al.1991; Lenski and Travisano 1994). Over time, this experiment has become a model for exploring many other aspects of evolution, including the
emer-gence of new functions (Blountet al.2008), the evolution of mutation rates (Sniegowski et al.1997), the maintenance of genetic diversity (Elena and Lenski 1997; Rozen and Lenski 2000; Le Gac et al. 2012), and the structure of the fitness landscape (Khanet al.2011; Woodset al.2011; Wiseret al.
2013). The ability to examine these and other issues has grown tremendously as data that were difficult or impossible to obtain when the LTEE began have yielded to new technol-ogies, particularly genome sequencing (Barrick and Lenski 2009, 2013; Barricket al.2009; Blountet al.2012; Wielgoss
et al.2013).
The LTEE has also inspired theoretical work, especially on the dynamics of adaptation in large asexual populations (Gerrish and Lenski 1998; Hegrenesset al.2006; Desai and Fisher 2007; Schiffels et al. 2011; Park and Krug 2013; Wiser et al. 2013). The LTEE populations are subject to clonal interference, a phenomenon that limits the rate of adaptation by natural selection in large asexual populations. In the absence of recombination, two or more beneficial Copyright © 2015 by the Genetics Society of America
doi: 10.1534/genetics.115.176677
Manuscript received March 23, 2015; accepted for publication April 23, 2015; published Early Online April 24, 2015.
Supporting information is available online at www.genetics.org/lookup/suppl/ doi:10.1534/genetics.115.176677/-/DC1.
1Corresponding author: Institute for Cellular and Molecular Biology, University of Texas at Austin, 2500 Speedway A4800, Austin, TX 78712-1639.
mutations that appear in different lineages in the same pop-ulation cannot recombine into a single background; instead, the lineages that possess alternative beneficial mutations compete with one another. As a consequence, each benefi-cial mutation will interfere with the progress of other con-tending beneficial mutations toward fixation, though the mean fitness of the population will nonetheless rise as the beneficial alleles collectively displace their progenitors. Al-though some early theory on clonal interference was devel-oped with the LTEE in mind (Gerrish and Lenski 1998), other evolution experiments using bacteria and yeast have provided compelling demonstrations of this phenomenon by combining dense temporal sampling with intensive discrim-ination using genetic markers (de Visser and Rozen 2006; Hegreness et al. 2006; Woods et al. 2011; Barroso-Batista
et al. 2014; Levy et al. 2015), in-depth analysis of genes under positive selection (Lee and Marx 2013), or whole-genome sequencing (Langet al.2011, 2013).
Without clonal interference, the classic model of periodic selection in asexual populations involves selective sweeps of beneficial mutations that arise singly and fix sequentially. Neutral and nearly neutral mutations that would otherwise accumulate in an evolving population are swept out (or occasionally tofixation) as each successive beneficial muta-tion goes tofixation (Atwoodet al.1951). As a consequence, within-population genetic diversity rises and falls in con-junction with the successive sweeps, and no specific poly-morphism is maintained indefinitely. Clonal interference can increase genetic diversity in three ways. First, the multiple beneficial mutations, all rising to moderate frequencies, in-crease diversity relative to a single allele rising to high fre-quency. Second, the beneficial alleles remain at intermediate frequencies longer than would a single beneficial mutation of comparable effect size during a classic sweep. Third, while the beneficial mutations remain at intermediate fre-quencies, their associated lineages can accumulate neutral and nearly neutral polymorphisms that also persist longer than they would in the face of selective sweeps that progress to fixation. Nonetheless, the diversity-promoting effects of clonal interference are only transient because eventually one lineage or another will prevail, either because the ben-eficial mutation it carries is superior to the others (even though all lineages are more fit than their predecessors) or because one lineage acquires additional beneficial muta-tions that eventually break the logjam.
Although clonal interference can prolong polymorphic states only transiently, ecological interactions between ge-netically diverged individuals in a population that result in negative frequency-dependent effects onfitness can sustain polymorphisms indefinitely, at least in principle. The LTEE environment was designed to minimize the potential for frequency-dependent interactions to arise and to simplify measuring fitness and assessing the repeatability of evolu-tion. In particular, there are no predators, parasites, or other competing species in the LTEE environment; there is no sexual recombination or horizontal gene transfer; the
phys-ical environment is well mixed and lacks spatial structure; and the density-limiting resource, glucose, is provided at a low concentration, which limits the concentration of meta-bolic byproducts that could support cross-feeding specialists. Nonetheless, frequency-dependent interactions have emerged in at least two LTEE populations (Elena and Lenski 1997; Rozen and Lenski 2000; Blount et al. 2008; Rozen et al.
2009; Le Gac et al. 2012; Plucain et al. 2014; Ribeck and Lenski 2015), and it is possible that such interactions have evolved in some or all of the other populations as well.
In previous work, we sequenced individual clones and population samples taken at generations 2000, 5000, 10,000, 15,000, 20,000, 30,000, and 40,000 from one LTEE popula-tion, designated Ara21, that has served as the focal popula-tion for many in-depth analyses (Barrick and Lenski 2009; Barricket al.2009). Using these genomic data, we designed genotyping assays for many derived alleles present in one or more clones or population samples. In this study, we use population samples taken at 500-generation intervals to ex-amine at high resolution the dynamics of 42 mutant alleles over the first 20,000 generations of this population. These data show compelling evidence for both adaptive fixations and clonal interference. The data also suggest, and competi-tion assays confirm, that a negative frequency-dependent in-teraction evolved that delayed thefixation of some mutations for several thousand generations—in effect extending the du-ration of a particular bout of clonal interference. Neverthe-less, one clade’s slight advantage when rare was eventually overcome by the consolidation of further beneficial mutations in the other clade, and this bubble of transient diversity col-lapsed. Our results are broadly consistent with other evolu-tion experiments that have examined the dynamics ofE. coli
populations as they adapt to simple (chemostat) and complex (mouse gut) environments (Barroso-Batistaet al.2014; Maharjan
et al.2015).
Materials and Methods
Ara21 population samples
The LTEE is described in detail elsewhere (Lenskiet al.1991; Lenski and Travisano 1994; Lenski 2004). In brief, 12 repli-cate populations have been propagated in a glucose-limited medium called DM25. Daily 100-fold dilutions and regrowth allow 6.6 generations per day. Every 500 generations (75 days), after the transfers into fresh medium, glycerol was added as a cryoprotectant to the remaining cultures, which were then stored for later research at–80°. In this study, we analyzed the 40 samples of population Ara21 collected from 500 to 20,000 generations.
Sample preparation for genotypic analyses
a higher glucose concentration to yield more cells) which were incubated for 24 hr at 37°. We also mixed fully grown cultures of the Ara+ancestral strain, REL607, and a 20,000-generation clone from population Ara21, REL8593A, at sev-eral cell ratios for use as standards for calibrating the genotypic analyses. We then isolated genomic DNA from all of these cultures using an Invitrogen PureLink Pro 96 Genomic DNA Purification kit.
In a separate experiment, we revived the frozen samples from generations 7500 and 10,000 using the same protocol as above. The next day, we diluted and plated samples from the cultures, and the following day we picked 90 clones (single-colony isolates) from each sample. We inoculated each of these clones into a flask containing 10 ml of LB medium and isolated genomic DNA from these cultures after growth, as described for the population samples.
We quantified genomic DNA concentrations for all sam-ples using an Invitrogen Quant-iT PicoGreen dsDNA Assay kit, and we then submitted the samples for genotyping to the Michigan State University Genomics Core facility. We pre-pared and submitted three different biological replicates for the population-level analyses, each of which was separately revived from the frozen sample and recultured before DNA isolation.
Allele frequency measurements
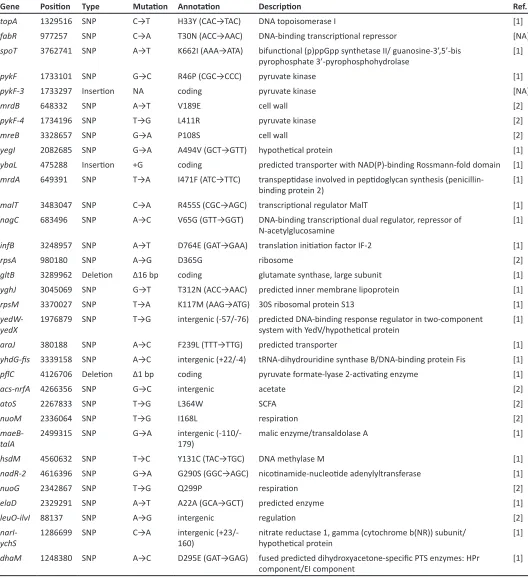
We performed an Illumina GoldenGate Genotyping Assay with Veracode technology to measure allele frequencies in the Ara21 population. We designed allele-specific oligonu-cleotides for single nucleotide polymorphisms (SNPs), inser-tions, deleinser-tions, and rearrangements that were previously discovered by sequencing either clones or whole-population samples (Barrick and Lenski 2009; Barrick et al. 2009). These oligonucleotides contain universal PCR primer sequen-ces and barcode sequensequen-ces targeting specific Veracode mi-crobead types. Allele-specific,fluorescent-labeled PCR products hybridize to the microbeads, and thefluorescent signal provides an indicator of allele frequency. Of the assays we designed, 42 SNPs and indels yielded useful data about the history of the Ara21 population. The mutations are listed inSupporting Information,Table S1.
Illumina’s GenomeStudio software gave initial estimates of allele frequencies. We used the allele frequency estimates generated from known mixtures of REL8593A and REL607 to correct the frequencies of 26 of the 42 mutations that were present in REL8593A (all those that hadfixed in the popula-tion by 20,000 generapopula-tions). These DNA samples consisted of 21 known mixtures of the two strains designed to contain every 5% increment, based on culture volumes, in the per-centage of REL8593A from 0 to 100%. We estimated the true ratio of cell numbers in each mixed sample by plating a di-lution on tetrazolium arabinose (TA) indicator agar and counting the red and white colonies made by REL8593A and REL607, respectively.
Average cell size increased over time in the LTEE (Lenski and Travisano 1994), and the evolved bacteria also contain
more DNA per cell than the ancestral strain (Lenski et al.
1998). This change in DNA content meant that the ratio of REL8593A to REL607 cells in the control mixtures had to be corrected to reflect the actual number of copies of the evolved and ancestral alleles in these samples. To account for this difference, we stained stationary-phase cultures of the ances-tral Ara– clone, REL606, and the 20,000-generation clone, REL8593A, with a PicoGreenfluorescent DNA stain (Ferullo
et al.2009) and usedflow cytometry to quantify the average genomic DNA content per cell in DM100 media (Figure S1). We used six replicate measurements to calculate a correction factor for the allele frequencies in the REL8593A/REL607 mixtures. On average, the evolved REL8593A cells had 1.6760.23 (695% confidence interval) times as much DNA as the ancestral REL606 cells under these conditions.
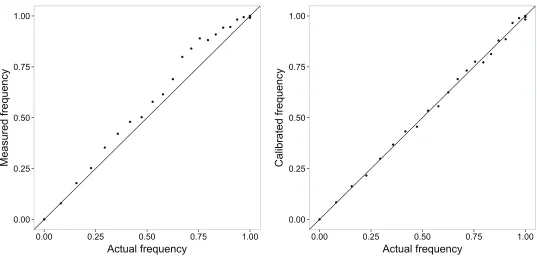
With this information, we further corrected the raw frequencies estimated for each allele (u0) from the Genome-Studio genotyping software to the known frequencies of that allele (u) in the control DNA samples. From the triplicate assays of the REL8593A/REL607 mixtures, wefit a calibration curve for each allele to an empirical function that corrected for a symmetric convex bias that captured the deviation from linearity (Figure S2). Specifically, wefitfive coefficients (cn) in a linear model of the formu=u0+c1(u0–u02) +c2(u0–
u04) + c3(u0– u06) + c5(u0 –u08) + c5(u0– u010) to each calibration curve. Then, we used these curves to correct the GenomeStudio estimates of allele frequencies in all of the Ara21 population samples that we analyzed. These calcula-tions, as well as the code used to plot the temporal dynamics of the allele frequencies, are available as R analysis scripts at the Dryad Digital Repository, a curated resource of published and freely usable scientific data (doi:10.5061/dryad.3m00k). For the 17 transient alleles we analyzed that were not present in the REL8593A genome, we could not correct their estimated allele frequencies in this way. These allele estimates are thus expected to be slightly less accurate (seeFigure S2
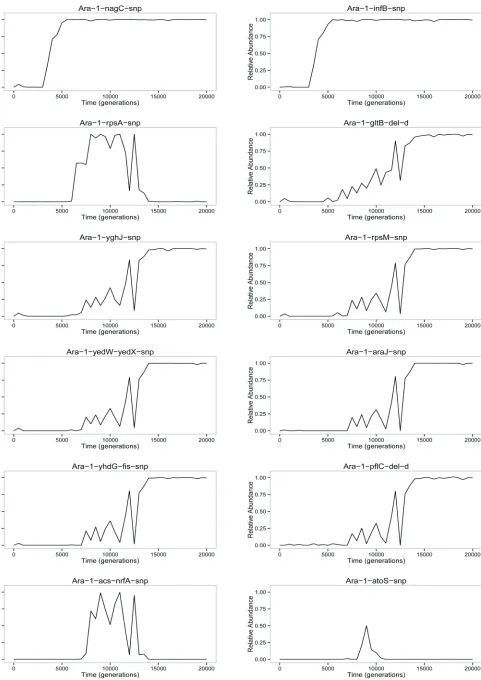
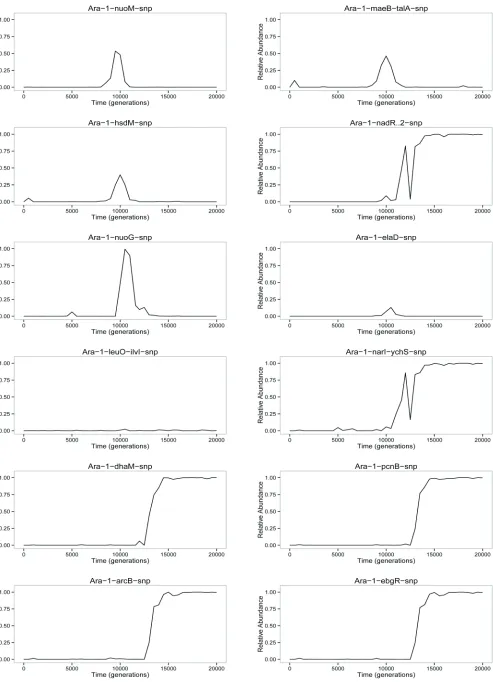
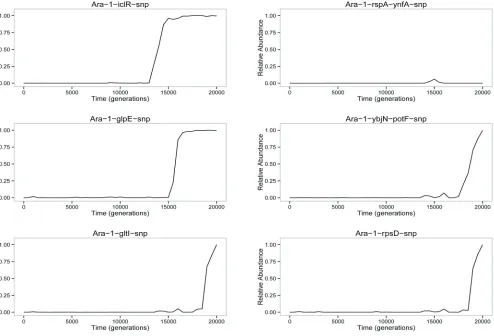
for an example of the typical magnitude of this correction). In cases where these unsuccessful mutations were competing with a contemporary allele thatfixed by 20,000 generations, we constrained their frequencies to being no more than 100% minus the prevalence of the most abundant successful mutation. In any case, the estimated frequency trajectory for each individual evolved allele is shown in Figure S3, while the Muller plot in Figure 1A is based on a simple interpreta-tion of how the estimated frequencies of each genotype sum to 100%.
Pyrosequencing
deletion in the case of gltB. Again, control mixtures of REL607 and REL8953A cultures were used to verify the accuracy of inferred allele frequencies, including the correc-tion for the relative DNA content in each strain as described above.
Competitions to test for frequency-dependent interactions
The ancestral strain REL606 and the cells from population Ara21 cannot grow on the sugar L-arabinose owing to a point mutation in the araA gene (Studier et al. 2009). However, one can obtain Ara+mutants by inoculating large numbers of cells onto minimal arabinose (MA) plates; most of the resulting mutants are selectively neutral under the conditions of the LTEE, and the Ara phenotype serves as a useful marker in competition experiments used to measure relativefitness (Lenskiet al.1991). Thus, we isolated Ara+ mutants of certain evolved clones of interest by inoculating those clones onto MA plates. We then confirmed the neu-trality of those mutations with competition assays involving a 1:1 volumetric ratio of the Ara+ mutants and their Ara–
parents. These Ara+mutants and their Ara–parents were then used to test for frequency-dependent interactions per the fol-lowing procedure; this procedure is identical to that used to test for neutral Ara+ mutants, with the exception of using three volumetric ratios instead of one.
To begin a competition assay, two clones (one Ara–and the other Ara+) were inoculated separately from freezer stocks intoflasks containing LB medium and grown for 24 hr at 37°. These cultures were then diluted 100-fold into saline solu-tion, and 0.1 ml was transferred into 9.9 ml of DM25 (i.e., the same medium as used in the LTEE), where the cultures were again incubated for 24 hr at 37°. This step ensured that the competitors were physiologically acclimated to the same con-ditions where they would compete.
The two clones were then mixed at three initial volumetric ratios (1:9, 1:1, and 9:1) and a combined 0.1 ml was added to 9.9 ml of DM25. An initial sample was taken immediately from this mixture and plated on TA agar (where Ara– and Ara+ cells produce red and white colonies, respectively) to estimate the initial number of each type (Ni). The mixture was then propagated for 6 days with daily 1:100 dilutions in DM25 medium. At the end of the experiment, a second sam-ple was plated onto TA agar to estimate thefinal number of each type of cell (Nf). The Malthusian parameter (m) was then calculated as the realized growth rate of a competitor over the competition, as follows: m = ln(100t 3 Nf/Ni)/t,
where t is the number of days of dilution and regrowth, and where cell numbers reflect equivalent end-of-cycle values based on the dilutions used for plating. The fitness of one clone relative to the other was then calculated simply as the ratio of their Malthusian parameters.
For each pair of competitors, we performed 12 replicate assays at each initial ratio. The plate counts, fitness calcu-lations, and R scripts used to analyze and plot the data are available at the Dryad Digital Repository (doi:10.5061/ dryad.3m00k).
Results and Discussion
Muller plot of allele dynamics
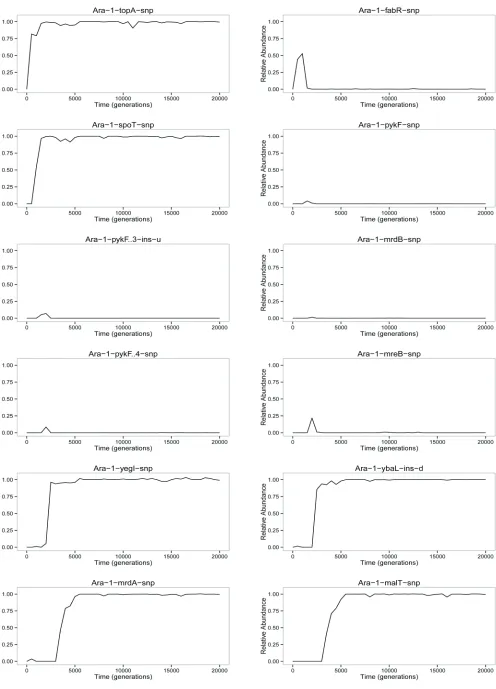
Figure 1A shows the dynamics across 20,000 generations of 42 spontaneous mutations that arose and reached detect-able frequencies in the Ara21 population of the LTEE. Each mutation is identified by the name of the gene in which it occurred (e.g.,topA) or, for mutations in intergenic regions, by the adjacent genes (e.g., yedW-yedX). In a few cases, a numeral follows the name of a gene to distinguish muta-tions that affected the same gene (e.g., severalpykFalleles). Twenty-five of these 42 mutations—all of them with labels preceded by dots (e.g., topA at the left and rpsD on the right)—eventually reachedfixation (or nearly so) in the pop-ulation. In other words, these mutations were on the line of descent leading to fully sequenced clones from generations 30,000 and 40,000. The other 17 mutations were transient (e.g.,fabRon the left). That is, these alleles reached detect-able frequencies—and in a few cases even achieved majority status (e.g.,acs-nrfAbetween generations 8500 and 12,500)— but they later went extinct. Trajectories for each mutation are also shown separately inFigure S3.
Not all mutations were tracked
Figure 1A contains a great deal of data, but when interpret-ing these dynamics it is important to realize that some in-formation is missing because only a subset of all mutations was targeted in our genotyping assays. Many alleles were undoubtedly rare and transient; if an allele was not moder-ately abundant (at least several percent) in one of the gen-erational samples that were deeply sequenced (Barrick and Lenski 2009), and if it was not on the line of descent leading to the clones sequenced in later generations (Barricket al.
2009), then we could not design a targeted genotyping as-say to detect it. Moreover, even some alleles that were known tofix in the population could not be accurately quan-tified using our genotyping method, (e.g., new transposon insertions and other structural mutations) and so informa-tion for those mutainforma-tions is also missing from Figure 1A. We attempted to assay all 37 mutations in the 20,000-generation clone, REL8593A, that were on the line of descent leading to clones sequenced at 30,000 and 40,000 generations (Barrick
Pure drift cannot explain evolutionary rate
Random genetic drift alone cannot explain the large number of fixations observed or, for that matter, even one fixation. Each LTEE population began from a single haploid cell, and therefore any variant arose as a new mutation with an initial frequency of 1/N, whereNis the population size. For a neutral mutation that eventuallyfixes in a population, the expected time tofix by random drift alone (i.e., without hitchhiking) is on the order ofNgenerations (Kimura 1983). In the LTEE,N
fluctuates between53106and53108as a consequence of the daily dilutions and regrowth (Lenskiet al.1991). These numbers are far too large to allow mutations to fix by pure drift in 20,000 generations, much less within the many fewer generations observed for the earliestfixations.
Beneficial drivers
We also know that meanfitness increased over the course of the LTEE. It increased in an almost step-like manner over the first few thousand generations (Lenski et al.1991; Lenski and Travisano 1994), implying a series of fixations of ben-eficial driver mutations under positive selection, and it has continued to increase more gradually during the subsequent tens of thousands of generations (de Visser and Lenski 2002; Wiser et al. 2013). We also know or infer that particular mutations were beneficial because isogenic strains were con-structed to measure the fitness effects of single evolved mutations, because similar mutations affecting the same gene reached high frequencies or fixed in many replicate LTEE populations, or both. These known or suspected ben-eficial drivers include 15 of the mutations in Figure 1A in-cludingtopA(Crozatet al.2005, 2010; Woodset al.2011),
fabR (Woods et al. 2011; Deatherage et al. 2015), spoT
(Cooper et al. 2003; Woods et al. 2011), three in pykF
(Woodset al.2006, 2011; Barricket al.2009),mrdB(Woods
et al.2006),mrdA(Woodset al.2006),malT(Pelosiet al.
2006), infB (Barrick et al. 2009), fis (Crozat et al. 2005),
nadR(Woodset al.2006; Barricket al.2009),pcnB(Barrick
et al. 2009), iclR (Barrick and Lenski 2009), and rpsD
(Barrick et al. 2009). It is likely that additional mutations in Figure 1A were also beneficial drivers, while some others may have been neutral or weakly deleterious hitchhikers that achieved transiently high frequency orfixation by virtue of beneficial mutations present in the same genomes.
Clonal interference
Clonal interference refers to the effect of competition between beneficial mutations that occur in different lineages in the same asexual population; its effects are clearly seen in Figure 1A as wedges that open, expand, and then close. Owing to the absence of genetic exchange, two or more beneficial mutations that arise contemporaneously, but in different lineages, cannot be combined in the same genome. Instead, one will eventually prevail and the others must go extinct. The winning lineage might prevail because its initial driver mutation is more beneficial than the initial drivers in the contending lineages. However, the winner might also
depend on the effects of later beneficial mutations that arise in one or more of the contending lineages. Such an outcome is especially likely if the initial drivers in the different line-ages have similar fitness effects, because that similarity means it would take longer for one lineage to exclude the other, thus providing more time for later beneficial muta-tions to occur and affect the outcome.
One interference wedge is seen near the very start as a mutation in fabR rises in frequency over the first 1000 generations, but that lineage declines precipitously during the next 500 generations before disappearing entirely (Figure 1A). Five more wedges rise and fall between generations 1000 and 2500. Strikingly, three of them involve different mutations in one gene, pykF. Yet another mutation in pykF
later went to fixation in this population (Schneider et al.
2000; Barricket al.2009), but it is not shown here because the type of mutation—an insertion of an IS150element—was not amenable to the method for detecting genetic polymor-phisms used in this study. Moreover, differentpykFmutations fixed in all 12 LTEE populations (Woodset al. 2006). Thus, there were numerous parallel increases of pykF mutations, both within and across populations, and this parallel evolu-tion provides strong evidence that these were beneficial mutations.
Some additional interference wedges are also present later in the Muller plot including, most notably, an extre-mely large one that begins with a mutation in rpsAaround generation 5000. This lineage became numerically domi-nant by generation 8000; it remained the majority for thou-sands of generations before a precipitous decline and sharp recovery between 11,000 and 13,000 generations; and it finally petered out to extinction by generation 15,000. We will return to this episode in a later section onEvidence for frequency dependence.
Rapid increases in mutation frequencies
Except for the period from 5000 to 15,000 generations, most mutations that fixed in the Ara21 population did so very quickly, usually within a few thousand generations. Al-though these dynamics are visually striking, they are not unexpectedly fast. Three issues come into play when we consider these dynamics. First, the alleles tracked in the Muller plot arose by mutation long before they are shown as being present. Only alleles with frequencies well above 1% could be reliably detected using our methods, but when any new mutation occurred its frequency was 1/N, a mere 0.0000002–0.00002% depending on when the mutational event happened in the transfer cycle. In any case, each suc-cessful allele had to reach at least 0.00002% after surviving thefirst transfer event, which took place within thefirst day after it arose. Thus, mutations were hidden from view until they had increased in frequency by 50,000-fold or more.
(Barricket al.2009). Assuming a constantfitness difference, the logarithm of the ratio of the beneficial mutant to its pro-genitor should increase linearly (Dykhuizen and Hartl 1983). For a mutation that confers a 10% advantage, it takes only 33 generations (doublings, as used in the LTEE) to rise from 1:100 to 1:10, another 33 generations to increase from 1:10 to 1:1 (i.e., 50%), another to go from 1:1 to 10:1, and one more to achieve nearfixation at 100:1. For this mutation, the entire “visible” process would occur in 130 generations; however, the time steps in Figure 1A are 500 generations each, and so thefixation would likely be manifest in a single interval. For a mutation that gives a 1% benefit, each order-of-magnitude change in the ratio would take 10-fold longer, or330 generations. In that case, the visiblefixation process would require 1300 generations, which still falls within a mere three time steps in the Muller plot.
Third, in many of the fixation events, the initial rate of increase in a lineage was much steeper than the final rate. For example, the lineage with the ybaL allele went from undetectable in the 2000-generation sample to being the vast majority by generation 2500, but it did not fix until after generation 5000. Stated the other way, many lineages are unexpectedly persistent, such as the lineage that carried the spoT allele but lacked the yegI and ybaL mutations, which hung on at low frequency from 2500 to 5000 gener-ations. We can posit two explanations for this effect. First, as a consequence of clonal interference, a lineage that has a new beneficial mutation is initially competing primarily with its progenitor, but over time that lineage will increas-ingly compete against other lineages with different benefi-cial alleles, thereby slowing its ascent (Langet al.2011).
A second possibility is frequency-dependent selection, such that the unexpectedly persistent lineage has acquired some mutation that gives it a fitness advantage when it is rare; for example, it may more efficiently use a metabolic byproduct of the other lineage. This advantage when rare allows the lineage to survive longer than it otherwise could; in the absence of on-going evolution, its advantage when rare would allow it to persist forever. However, in this scenario the new majority lineage evolves, sooner or later, additional beneficial mutations that overcome the minority type’s ad-vantage when rare, thus completing the extinction of the once-dominant lineage by the successor lineage. Incidentally, a somewhat different scenario occurred in another of the LTEE populations. In that population, two lineages stably coexisted by frequency-dependent selection. Both continued tofix beneficial mutations, and their relative abundance fluc-tuated dramatically over time. However, neither gained a suf-ficient advantage to drive the other extinct, and they have coexisted now for tens of thousands of generations (Rozen and Lenski 2000; Le Gacet al.2012).
Nestedfixations and cohorts thatfix together
In the Muller plot (Figure 1A), we see many examples of nestedfixations, in which one mutation begins its sweep to fixation in the background of a prior mutation that has not
yet completed its own sweep to fixation. For example, be-fore thetopAallele hasfixed, thespoTmutation has begun its rise; similarly, theybaLmutation begins to spread before theyegImutation has fixed. These nestedfixations are not surprising; like clonal interference, they imply that muta-tions with fairly large beneficial effects are sufficiently com-mon, given the population size, that more than one highly beneficial mutation is often present in contending subpopu-lations at the same time.
In other cases, however, we see what appear to be simultaneousfixations of two or more mutant alleles—what have been called“cohorts”(Langet al.2013). One conspicu-ous example involved four mutations in the mrdA, malT,
nagC, and infB genes that rose together starting at 3000 generations in the background carrying theybaLmutant al-lele. Another case started at12,500 generations with three mutations in thepcnB,arcB, andebgRgenes that spread and fixed together.
These quasisimultaneous fixations may, at first glance, seem surprising. In fact, however, there are several plausible explanations for their occurrence, as explained below. An important consideration is that most of the time these mutant alleles spent rising in frequency occurred before they reached a frequency at which they could be detected; thus, the relevant dynamics for determining the order in which the mutations happened were hidden from our view. Also, the hypotheses below are not mutually exclusive; instead, two or more of the processes might be involved in any given cohortfixation.
Simultaneous mutations: The mutations could have oc-curred simultaneously; that is, the two or more changes in the DNA sequence might have taken place in the same replicating cell. However, given what we know about typical mutation rates in bacteria, in general, and the LTEE, in particular (Wielgoss et al. 2011, 2013), this explanation seems very unlikely. It is relevant to note that the Ara–1 population did not evolve a hypermutator phenotype during the 20,000 generations studied here, although it did so later (Barricket al.2009). It is also relevant that most mutations we were able to track using our methods were simple point mutations, rather than mutations involving mobile elements or other genetic mechanisms that may occur at much higher rates (Moxonet al.1994; Cooperet al.2001).
generations later, then the situation becomes more complex. If the hitchhiker is deleterious, then it may rise in frequency for a while but will notfix, because the lineage that carries the beneficial mutation alone will outcompete the lineage with both mutations. If the hitchhiker is neutral, then the double mutant will rise in parallel with the lineage that carries only the beneficial driver, but the hitchhiker should notfix. For example, if a neutral hitchhiker occurs when the lineage with the beneficial mutation has expanded to four cells, then we would expect the double mutant to reach a frequency of25% when the beneficial mutationfixes in the population. In both cases, these scenarios are simplifica-tions because they ignore the effects of clonal interference and random drift. The latter is important especially while the beneficial allele is still very rare. In particular, although a hitchhiker might occur after the beneficial driver, if the genotype that contains only the beneficial mutation was lost by drift (e.g., during a transfer soon after it appeared), then the hitchhiker and driver mutations wouldfix simultaneously.
Beneficial codrivers:The term hitchhiker is usually applied only to neutral or deleterious mutations, as discussed in the preceding paragraph. However, two or more beneficial mutations that occur in the same lineage can help drive one another to fixation, including cases where one or both mutations might not be able to fix by themselves owing to clonal interference from single beneficial mutations of larger effect (Cooperet al.2001; Schiffelset al.2011). In essence, such mutations are codrivers that receive a boost from their partner, similar to the boost that a hitchhiker would get. Although the beneficial mutations may occur sequentially and, in fact, many generations apart, they may nonetheless appear to fix simultaneously. The reason for the apparent simultaneity offixation hinges on the dynamics of selection coupled with the limits of detection of rare genotypes.
Consider a lineage bearing a mutation that confers a 5% fitness advantage, and which survived extinction by random drift. Using the same framework as in the section on Rapid increases in mutation frequencies, the ratio of that lineage to its progenitor should increase by an order of magnitude in 66 generations. After 132 generations, 100 cells will have the beneficial mutation. Now imagine that, at this point, a second beneficial mutation occurs in the back-ground with thefirst mutation, and that the double mutant has a 5% advantage relative to the single mutant and a 10% advantage over the numerically dominant type without ei-ther mutation. Again, we will assume that the double mu-tant escapes extinction by drift, because we are only interested in those cases that leave a record of fixations. The double mutant should increase by an order of magni-tude relative to the single mutant in66 generations, and relative to the nonmutant progenitor in 33 generations. Let us now assume that the mutant alleles can be detected only when they become 1% of the total population. For purposes of these calculations, we will use 107as the population size; this value is conservative because the effective population
size, taking into account the daily transfer cycle in the LTEE, is somewhat larger (Lenskiet al.1991). Absent the second beneficial mutation, the single-mutant lineage would re-quire330 generations to increasefive orders of magnitude and reach the 1% frequency where it could be detected. Although the double mutant appeared 132 generations later, it requires only165 generations to reach the 1% threshold in the population, which remains numerically dominated by the genotype with neither beneficial mutation. Then, after 99 generations more—or 396 generations since thefirst mu-tation and 264 since the second—the double mutant would be 100-fold more common than the single mutant. With the 1% limit of resolution, and with samples taken at 500-generation intervals, it would thus appear as though the two mutations had simultaneouslyfixed, even though they arose many generations apart and were, strictly speaking, nested.
Positive epistasis: This explanation is, in essence, an ex-tension of the previous one. In the LTEE, there is an overall tendency toward diminishing-returns (i.e., negative) epista-sis between beneficial mutations with respect to theirfitness effects (Khanet al.2011; Wiseret al.2013), although there are also exceptions where mutations exhibit positive epista-sis (Blount et al.2012). Even if negative epistasis is more common, cases of positive epistasis may play a disproportion-ate role in cohortfixations. This effect can be easily under-stood by imagining a scenario like the one discussed in the previous paragraph, except now imagine that the two muta-tions together give a 15% benefit, whereas either alone would provide only a 5% benefit. In this case, the double mutant would overtake the single mutant that much sooner, obscuring the sequential order faster and more completely; it would do so even if the two mutations were more sepa-rated in time, if their individual beneficial effects were smaller, or both.
extinct. At that time, this hyperbeneficial mutation will not only fix but also drive tofixation in the total population all the other alleles that previously hadfixed only in its lineage. In the next section, we will present evidence that such a sce-nario played out in population Ara21.
Evidence for frequency dependence
We now turn to the striking dynamics that occurred in this population between 5000 and 15,000 generations (Figure 1A). To better resolve the dynamics, including especially the linkage relationships among various alleles, we genotyped 90 clonal isolates sampled from generations 7500 (Figure 1B) and 10,000 (Figure 1C) for the presence or absence of the various mutations. The earliest discernible events in-volved the simultaneous rise of two distinct clades from within the blue-colored background that bears a cohort of four mutations (including mrdA) that eventually fixed (Figure 1A). One of the two clades began with a mutation in therpsAgene; it is aqua-colored atfirst, then various shades of green as more mutations accumulated with time (Figure 1A). The nested pattern of thefirst two mutations inrpsA
andacs-nrfAwas evident in the clones from generation 7500 (Figure 1B), but by generation 10,000 these two mutations were fully concordant (Figure 1C). Three more mutations— inatoS,nuoG, andnuoM—emerged as distinct subclades in the later sample, but they did not persist (Figure 1C). The other main clade appearedfirst as a cohort of four mutations (including gltB); it is shown in chartreuse initially, with shades of yellow, red, pink, and purple used as more muta-tions arose (Figure 1A). In the clones sampled at 7500 gen-erations, it was impossible to discern the order of thosefirst four mutations, although the next three mutations that arose in this lineage were already present as nested subsets at that point (Figure 1B). By generation 10,000, six tions in this clade had become fully concordant; two muta-tions that would eventually fix (pflC and nadR-2) were nested, as were four others that did not persist (Figure 1C). Following their appearances after 5000 generations, both major clades increased in number, with the one that carried the rpsA mutation becoming the clear majority by 8000 generations and remaining so for most of the next few thousand generations. It then experienced a precipitous decline, a sharp recovery, and another precipitous decline, followed by its extinction. We confirmed that these sharp fluctuations were not artifacts of our genotyping method by also using pyrosequencing to track three diagnostic alleles that distinguished the two clades (Figure S4). By the end of this episode, at least 14 mutations (from gltB to iclR, and probably others not detected by our methods) had piled up on the line of descent before the lineage that ultimately prevailed finally drove the other clade extinct by 15,000 generations.
Clonal interference alone is insufficient: One might be tempted, at first glance, to suggest that this episode was simply a protracted case of clonal interference. We know
that the rate offitness increase decelerated over time (Wiser
et al. 2013) and that the beneficialfitness effects of
muta-tions thatfixed later tend to be smaller than those thatfixed earlier owing to diminishing-returns epistasis (Khan et al.
2011). Together, these facts imply that later fixations usu-ally took longer than earlier ones, thereby providing the opportunity for more drawn-out bouts of clonal interference. However, this explanation does not account for two impor-tant features of the data: (i) there were rapidfixations after, as well as before this episode; and (ii) sharp reversals in the relative abundance of the two lineages occurred within this episode. Moreover, as explained earlier, these dynamics are entirely consistent with the smaller selection coefficients that prevailed in the later generations. Therefore, we think that some other process than simple clonal interference must have contributed to this extremely drawn-out set of fixations.
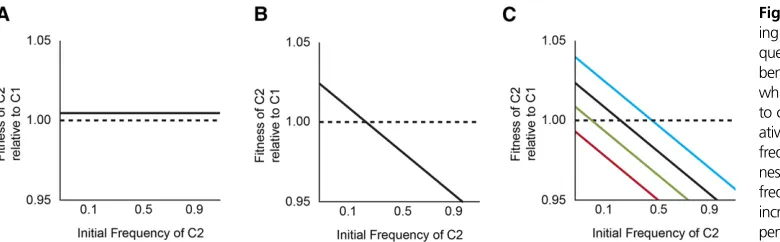
Hypothetical scenario with frequency-dependent fitness: We hypothesized that a negative frequency-dependent in-teraction stabilized the relative abundance of the two clades, while beneficial mutations within each clade buffeted their abundances until, eventually, one drove the other extinct (Figure 2). Under the null hypothesis, the relativefitness of members of the two clades, taken at the same point in time, does not depend on their relative abundance in the popula-tion (Figure 2A). The alternative is that each type has an advantage when rare, such that there is a stable equilibrium (i.e., a relativefitness equal to unity) at some intermediate frequency (Figure 2B). Now imagine that beneficial muta-tions occur in both lineages that alter the shape of thefitness function (Figure 2C). We show these changes as affecting the intercept, but not the slope of the fitness function, as though the mutations provide a general benefit that does not affect the frequency-dependent interaction; however, one can imagine similar scenarios where the slope changes. In the scenario illustrated, the initial equilibrium frequency of clade C2 is0.2. A beneficial mutation in clade C1 drives the equilibrium frequency of C2 down to0.05 (green line), and then a later beneficial mutation in C2 drives its equilib-rium frequency up to 0.5 (blue line);finally, though, an-other mutation in C1 pushes the equilibrium frequency of C2 into negative territory (red line) and C2 then goes extinct, assuming it gets no further beneficial mutations, because it is lessfit than C1 at all frequencies (Figure 2C).
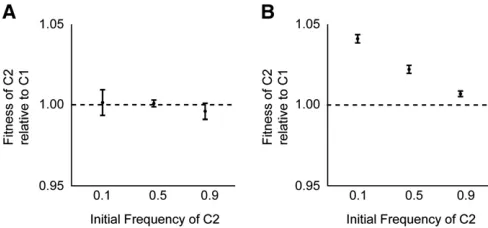
assay. We saw no evidence of frequency dependence (Figure 3A); of course, we cannot exclude the possibility of a very small effect, on the order of 1% or less. It is also notewor-thy that there was no detectable difference in fitness be-tween the two competitors, even though they differed by so many mutations and both were increasing in abundance relative to the overall population in which they arose (Figure 1A).
We repeated this experiment except using the most derived genotypes from clades C1 and C2 at 10,000 generations. In particular, the C1 clone had a mutation in
nuoM, and the C2 clone had a mutation innadRthat was the latest mutation that subsequentlyfixed in the Ara21 popu-lation. In this case, we observed strong frequency depen-dence; the C2 clone had afitness advantage of 5.4% when its starting frequency was 10%, an advantage of 2.9% when its initial frequency was 50%, and an advantage of 0.9% when it started at 90% (Figure 3B). Although the C2 clone wasfitter than the C1 clone at all three initial ratios tested, the trend suggests the possibility of stable coexistence with C1 at an equilibrium frequency of,5%. Note, however, that this hypothetical equilibrium frequency does not match the frequency of clade C1 observed in the 10,000-generation sample, when it was roughly half the total population (Figure 1A). This discrepancy is not surprising, though, be-cause the competitions involved single representatives from two clades that were continuing to evolve and adapt over time. The important point to take away from the frequency-dependent interaction is this: as clade C2 spread, its advan-tage over C1 diminished. The frequency dependence thus helps to explain, at least in part, why this selective sweep took so much longer, and involved many more mutations, than other sweeps that both preceded and followed it.
Failed speciation: The clades C1 and C2 diverged ecologi-cally and accumulated different beneficial mutations over several thousand generations, and one can imagine that they might have coexisted indefinitely. Although we do not know the ecological mechanism promoting coexistence of the two clades, some form of ecological divergence is necessary for negative frequency-dependent selection in haploid organisms.
One possible mechanism is a demographic tradeoff on glucose, such that one ecotype is a superior competitor when glucose is abundant and the other has an advantage when glucose is scarce; an alternative mechanism is a crossfeeding interaction, whereby one ecotype is a superior competitor for glucose and the other is better at competing for metabolic byproducts (Turneret al.1996; Ribeck and Lenski 2015). It is tempting to speculate that such ecological divergence might be an example of failed speciation. Defining speciation is of-ten problematic, and especially so for asexual organisms like those in the LTEE. Nonetheless, one interesting way to think about speciation in bacteria posits that it occurs when line-ages have diverged to occupy ecological niches that are suf-ficiently different that selective sweeps can happen in one lineage without driving the other extinct (Cohan 2006; Cohan and Perry 2007). This modelfits with the general idea that species are cohesive groups that have diverged irrevers-ibly (Templeton 1989). The importance of reproductive iso-lation between sexual species is that it locks in the requisite divergence, but asexual organisms can also diverge irrevers-ibly by adapting to different ecological opportunities (Cohan 2002). Of course, any definition that depends on a multistep temporal process is likely to involve intermediate states—gray areas—of ambiguous status. The divergence and eventual fates of the clades C1 and C2 illustrate that ambiguity. In any case, despite the ecological divergence that led to their negative frequency-dependent interaction, the two clades continued to compete and their fates remained entangled. In time, the further adaptation of one clade caused the com-munity of two nascent species to collapse to a mono-specific population. Without the “fossil record” of frozen samples, studies of later generations would reveal nothing of this in-cipient, but ultimately failed, process of speciation. In contrast to this failed speciation, more persistent ecotypic divergence has evolved in two other LTEE populations, Ara–2 and Ara–3 (Rozen and Lenski 2000; Blountet al.2012).
Conclusions
We tracked the dynamics of several dozen mutations in an
E. coli population as it evolved in and adapted to a simple
laboratory environment for 20,000 generations. The popu-lation started from a single haploid cell, and the bacteria in the experiment lack any mechanism for horizontal gene transfer. Glucose was the limiting resource, and its concen-tration in the culture medium was set low to reduce the cell density and thus, it was thought, simplify the evolutionary dynamics in two respects (Lenski 2004). First, a low popu-lation density should reduce the concentration of metabolic byproducts and thereby limit the opportunity for frequency-dependent interactions. Second, a low population size should reduce the rate at which beneficial mutations arise and thereby reduce the impact of clonal interference. With the benefit of hindsight, it is now clear that frequency-dependent interactions and clonal interference were important forces even at this low glucose concentration.
Thus, despite the apparently simple conditions of the LTEE, the dynamics are rich and complex. As expected, we observed many selective sweeps in which derived alleles replace their ancestral counterparts. The speed with which the sweeps occurred is inconsistent with pure genetic drift, but consistent with what is known about thefitness effects of individual mutations in this experiment, given also the limits of detection for the mutations. We also observed, as expected, many cases of clonal interference. We undoubt-edly documented far fewer instances of interference than actually occurred, because we tracked only mutations that were known to have either fixed in the population or been present at substantial frequency in a few generational samples that were previously screened for polymorphisms (Barrick and Lenski 2009).
Two other features of the genome dynamics were equally conspicuous but more surprising, especially given the pre-sumed simplicity of the experimental conditions. One such feature was the drawn out and temporally complex
in-teraction of two clades, which required several thousand generations before one clade eventually excluded the other. This episode reflected a combination of frequency-dependent selection and the rise of new beneficial mutations in both clades that buffeted their relative numbers before one clade finally gained an insurmountable advantage. Previous work has revealed an even longer-lasting coexistence of two clades in another of the LTEE populations (Rozen and Lenski 2000; Le Gac et al. 2012). In that population, beneficial
mutations also buffeted the abundances of the clades, but the frequency dependence was sufficiently strong that they have continued to coexist for several tens of thousands of generations (Le Gacet al.2012). Our study, along with the work on that other population, shows that frequency-dependent interactions emerged in the LTEE, despite the low resource concentration intended to limit their importance. Our study also shows that such interactions can be transient and might appear, at least superficially, to be cases of very drawn out clonal interference.
The second unexpected feature of the genome dynamics that we observed is the prevalence of cases in which two or more mutations appear to have fixed more or less simulta-neously in the population. These cohorts seem to be at odds with the expectation that fixations should be sequential or nested (i.e., one mutation arising in the background that con-tains the other before it reachesfixation). In a recent study of yeast populations, Lang et al. (2013) found similar cohort fixations by deeply sequencing genomes at many time points. However, the explanation for these mutational cohorts remains unclear. We proposed several possibilities, ranging from the conceptually simple (but unlikely) idea that the mutations occurred simultaneously to more complicated sce-narios that invoke epistasis and frequency dependence. We think the most parsimonious explanation—the null hypothe-sis from a population-genetic perspective—is that these cohorts are an illusion caused by the limited resolution of the actual genome dynamics, at least in the case of small cohorts of two, and perhaps even several mutations. That is, mutations are only detected in these experiments after they have become fairly common—at least one percent— and by that time they have already increased in frequency by many orders of magnitude. As a consequence, given two beneficial mutations that occurred sequentially—but in suf-ficiently close temporal proximity—the double mutant may reach a detectable frequency before the first mutation alone or even when thefirst mutation alone never reaches a detect-able frequency (especially given the 500-generation interval between successive samples in our study).
It is not obvious to us whether the different scenarios, including the null hypothesis, can always be distinguished empirically given the limited resolution of population-genomic methods, the temporal gaps between population samples, and the very smallfitness effects (including frequency-dependent and epistatic interactions) that are likely to be relevant to any particular case. Instead, we suggest that numerical simulations could provide an important next step
toward resolving the causes of the cohorts. By performing simulations, one can explore what rates of mutations and distributions of fitness effects would give rise to the appearance of cohorts for various allele detection limits and sampling schemes. The inferred rates and distributions could then be compared to corresponding rates and distri-butions estimated in other ways, such as from population mean-fitness trajectories (Wiseret al.2013), to determine if they are compatible. Whatever thefindings from these the-oretical studies might be, the results of our study and the rapidly growing body of data from the LTEE and other evo-lution experiments show the exciting challenges that remain for describing and understanding the dynamics of genomic and phenotypic evolution in microbial populations, even un-der seemingly simple conditions.
Acknowledgments
We thank Zachary Blount and Noah Ribeck for discussions; Steven Valenziano for help with producing figures; Jeff Landgraf and Cecil Harkey for assistance with the genotyping and pyrosequencing assays; Jeff Morris, Magdalena Felczak, and Louis King for protocols and help with the flow cytometry; Neerja Hajela for assistance in the laboratory; and the editor and reviewers for helpful comments. This work was supported by the National Science Foundation (DEB-1019989 to R.E.L.), the National Institutes of Health (R00-GM087550 to J.E.B.), the National Science Foundation BEACON Center for the Study of Evolution in Action (DBI-0939454), and a National Defense Science and Engineering Graduate Fellowship to R.M.
Literature Cited
Atwood, K. C., L. K. Schneider, and F. J. Ryan, 1951 Periodic selec-tion inEscherichia coli. Proc. Natl. Acad. Sci. USA 37: 146–155. Barrick, J. E., and R. E. Lenski, 2009 Genome-wide mutational
diversity in an evolving population of Escherichia coli. Cold Spring Harb. Symp. Quant. Biol. 74: 119–129.
Barrick, J. E., and R. E. Lenski, 2013 Genome dynamics during experimental evolution. Nat. Rev. Genet. 14: 827–839. Barrick, J. E., D. S. Yu, S. H. Yoon, H. Jeong, T. K. Oh et al.,
2009 Genome evolution and adaptation in a long-term exper-iment withEscherichia coli. Nature 461: 1243–1247.
Barroso-Batista, J., A. Sousa, M. Lourenço, M.-L. Bergman, J. Demen-geotet al., 2014 Thefirst steps of adaptation ofEscherichia colito the gut are dominated by soft sweeps. PLoS Genet. 10: e1004182. Blount, Z. D., J. E. Barrick, C. J. Davidson, and R. E. Lenski, 2012 Genomic analysis of a key innovation in an experimental
Escherichia colipopulation. Nature 489: 513–518.
Blount, Z. D., C. Z. Borland, and R. E. Lenski, 2008 Historical contingency and the evolution of a key innovation in an exper-imental population ofEscherichia coli. Proc. Natl. Acad. Sci. USA 105: 7899–7906.
Cohan, F. M., 2002 What are bacterial species? Annu. Rev. Micro-biol. 56: 457–487.
Cohan, F. M., 2006 Towards a conceptual and operational union of bacterial systematics, ecology, and evolution. Phil. Trans. R. Soc. B 361: 1985–1996.
Cohan, F. M., and E. B. Perry, 2007 A systematics for discovering the fundamental units of bacterial diversity. Curr. Biol. 17: R373–R386.
Cooper, T. F., D. E. Rozen, and R. E. Lenski, 2003 Parallel changes in gene expression after 20,000 generations of evolution in Es-cherichia coli. Proc. Natl. Acad. Sci. USA 100: 1072–1077. Cooper, V. S., D. Schneider, M. Blot, and R. E. Lenski,
2001 Mechanisms causing rapid and parallel losses of ribose catabolism in evolving populations ofE. coliB. J. Bacteriol. 183: 2834–2841.
Crozat, E., N. Philippe, R. E. Lenski, J. Geiselmann, and D. Schneider, 2005 Long-term experimental evolution inEscherichia coli. XII. DNA topology as a key target of selection. Genetics 169: 523–532. Crozat, E., C. Winkworth, J. Gaffé, P. F. Hallin, M. A. Rileyet al., 2010 Parallel genetic and phenotypic evolution of DNA super-helicity in experimental populations of Escherichia coli. Mol. Biol. Evol. 27: 2113–2128.
Deatherage, D. E., C. C. Traverse, L. N. Wolf, and J. E. Barrick, 2015 Detecting rare structural variation in evolving microbial populations from new sequence junctions using breseq. Front. Genet. 5: 468.
Desai, M. M., and D. S. Fisher, 2007 Beneficial mutation selection balance and the effect of linkage on positive selection. Genetics 176: 1759–1798.
de Visser, J. A. G. M., and R. E. Lenski, 2002 Long-term experi-mental evolution inEscherichia coli. XI. Rejection of non-transitive interactions as cause of declining rate of adaptation. BMC Evol. Biol. 2: 19.
de Visser, J. A. G. M., and D. E. Rozen, 2006 Clonal interference and the periodic selection of new beneficial mutations in Escher-ichia coli. Genetics 172: 2093–2100.
Dykhuizen, D. E., and D. L. Hartl, 1983 Selection in chemostats. Microbiol. Rev. 47: 150–168.
Elena, S. F., and R. E. Lenski, 1997 Long-term experimental evo-lution inEscherichia coli. VII. Mechanisms maintaining genetic variability within populations. Evolution 51: 1058–1067. Ferullo, D. J., D. L. Cooper, H. R. Moore, and S. T. Lovett, 2009 Cell
cycle synchronization of Escherichia coliusing the stringent re-sponse, with fluorescence labeling assays for DNA content and replication. Methods 48: 8–13.
Gerrish, P. J., and R. E. Lenski, 1998 The fate of competing beneficial mutations in an asexual population. Genetica 102/103: 127–144. Hegreness, M., N. Shoresh, D. Hartl, and R. Kishony, 2006 An equivalence principle for the incorporation of favorable muta-tions in asexual populamuta-tions. Science 311: 1615–1617. Herron, M. D., and M. Doebeli, 2013 Parallel evolutionary
dy-namics of adaptive diversification inEscherichia coli. PLoS Biol. 11: e1001490.
Khan, A. I., D. M. Dinh, D. Schneider, R. E. Lenski, and T. F. Cooper, 2011 Negative epistasis between beneficial mutations in an evolving bacterial population. Science 332: 1193–1196. Kimura, M., 1983 The Neutral Theory of Molecular Evolution.
Cam-bridge University Press, New York.
Lang, G. I., D. Botstein, and M. M. Desai, 2011 Genetic variation and the fate of beneficial mutations in asexual populations. Ge-netics 188: 647–661.
Lang, G. I., D. P. Rice, M. J. Hickman, E. Sodergren, G. M. Weinstock
et al., 2013 Pervasive genetic hitchhiking and clonal interfer-ence in forty evolving yeast populations. Nature 500: 571–574. Le Gac, M., J. Plucain, T. Hindré, R. E. Lenski, and D. Schneider,
2012 Ecological and evolutionary dynamics of coexisting line-ages during a long-term experiment withEscherichia coli. Proc. Natl. Acad. Sci. USA 109: 9487–9492.
Lenski, R. E., 2004 Phenotypic and genomic evolution during a 20,000-generation experiment with the bacteriumEscherichia coli. Plant Breed. Rev. 24: 225–265.
Lenski, R. E., and M. Travisano, 1994 Dynamics of adaptation and diversification: a 10,000-generation experiment with bacterial populations. Proc. Natl. Acad. Sci. USA 91: 6808–6814. Lenski, R. E., M. R. Rose, S. C. Simpson, and S. C. Tadler,
1991 Long term experimental evolution inEscherichia coli. I. Adaptation and divergence during 2,000 generations. Am. Nat. 138: 1315–1341.
Lenski, R. E., J. A. Mongold, P. D. Sniegowski, M. Travisano, F. Vasi
et al., 1998 Evolution of competitive fitness in experimental populations of E. coli: What makes one genotype a better com-petitor than another? Antonie van Leeuwenhoek 73: 35–47. Levy, S. F., J. R. Blundell, S. V. Venkataram, D. A. Petrov, D. S.
Fisher et al., 2015 Quantitative evolutionary dynamics using high-resolution lineage tracking. Nature 519: 181–186. Maharjan, R. P., B. Liu, L. Feng, T. Ferenci, and L. Wang, 2015 Simple
phenotypic sweeps hide complex genetic changes in populations. Genome Biol. Evol. 13: 531–544.
Moxon, E. R., P. B. Rainey, M. A. Nowak, and R. E. Lenski, 1994 Adaptive evolution of highly mutable loci in pathogenic bacteria. Curr. Biol. 4: 24–33.
Park, S.-C., and J. Krug, 2013 Rate of adaptation in sexuals and asexuals: a solvable model of the Fisher–Muller effect. Genetics 195: 941–955.
Pelosi, L., L. Kühn, D. Guetta, J. Garin, J. Geiselmannet al., 2006 Parallel changes in global protein profiles during long-term experimental evolution in Escherichia coli. Genetics 173: 1851–1869.
Plucain, J., T. Hindré, M. Le Gac, O. Tenaillon, S. Cruveilleret al., 2014 Epistasis and allele specificity in the emergence of a sta-ble polymorphism inEscherichia coli. Science 343: 1366–1369. Ribeck, N., and R. E. Lenski, 2015 Modeling and quantifying frequency-dependentfitness in microbial populations with cross-feeding in-teractions. Evolution DOI: 10.1111/evo.12645.
Rozen, D. E., and R. E. Lenski, 2000 Long-term experimental evo-lution inEscherichia coli. VIII. Dynamics of a balanced polymor-phism. Am. Nat. 155: 24–35.
Rozen, D. E., N. Philippe, J. A. de Visser, R. E. Lenski, and D. Schneider, 2009 Death and cannibalism in a seasonal environ-ment facilitate bacterial coexistence. Ecol. Lett. 12: 34–44.
Schiffels, S., G. Szöllösi, V. Mustonen, and M. Lässig, 2011 Emergent neutrality in adaptive asexual evolution. Genetics 189: 1361–1375. Schneider, D., E. Duperchy, E. Coursange, R. E. Lenski, and M. Blot, 2000 Long-term experimental evolution inEscherichia coli. IX. Characterization of IS-mediated mutations and rearrangements. Genetics 156: 477–488.
Sniegowski, P. D., P. J. Gerrish, and R. E. Lenski, 1997 Evolution of high mutation rates in experimental populations of E. coli. Nature 387: 703–705.
Studier, F. W., P. Daegelen, R. E. Lenski, S. Maslov, and J. F. Kim, 2009 Understanding the differences between genome sequen-ces of Escherichia coli B strains REL606 and BL21(DE3) and comparison of the E. coli B and K-12 genomes. J. Mol. Biol. 394: 653–680.
Templeton, A. R., 1989 The meaning of species and speciation: a genetic perspective, pp. 3–27 inSpeciation and Its Consequen-ces, edited by D. Otte, and J. A. Endler. Sinauer Associates, Sunderland, MA.
Turner, P. E., V. Souza, and R. E. Lenski, 1996 Tests of ecological mechanisms promoting the stable coexistence of two bacterial genotypes. Ecology 77: 2119–2129.
Wielgoss, S., J. E. Barrick, O. Tenaillon, S. Cruvellier, B. Chane-Woon-Minget al., 2011 Mutation rate inferred from synony-mous substitutions in a long-term evolution experiment with
Escherichia coli. G3 1: 183–186.
Wielgoss, S., J. E. Barrick, O. Tenaillon, M. J. Wiser, W. J. Dittmar
et al., 2013 Mutation rate dynamics in a bacterial population reflect tension between adaptation and genetic load. Proc. Natl. Acad. Sci. USA 110: 222–227.
Wiser, M. J., N. Ribeck, and R. E. Lenski, 2013 Long-term dynam-ics of adaptation in asexual populations. Science 342: 1364– 1367.
Woods, R., D. Schneider, C. L. Winkworth, M. A. Riley, and R. E. Lenski, 2006 Tests of parallel molecular evolution in a long-term experiment withEscherichia coli. Proc. Natl. Acad. Sci. USA 103: 9107–9112.
Woods, R. J., J. E. Barrick, T. F. Cooper, U. Shrestha, M. R. Kauth
et al., 2011 Second-order selection for evolvability in a large
Escherichia colipopulation. Science 331: 1433–1436.
GENETICS
Supporting Information www.genetics.org/lookup/suppl/doi:10.1534/genetics.115.176677/-/DC1
Adaptation, Clonal Interference, and
Frequency-Dependent Interactions in a Long-Term
Evolution Experiment with
Escherichia coli
Rohan Maddamsetti, Richard E. Lenski, and Jeffrey E. Barrick
Figure S1
Figure S2 nagC
that we analyzed. 0.00 0.25 0.50 0.75 1.00
0.00 0.25 0.50 0.75 1.00
Actual frequency
Measured frequency
0.00 0.25 0.50 0.75 1.00
0.00 0.25 0.50 0.75 1.00
Actual frequency
Calib
Figure S4
gltB, rpsA, and yghJ
● ●
●
● ●
●
● ●
● ●
●
●
● ●
●
● ●
● ●
● ●
● ●
● ●
●
● ●
● ●
●
●
●
● ●
●
●
●
● ●
●
● ●
●
● ●
● ●
●
●
● ●
●
● ●
●
●
0.00 0.25 0.50 0.75 1.00
5000 7500 10000 12500
Time (generations)
Frequency
Locus
●
●
●
Table S1
Gene Type Ref.
topA 1329516 SNP C→T H33Y (CAC→TAC) DNA topoisomerase I [1]
fabR 977257 SNP C→A T30N (ACC→AAC) [NA]
spoT 3762741 SNP A→T K662I (AAA→ATA)
pyrophosphate 3’-pyrophosphohydrolase
[1]
pykF 1733101 SNP G→C R46P (CGC→CCC) pyruvate kinase [1]
pykF-3 1733297 NA coding pyruvate kinase [NA]
mrdB 648332 SNP A→T V189E cell wall [2]
pykF-4 1734196 SNP T→G L411R pyruvate kinase [2]
mreB 3328657 SNP G→A P108S cell wall [2]
yegI 2082685 SNP G→A A494V (GCT→GTT) [1]
ybaL 475288 +G coding predicted transporter with NAD(P)-binding Rossmann-fold domain [1]
mrdA 649391 SNP T→A I471F (ATC→TTC)
binding protein 2)
[1]
malT 3483047 SNP C→A R455S (CGC→AGC) [1]
nagC 683496 SNP A→C V65G (GTT→GGT)
N-acetylglucosamine
[1]
infB 3248957 SNP A→T D764E (GAT→GAA) [1]
rpsA 980180 SNP A→G D365G ribosome [2]
gltB 3289962 Δ16 bp coding glutamate synthase, large subunit [1]
yghJ 3045069 SNP G→T T312N (ACC→AAC) predicted inner membrane lipoprotein [1]
rpsM 3370027 SNP T→A K117M (AAG→ATG) 30S ribosomal protein S13 [1]
yedW-yedX
1976879 SNP T→G intergenic (-57/-76) predicted DNA-binding response regulator in two-component [1]
araJ 380188 SNP A→C F239L (TTT→TTG) predicted transporter [1]
3339158 SNP A→C intergenic (+22/-4) tRNA-dihydrouridine synthase B/DNA-binding protein Fis [1]
4126706 Δ1 bp coding [1]
acs-nrfA 4266356 SNP G→C intergenic acetate [2]
atoS 2267833 SNP T→G L364W SCFA [2]
nuoM 2336064 SNP T→G I168L [2]
maeB-talA
2499315 SNP G→A intergenic
(-110/-179)
malic enzyme/transaldolase A [1]
hsdM 4560632 SNP T→C Y131C (TAC→TGC) DNA methylase M [1]
nadR-2 4616396 SNP G→A G290S (GGC→AGC) [1]
nuoG 2342867 SNP T→G Q299P [2]
elaD 2329291 SNP A→T A22A (GCA→GCT) predicted enzyme [1]
leuO-ilvI 88137 SNP A→G intergenic [2]
narI-ychS
1286699 SNP C→A intergenic
(+23/-160)
nitrate reductase 1, gamma (cytochrome b(NR)) subunit/ [1]
dhaM 1248380 SNP A→C D295E (GAT→GAG)
component/EI component
Table S1
Gene Type Ref.
pcnB 161041 SNP T→G N302H (AAC→CAC) poly(A) polymerase I [1]
arcB 3288092 SNP G→A R57C (CGT→TGT)
system with ArcA
[1]
ebgR 3155168 SNP G→A G296S (GGC→AGC) [1]
iclR 4201911 SNP C→T A217T (GCG→ACG) [1]
rspA-ynfA
1632389 SNP T→C intergenic [2]
glpE 3490112 SNP C→T A105T (GCG→ACG) thiosulfate sulfurtransferase [1]
ybjN-potF
910316 SNP T→C intergenic (+176/-175)
predicted oxidoreductase/putrescine transporter subunit: periplasmic-binding component of ABC superfamily
[1]
gltI 668787 SNP A→C Y65D (TAC→GAC) glutamate and aspartate transporter subunit [1]