ABSTRACT
SUBRAMANIAN, SURESHKUMAR V. Measurements and Analysis of the Performance Characteristics of SIP Proxy Servers. (Under the direction of Dr. Rudra Dutta).
Measurements and Analysis of the Performance Characteristics of SIP Proxy Servers
by
Sureshkumar V. Subramanian
A dissertation submitted to the Graduate Faculty of North Carolina State University
in partial fulfillment of the requirements for the Degree of
Doctor of Philosophy
Computer Science
Raleigh, North Carolina
2010
APPROVED BY:
Dr. George N. Rouskas Dr. Khaled Harfoush
Dr. Mihail Sichitiu Dr. Rudra Dutta
DEDICATION
To my parents for their guidance and affection
BIOGRAPHY
ACKNOWLEDGEMENTS
TABLE OF CONTENTS
List of Tables . . . ix
List of Figures . . . x
Chapter 1 Introduction . . . 1
1.1 Area of Interest . . . 1
1.2 SIP Control Plane . . . 4
1.3 Contributions . . . 6
1.4 Structure of the Thesis . . . 8
Chapter 2 PSTN and VoIP Services Context . . . 9
2.1 SS7 and PSTN services Context . . . 9
2.1.1 PSTN Architecture . . . 9
2.1.2 PSTN call setup . . . 10
2.2 SIP and IP Telephony Services Context . . . 11
2.2.1 IP Telephony Services . . . 11
2.2.2 SIP Notations and Terminologies . . . 12
2.2.3 SIP Architecture . . . 14
2.2.4 SIP Session Setup within same domain . . . 17
2.2.5 SIP Security . . . 20
Chapter 3 Related Work . . . 21
Chapter 4 Performance Modeling and Measurements of IPTEL SPS . . . 29
4.1 M/M/1-Network Model Emulation . . . 30
4.2 Hardware and Lab setup . . . 31
4.2.1 Sample UAC and UAS XML code used in SIP-p tool . . . 33
4.3 Experiment procedure . . . 38
4.4 Predictions from M/M/1 network model . . . 39
4.5 Proposed M/D/1 Mathematical Model Formulation . . . 40
4.6 Predictions from M/D/1 models . . . 42
4.7 Comparative study on absolute Performance of the SPS . . . 43
4.8 Concluding Remarks . . . 44
Chapter 5 SPS Software Architecture Study. . . 48
5.1 Address Translation . . . 49
5.2 Next-Hop Routing . . . 50
5.3 IP Resolution . . . 51
5.5 Key SPS Functions . . . 53
Chapter 6 M/M/c Based SPS Model . . . 56
6.1 Contribution . . . 56
6.2 Proposed M/M/cbased SPS Model . . . 57
6.3 Experiment lab setup . . . 60
6.4 Experiment procedure . . . 61
6.5 Predictions of M/M/cmodel . . . 62
6.6 Scalability of M/M/cbased SPS . . . 64
6.6.1 SPS Scalability Result Comparisons . . . 67
6.7 Comparative Study on Absolute Performance of SPS . . . 68
6.8 Overall Comparison of All Three Performance Models . . . 74
6.9 Concluding Remarks . . . 74
Chapter 7 The Effect of Call Holding Time . . . 76
7.1 Empirical Study of Call Hold Time in SPS Performance . . . 77
7.1.1 Results from 1 SPS Test Setup . . . 77
7.1.2 Results from 2 SPS Experimental Lab setup . . . 82
7.1.3 Key findings from the empirical study . . . 82
7.2 Concluding Remarks . . . 87
Chapter 8 SPS Performance Overheads with SIP Security . . . 88
8.1 Motivation . . . 88
8.2 SIP Secured TLS Protocol . . . 89
8.2.1 UDP/TCP-Based Non-Secure SIP Session Setup . . . 93
8.2.2 TLS based Secured SIP session setup . . . 94
8.3 Experiment setup . . . 96
8.4 Experiment procedure . . . 96
8.5 Empirical study of the SPS Performance . . . 98
8.6 Concluding Remarks . . . 104
Chapter 9 Statistical Analysis of Experimental Data Sets . . . 105
9.1 Preliminaries . . . 106
9.2 Summary of Results . . . 108
Chapter 10 Summary and Future Work . . . 111
10.1 Summary of Contributions . . . 112
10.2 Future Work . . . 114
References. . . 115
Appendix A Queuing Model Mathematical Derivations . . . 125
A.1 M/D/1 Mathematical Dervivation . . . 125
A.2 M/M/cMathematical Derivation . . . 126
Appendix B Lab Setup and Configurations . . . 130
B.1 Router Configuration . . . 130
B.2 Network Address Translation Server Configuration . . . 137
B.3 Switches configuration . . . 143
B.4 Lab Hardware Setup . . . 156
B.4.1 SIP Proxy Server Hardware Rack . . . 156
B.4.2 SIP Proxy Server Network Diagram . . . 156
B.4.3 Lab setup with Same domain . . . 156
Appendix C Automation Programs . . . 161
C.1 Tcl/Tk source code . . . 161
C.1.1 Inserting the SIP Phones/Devices . . . 161
C.1.2 Perfmon source code . . . 169
C.1.3 SIP Phone Registration Source Code . . . 212
C.1.4 Place Call Source Code . . . 225
C.1.5 Sample Call setup time Tcl Script . . . 231
Appendix D Statistical Data Definitions . . . 233
D.1 Statistical Details . . . 233
D.2 Interpretation of Linear regression analysis results . . . 237
D.3 Regression Analysis on Data Set 1 . . . 239
D.3.1 Regression Analysis of MNC . . . 239
D.3.2 Regression Analysis of ART . . . 242
D.3.3 Regression Analysis of Server Utilization . . . 244
D.3.4 Regression Analysis of Server Utilization correlates ART . . . . 247
D.4 Regression Analysis on Data Set 2 . . . 250
D.4.1 Regression Analysis of ART . . . 250
D.4.2 Regression Analysis of MNC . . . 254
D.4.3 Regression Analysis of SU . . . 257
D.4.4 Regression Analysis of Server Utilization correlates ART . . . . 259
D.5 Regression Analysis on Data Set 2A . . . 262
D.5.1 Regression Analysis of CST (LAN) with 1 SPS with different CHT264 D.5.2 Regression Analysis of CPU (LAN) with 1 SPS with different CHT . . . 266
D.5.3 Regression Analysis of Memory (LAN) with 1 SPS with different CHT . . . 270
D.5.4 Regression Analysis of CST correlates CPU (LAN) with 1 SPS with different CHT . . . 273
D.6 Regression Analysis on Data Set 3 . . . 278
D.6.1 Regression Analysis of Call setup time (LAN) . . . 278
D.6.2 Regression Analysis of Memory utilization (LAN) . . . 282
D.6.3 Regression Analysis of CPU Utilization (LAN) . . . 285
D.6.4 Regression Analysis of CPU Utilization versus CST (LAN) . . 287
D.6.5 Regression Analysis of Memory utilization versus CST (LAN) . 291 D.7 Regression Analysis on Data Set 4 . . . 294
D.7.1 Regression Analysis of Call setup time for secure vs non-secure 294 D.7.2 Regression Analysis of Memory utilization for secure vs non-secure297 D.7.3 Regression Analysis of CPU Utilization for secure vs non-secure 300 D.7.4 Regression Analysis of CPU Utilization versus CST for secure vs non-secure . . . 303
LIST OF TABLES
Table 4.1 Experimental Data Set 1 results with SER SPS . . . 39
Table 4.2 M/M/1 Performance Model Predicted Results . . . 39
Table 4.3 M/D/1 Performance Model Predicted Results . . . 42
Table 6.1 Experimental Data Set 2 Results . . . 63
Table 6.2 M/M/c Performance Model Predicted Results . . . 64
Table 6.3 Overall Performance Model comparison data . . . 74
LIST OF FIGURES
Figure 2.1 SS7 Basic Call Setup . . . 11
Figure 2.2 IP Services Architecture . . . 13
Figure 2.3 SIP call setup and tear down state diagram . . . 15
Figure 2.4 SIP Signaling . . . 18
Figure 2.5 SIP Call within the same domain . . . 19
Figure 2.6 SIP basic message transaction diagram . . . 19
Figure 4.1 SIP Proxy Server M/M/1 Network Queuing Model . . . 31
Figure 4.2 Experiment Setup and Call Flow diagram . . . 32
Figure 4.3 Proposed SIP Proxy Server M/D/1 Single Queue Model . . . 42
Figure 4.4 M/M/1 andM/D/1 ART versus Data set 1 . . . 44
Figure 4.5 M/M/1 andM/D/1 MNC versus Data Set 1 . . . 45
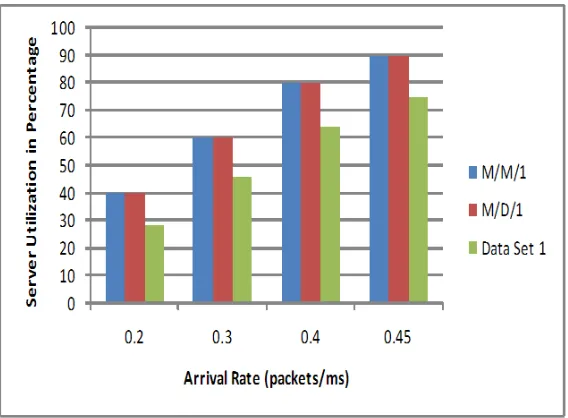
Figure 4.6 M/M/1 andM/D/1 SU versus Data Set 1 . . . 45
Figure 4.7 M/D/1 Network andM/D/1 single queue ART versus Data set 1 . 46 Figure 4.8 M/D/1 Network andM/D/1 single queue MNC versus Data Set 1 46 Figure 5.1 SIP Proxy Server Software Architecture . . . 55
Figure 6.1 SIP Proxy Server M/M/cQueuing Model . . . 59
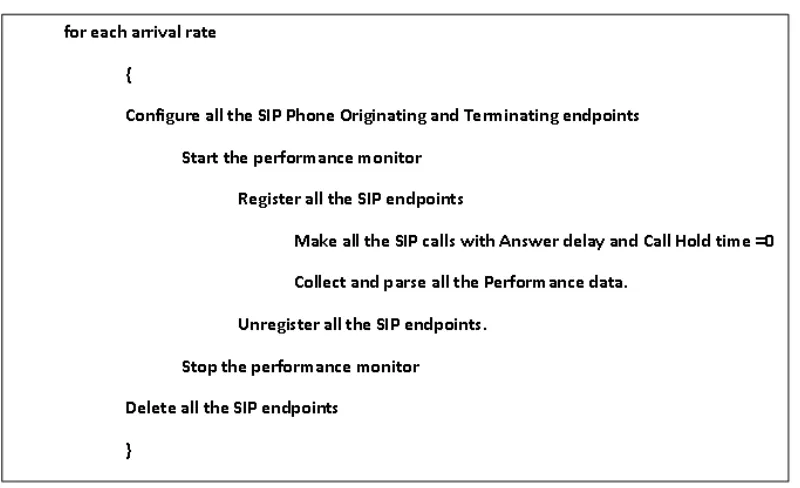
Figure 6.2 Lab Experiment Automation Code Flow Chart . . . 62
Figure 6.3 Experiment Setup and Call Flow diagram . . . 63
Figure 6.4 M/M/cART versus Experimental Data Set 2 . . . 65
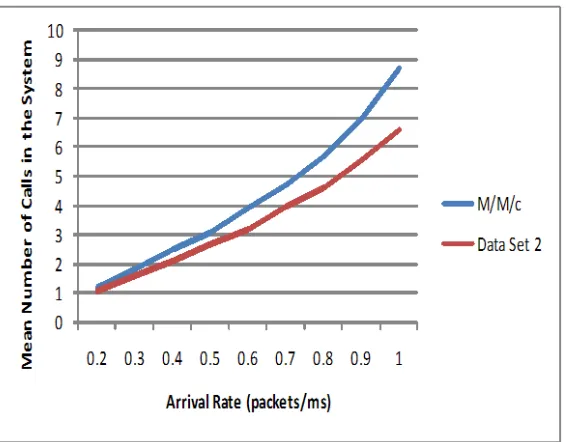
Figure 6.5 M/M/cMNC versus Experimental Data Set 2 . . . 65
Figure 6.6 M/M/cSU versus Experimental Data Set 2 . . . 66
Figure 6.7 CPU Utilization Chart (other 6 cps rates are NOT shown for clarity) 68 Figure 6.8 CPU Utilization 100 CPS Predicted and Experimental comparison . 69 Figure 6.9 CPU Utilization 500 CPS Predicted and Experimental comparison . 69 Figure 6.10 CPU Utilization 1000 CPS Predicted and Experimental comparison 70 Figure 6.11 Memory Utilization Chart . . . 70
Figure 6.12 M/M/1 andM/M/c ART versus Data Set 2 . . . 72
Figure 6.13 M/M/1 andM/M/c MNC versus Data Set 2 . . . 73
Figure 6.14 M/M/1 andM/M/c SU versus Data Set 2 . . . 73
Figure 7.1 Call Setup time for different CHT with 1 SPS . . . 78
Figure 7.2 Mean Call Setup time for different CHT with 1 SPS . . . 78
Figure 7.3 CPU Utilization for different CHT with 1 SPS . . . 79
Figure 7.4 Mean CPU Utilization for different CHT with 1 SPS . . . 79
Figure 7.5 Memory Utilization for different CHT with 1 SPS . . . 80
Figure 7.7 Call Blocking Chart for different CHT . . . 81
Figure 7.8 Call Blocking Chart for different CHT . . . 81
Figure 7.9 Mean Call Blocking Chart for 300s CHT . . . 82
Figure 7.10 Call Setup time for different CHT with 2 SPS . . . 83
Figure 7.11 Mean Call Setup time for different CHT with 2 SPS . . . 83
Figure 7.12 CPU Utilization for different CHT with Orig. SPS . . . 84
Figure 7.13 Mean CPU Utilization for different CHT with Orig. SPS . . . 84
Figure 7.14 CPU Utilization for different CHT with Term. SPS . . . 85
Figure 7.15 Mean CPU Utilization for different CHT with Term. SPS . . . 86
Figure 7.16 Memory Utilization for different CHT with Orig. SPS . . . 86
Figure 7.17 Mean Memory Utilization for different CHT with Orig. SPS . . . . 87
Figure 8.1 Non-Secure SIP Message Transactions Diagram . . . 94
Figure 8.2 Secured SIP Message Transactions Diagram . . . 95
Figure 8.3 Experiment Setup . . . 97
Figure 8.4 Non-Secure and Secure SIP Calls Setup Time . . . 99
Figure 8.5 Non-Secure and Secure SIP Mean Calls Setup Time . . . 100
Figure 8.6 Non-Secure and Secure Orig. SPS Server CPU Utilization . . . 100
Figure 8.7 Non-Secure and Secure Orig. SPS Server Mean CPU Utilization . . 101
Figure 8.8 Non-Secure and Secure Term. SPS Server CPU Utilization . . . 101
Figure 8.9 Non-Secure and Secure Term. SPS Server Mean CPU Utilization . 102 Figure 8.10 Non-Secure and Secure Orig. SPS Server Memory Utilization . . . . 102
Figure 8.11 Non-Secure and Secure Orig. SPS Server Mean Memory Utilization 103 Figure 8.12 Non-Secure and Secure Term. SPS Server Memory Utilization . . . 103
Figure 8.13 Non-Secure and Secure Term. SPS Server Mean Memory Utilization 104 Figure B.1 SIP Proxy Server Lab Hardware Rack with SIP-P . . . 157
Figure B.2 SIP Proxy Server Lab Hardware Rack . . . 158
Figure B.3 SIP Proxy Server Network setup . . . 159
Figure B.4 Experiment Setup . . . 160
Figure D.1 Data Set 1 ART Line Fit Plot . . . 241
Figure D.2 Data Set 1 ART Residual Plot . . . 242
Figure D.3 Data Set 1 MNC Line Fit Plot . . . 244
Figure D.4 Data Set 1 MNC Residual Plot . . . 245
Figure D.5 Data Set 1 SU Line Fit Plot . . . 247
Figure D.6 Data Set 1 SU Residual Plot . . . 248
Figure D.7 Data Set 1 SU Line Fit Plot . . . 250
Figure D.8 Data Set 1 SU Residual Plot . . . 251
Figure D.9 Data Set 2 ART Line Fit Plot . . . 253
Figure D.10 Data Set 2 ART Residual Plot . . . 254
Figure D.12 Data Set 2 MNC Residual Plot . . . 257
Figure D.13 Data Set 2 SU Line Fit Plot . . . 260
Figure D.14 Data Set 2 SU Residual Plot . . . 260
Figure D.15 Data Set 2 SU Line Fit Plot . . . 263
Figure D.16 Data Set 2 SU Residual Plot . . . 263
Figure D.17 Data Set 2 CST Line Fit Plot . . . 266
Figure D.18 Data Set 2 CST Residual Plot . . . 267
Figure D.19 Data Set 2 CPU Line Fit Plot . . . 269
Figure D.20 Data Set 2 CPU Residual Plot . . . 269
Figure D.21 Data Set 2 MU Line Fit Plot . . . 272
Figure D.22 Data Set 2 MU Residual Plot . . . 272
Figure D.23 Data Set 2 CPU CST Line Fit Plot . . . 275
Figure D.24 Data Set 2 CPU CST Residual Plot . . . 275
Figure D.25 Data Set 2 MU CST Line Fit Plot . . . 278
Figure D.26 Data Set 2 MU CST Residual Plot . . . 279
Figure D.27 Data Set 3 Call Setup Time LAN Fit Plot . . . 281
Figure D.28 Data Set 3 Call Setup Time Residual Plot . . . 281
Figure D.29 Data Set 3 Memory Utilization LAN Fit Plot . . . 284
Figure D.30 Data Set 3 Memory Utilization Residual Plot . . . 284
Figure D.31 Data Set 3 CPU Utilization LAN Fit Plot . . . 287
Figure D.32 Data Set 3 CPU Utilization Residual Plot . . . 288
Figure D.33 Data Set 3 CPU Utilization LAN Fit Plot . . . 290
Figure D.34 Data Set 3 CPU Utilization Residual Plot . . . 290
Figure D.35 Data Set 3 Memory Utilization LAN Fit Plot . . . 292
Figure D.36 Data Set 3 Memory Utilization Residual Plot . . . 293
Figure D.37 Data Set 4 Call Setup Time LAN Fit Plot . . . 296
Figure D.38 Data Set 4 Call Setup Time Residual Plot . . . 296
Figure D.39 Data Set 4 Memory Utilization LAN Fit Plot . . . 299
Figure D.40 Data Set 4 Memory Utilization Residual Plot . . . 300
Figure D.41 Data Set 4 CPU Utilization LAN Fit Plot . . . 302
Figure D.42 Data Set 4 CPU Utilization Residual Plot . . . 303
Figure D.43 Data Set 4 CST CPU Utilization LAN Fit Plot . . . 305
Figure D.44 Data Set 4 CST CPU Utilization Residual Plot . . . 306
Figure D.45 Data Set 4 CST Memory Utilization LAN Fit Plot . . . 308
Chapter 1
Introduction
1.1
Area of Interest
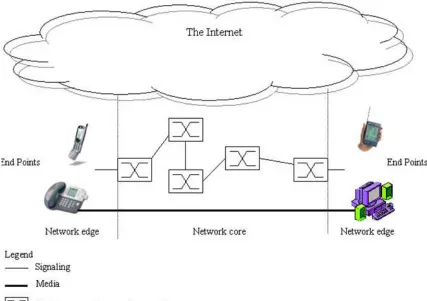
As the Internet has evolved over the decades, it has taken on a steadily increasing set of roles and functions that now make it an indispensable part of our daily lives. The transmittal of digitized voice data in real-time is one of the more recent attempts at providing a new class of services over the Internet, in effect using the Internet to serve as a network for connecting telephone-like devices. While the user of such a service would reasonably compare their service experience with the experience they receive from the traditional telephone service, the underlying network and technology are very different for the two cases, which has prompted study of this newly emerging area to understand the performance that might be expected of such service.
to transport the voice circuits. The Internet uses simple routers to receive datagrams or packets, forwards the packets to the next router and so on until the packets reach the in-tended destinations. The complexity, or computing power, of the Internet is concentrated on the edges of the network, in elements such as powerful desktop, laptop computers, cell phones and other digital hand held devices [24].
User experience for audio and video services depend on underlying metrics like latency, packet loss and jitter. The Internet evolved from network architectures in which connectivity was far more important than consistent performance, and the Internet of today consequently exhibits performance that is statistically rather than deterministically predictable. This is in sharp distinction to the case of (PSTN), where a telephone call cannot be set up unless the bandwidth to carry the call can be reserved in the network. Setting up the call entails both routing the call, and reserving bandwidth along the route. Once reserved, such bandwidth remains dedicated to the call until the users hang up. Accordingly, the latency of voice signals is small and constant, and the user experience of the call is very high for calls that are established, but some calls will be blocked when the network runs out of resources. To minimize the incidence of blocking, the network must be designed with a large amount of bandwidth and switching resources. Carrying a call in the PSTN network is therefore expensive.
network at ingress points. At this time, voice traffic account for a comparatively small part of Internet traffic, and the Internet is provisioned with a large amount of bandwidth. Carrying calls is thus cheap, and no call is blocked from entering the network because of bandwidth running out, but the user experience of the established call can be low when the network experiences congestion, including completely dropping the call.
service providers to build scalable, reliable Voice over IP networks today and it provides a full array of call routing capabilities to maximize network performance in both small and large packet voice networks. The SIP proxy server can perform a digest authentication of SIP Register, invite requests, and can encrypt SIP requests and responses using Transport Layer Security (TLS). For secure communication, user authentication, confidentiality and integrity of signaling message and SIP session establishment are essential. TLS is used for the secured SIP signaling and Secure Real Time Protocol (SRTP) for secured SIP session establishment.
1.2
SIP Control Plane
resides here. PSTN provided several services with the help of a well-known service layer called Advanced Intelligent Networks (AIN) [36].
In IP telephony, these functions are taken over by SIP; SIP effectively forms the signaling plane for Voice over IP. However, so far the literature has not actively studied the operation of SIP itself from a performance point of view. In part, this may be a holdover from the PSTN mindset - that the network performance is determined by the data plane (where bandwidth limitations cause calls to be blocked), whereas the control plane only imposes a small initial delay in setting up calls (and does not block calls). However, in fact the SIP system largely resides in the SPS, which is essentially a special purpose computer. Several Internet telephony events such as initialization of a call (making a VoIP call), arrival of call, parsing the headers, location updates such as location registration and de-registration in case of cellular networks, routing the call are the performance characteristics that needs to be studied. These key functions are designed and implemented in the SPS software. Unlike the PSTN control plane, it is possible to have a situation in which the bandwidth to carry a call exists in the data plane, but the call establishment is delayed by a significant time, or completely fails, due to slow performance by the SPS. This is exacerbated by the fact that calls do not really fail for lack of data plane bandwidth in IP telephony, as discussed above. It is thus important to study the performance of SIP in general and the SPS in particular, but so far both academia and industry have neglected this area. Little or no current research addresses problems in characterizing the performance of the SIP proxy server with the latest technological advancement in server architectures. This is the focus of our thesis.
and strongly bounded in PSTN networks, but is likely to show much more variation for SIP based systems, as the SPS becomes more heavily loaded.
1.3
Contributions
The key contributions of our research are five-fold and are as follows:
• First, we examined the M/M/1 queuing network model proposed in [25], obtained the analytical predictions and compared them with experiments performed on a real SIP proxy server. We reported the results here, which shows that the model does not have sufficient predictive value. Then, we attempted to use an M/D/1 queuing network model based on our understanding of the internals of the SIP proxy server software. Based on our data, we eventually proposed a simpler alternative analytical model using a small number of queues, which nevertheless predicted the proxy server performance well.
• Second, in the course of this work, we became aware that the typical software real-ization of the SIP proxy server was undergoing a change. In keeping with the current trends in SIP proxy server architecture, we eventually proposed a surprisingly simple SIP proxy server model based on a single M/M/c queue, motivated by our under-standing of the software system that realizes SIP proxy servers in practice. Analytical and experimental study of our proposed model indicates to have good predictive value regardless of its simplicity.
such as average response time, mean number of calls in the system, memory and cpu utilization.
• Fourth, to understand better on the impact of the SIP proxy server performance and scale when different CHTs are used during the experiments, we did an empirical study with different CHT values, derived inferences that the impact is significant and deserve further detailed investigation. Based on the established M/M/c based proxy server model, we expanded our research to study the performance and scalability of the proxy server using a IETF standard trapezoidal SIP network with two proxy servers, when SIP calls are made through local and wide area networks. We conducted a comparative study, and found that the predicted and experimental results are inline.
• Finally, in the fifth part of our research, with an establishedM/M/cbased proxy server model, we studied the performance impacts on the proxy server when secured and non-secured transport protocols are used to transport the SIP packets when the SIP calls are made. During this work, we compared the performance of User Datagram Protocol (UDP), Transmission Control Protocol (TCP) as non-secured transport protocols, TLS-authentication and TLS-encryption as part of secured transport protocols in a SIP network configured in a LAN environment.
in the actual lab environment. In all of our studies, we gathered actual experimental data by setting up actual SIP proxy systems and emulated IP phones in the lab. We see this as one of our major contributions. It may allow simpler simulation models of SIP proxy to be used by later researchers.
Our work focuses on the performance of the proxy server rather than the network con-necting it. Initially, we considered only a single proxy server processing the entire incoming SIP calls generated from a population of SIP endpoints, and assumed no delay due to proxy servers located at distant locations. Later we studied the SIP proxy server performance with the current IETF recommended standard trapezoidal SIP architecture with two-proxy server model.
1.4
Structure of the Thesis
Chapter 2
PSTN and VoIP Services Context
2.1
SS7 and PSTN services Context
2.1.1 PSTN Architecture
hardware and managed by various software modules. These switches are the brain of the PSTN network. Normally, there are several central offices within a metropolitan area. There are two widely used call types: 1. Local calls, where the called party is within the geographic area of the central office, and 2. Long distance or tandem calls, where the called party is outside the geographic area, in which case the traffic goes to one or more toll/tandem offices, each of which contains a tandem switch. To connect and send/receive traffic between the central offices and the tandem switches, trunks are used. The main function of SS7 is to route, over a packet-based network, the signaling messages with media streams between the switches. The traditional telephone network has deployed advanced services to telephone subscribers since the introduction of digital telecommunications switches. In the 1980s, the International Telegraph and Telephone Consultative Committee (CCITT) standardized IN services in Q.1201 [27]. PSTN subscribers throughout the world are overwhelmed by advanced services like call forwarding, call waiting, voice mail, speed dial, call return, and other user location services. The ITU-U standard defines IN as a conceptual model, a “Framework for the design and description of the IN architecture.”
2.1.2 PSTN call setup
Figure 2.1: SS7 Basic Call Setup
then Central Office-B builds and sends a Release Message (REL) to the originating Central Office-A. Finally, the originating Central Office-A acknowledges the REL with a Release Complete Message (RLC) and sends it to the destination Central Office-B [40], [36].
2.2
SIP and IP Telephony Services Context
2.2.1 IP Telephony Services
intermediate components for the entire duration of the call. In IP telephony, the signaling messages are routed through the core intermediate components until the session is estab-lished, and then the media streams flow directly between the endpoints. Unlike PSTN, in IP telephony there is no platform for the centralized execution of service. In reality, the end-point devices used in IP telephony, such as Personal Computers (PC), laptops, cell phones, and Personal Digital Assistants (PDA), are more powerful than PSTN endpoints, such as a simple telephone. In PSTN, the services reside at the core of the network (IN entities), whereas IP-telephony services reside at the endpoints, as shown inFigure 2.2. The core of the Internet is simple and performs only routing services. Due to the lack of centralized service control points, Internet endpoints can host and perform many IP-telephony services, in theory. In reality, deploying IP-telephony service at the endpoint yields mixed results. There is some research in this area [9, 10]. SIP and H.323 IP-signaling protocols provide service specifications for IP telephony on top of their signaling functions, such as call setup, media stream modification, and call termination. Services in IP telephony are created by SIP Common Gateway Interface (CGI) [38], Call Processing Language (CPL) [39], or SIP servlets [57].
2.2.2 SIP Notations and Terminologies
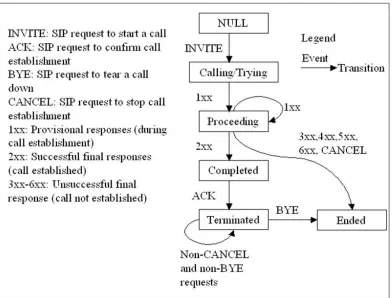
devices, such as PCs, PDAs, and cell phones, that are used to create and manage SIP sessions. An SIP Registrar server is a network server which accepts, stores, and serves registration requests and may interface with location services such as Lightweight Directory Access Protocol (LDAP), Common Object Request Broker Architecture (CORBA), and Open Database Connectivity (ODBC) database servers [31]. SIP addresses are called Uni-form Resource Identifiers (URI). URIs are of the Uni-format user@host or E164 number@host. URIs do not directly refer to the transport address but are abstract entities that can reach the user either directly or indirectly [47]. The INVITE request sets up the call, while the BYE request terminates the call. The REGISTER request registers the endpoints with the SIP registrar server. The UPDATE request updates the original invitation (i.e., INVITE request), and the ACK message represents reliability and call acceptance. The OPTIONS message is used for querying participants about their media capabilities. The CANCEL message is used to terminate the INVITE request. There are six different responses in SIP, as shown in Figure 2.3.
• 1xx responses are informational responses, also known as provisional responses (100 Trying, 180 Ringing, 183 Session in progress).
• 2xx responses are successful final responses (200 OK, 202 Accepted)
• 3xx responses are re-directional responses (301 Temporarily moved, 302 Permanently moved).
• 5xx responses are server failure responses (500 Server error).
• 6xx responses are global failure responses (604 Not found anywhere) [37]. 2.2.3 SIP Architecture
• SIP User Agents (UA)
SIP user agents (UA) are the end-user devices, such as PCs, PDAs, and cell phones, that are used to create and manage SIP sessions. The User Agent Client (UAC) sends SIP requests. The User Agent Server (UAS) listens to SIP requests and sends responses back to other UACs. A Back-to-Back User Agent (B2BUA) is the concate-nation of a UAC and UAS.
• SIP Registrar Server
An SIP Registrar server is a network server that accepts, stores, and serves registration requests and may interface with location services, such as LDAP, CORBA, and ODBC database servers.
• SIP Proxy Server
IP. Users in a SIP network are identified by unique SIP addresses. An SIP address, of similar form to an e-mail address, is in the form sip:[email protected] [47]. The user ID can be either a username or an E.164 address. Users register with a registrar or SIP proxy server using their assigned SIP addresses. The registrar server provides this information to the location server upon request. A user initiates a session by sending an SIP request to an SIP server (either an SIP proxy server or a redirect server). The Request URI includes the Address of Record (AOR) of the called party.
• SIP Redirect Server
An SIP redirect server allows the SIP proxy server to direct SIP requests to external domains. SIP proxy servers and SIP redirect servers can reside in the same hard-ware [24].
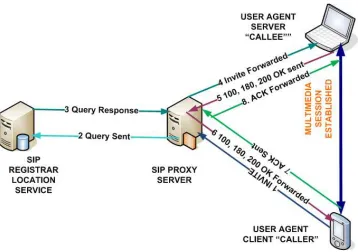
SIP Generic Call model: A UAC can directly contact a UAS if the location of the UAS is known and does not require any special services from the network. However, a UAC typically initiates a call through a proxy server, relying on the proxy server to locate the desired UAS and to obtain any special services from the network. The SIP messaging path from UAC to UAS can involve multiple proxy servers, and, in such scenarios, SIP proxy servers (SPS) interface as peers with other proxy servers. SIP requests can be sent with any reliable or unreliable protocol. SIP proxy servers support the use of the User Datagram Protocol (UDP), Transmission Control Protocol (TCP), and Transport Layer Security (TLS) for sending and receiving SIP requests and responses [47]. The media stream established between two SIP endpoints is depicted in Figure 2.4.
2.2.4 SIP Session Setup within same domain
Figure 2.4: SIP Signaling
Figure 2.5: SIP Call within the same domain
2.2.5 SIP Security
Chapter 3
Related Work
The highly successful SS7 signaling system that forms the basis of classical PSTN has been the subject of much study by both academia and telecommunication industries. Authors in [59] studied the performance analysis of link sets on the CCS7 network based on SS7 signaling with complete derivation on the analytical queuing and delay models. Several performance models based on SS7 traffic load matrix and traffic characteristics, network configuration and network protocols [35]. Same paper addresses the reliability for SS7 networks based on availability, dependability and robustness. In [11], the team calculated the mean end-to-end delay of Common Channel Signaling Networks [CCSN] and used call arrival rate and failure rates. Total response time, network transmission time, and SCP processing are the key performance parameters considered by the work done in [7].
related studies in the literature do not attempt any experimentation or even simulation to validate the theoretical models and qualitative intuition they present. Others attempt simulation but ignore the control plane. Below we present a brief discussion of some of the pertinent literature.
Wu et al. [61] presented the performance modeling, analysis and simulation of SIP-T (Session Initiation Protocol for Telephones) signaling system in carrier class Voice over IP (VoIP) network. Authors used queuing theory and derived the analytical model for throughput efficiency. The SIP-T signaling system defined in Internet Engineering Task Force (IETF) draft is a mechanism that uses Session Initiation Protocol (SIP) to facilitate the interconnection of PSTN with carrier class VoIP network. SIP-T is a scalable, flexible and also interpretable signaling protocol with PSTN and also provides call control function of the Media Gateway Controller (MGC) to setup, tear down and manage VoIP calls in the carrier class VoIP network. The authors analyzed the appropriate queuing size and came up with the mathematical model for finding the queuing delay, and the variance of queuing delay of SIP-T signaling system that are the major evaluation parameters for improving Quality of Service (QoS) and the system parameters of MGC in carrier class VoIP network. The theoretical model is based on the M/G/1 queuing model, i.e. they assumed Poisson distribution for the arrival process of the SIP-T messages and general service time of the SIP-T message. They also used M/M/1 queuing model to observe the number of SIP-T messages in the system. They came up with the derivation for the queuing size using the embedded Markov chain and semi Markov chain. Authors also compared their theoretical performance model with the actual results to show its very consistencies.
M = (1−a)(r 2h2
0+ 2rh0) + (r3h0h21) 2(1−a)(rh0+ 1−a)
(3.1)
where k= 1,2,3, ...N, r = 0,1,2.,
h1 is the mean service time of the SIP-T message, h0 is the mean service time of the fill-in message when k=1 and r = 0. a=rh1 is the mean traffic intensity of the SIP-T message. In equation 3.1, the observation time is a constraint to the departure instant of a message.
Using the arbitrary instant of a message and the semi Markov chain, the average number of SIP-T messages N in the system is derived as:
N =a+rh0 2 +
r2h21
2(1−a) (3.2)
Most of the research in IMS/VoIP related to SIP is focused on engineering principles, protocol definitions, enhancement and other improvements. Very little research work is done in the area of performance modeling of SIP proxy servers. Recently, lot of IP telephony industries are focusing on various SIP and SIP proxy server performance metrics [41].
Schulzrinne et al. [48] approximately dimensioned the SIP-based IP telephony systems and found that the SIP registration rate can reach thousands of requests per second. They proposed an initial simple set of performance benchmarks for SIP proxy, Redirect and Registrar servers. This research builds in part on SIPstone to provide analytical and real world solution for the better understanding of SIP proxy server performance.
real time SIP traffic. They analyzed the IMS performance as an end-to-end delay point of view. They defined a utility function in their model for the IMS network to optimize the service rate. They assumed the mean service rate to be greater than or equal to mean arrival rate to model the fast connection setups. The utility function of an IMS network is modeled asU =V(λ)−C−P whereU is the utility,V(λ) is the revenue earned by serving λconnections. C is the cost compensation for maintainingK servers in the network andP is the penalty function representing revenue losses due to lost connections.
The optimal utility function is:
ˆ
U=maxρ[V−K(aρ−bρ2)−βT− KT
ρ−λ] (3.3)
Bozinovski et al. [8] presented a performance evaluation of a novel state-sharing algo-rithm for providing reliable SIP services. SIPs built in state machines state information being used instead of transport protocol states. The state-sharing algorithm saves and re-trieves the SIP state information using queues. Failure detection mechanism uses the SIP retransmission timers to determine the actual failure of calls. The fail over mechanism defines the primary proxy and backup proxies and dynamically changing the destination proxy information using the round robin algorithm. The authors considered server failure and repair time distributions, call arrival and call duration distributions are their most important performance parameters.
establishment. They came up with the SIP call setup delay over 3G networks and also did a comparison with Internet LAN results.
Fathi et al. [20] focused on SIP protocol and evaluated its session setup delay with various underlying transport protocols [TCP, UDP, Radio Link Protocol(RLP)] as a function of FER. They defined the Call setup delay as the message can travel between the UAC and UAS. Provisional responses such as 100 trying and 180 ringing messages are not part of the delay. They did not consider the processing delays and queuing delays through different proxy servers. They also came up with the following results: For a 9.6 Kbps channel, the SIP session setup time can be up to 84.5 seconds with UDP and 105 seconds with TCP when the FER is up to 10 percent. The use of RLP puts the session setup time to 2.4 seconds under UDP and 3.5 seconds under TCP for the same FER and the same channel bandwidth.
Towsley et al. [58] developed an inference models based on the finite capacity single server queues for estimating the buffer size and also studied about the intensity of the traffic. There came up with the mathematical derivation for their model to find out the server utilization.
U =ρ(1−PL) (3.4)
where Loss Probability
PL=
(1−ρ)ρk
1−ρk+1 (3.5)
where k represents number of customers in the queue. Average Response time:
R= 1
µ(1−ρ) −( k µ)(
ρk
1−ρk) (3.6)
where traffic intensityρ = λµ and λ, µ represents arrival and service rates.
variable) in the system at study state is given by: N = J X k=1 ρk
(1−ρk)
(3.7)
where
ρk=
λk
µk
, λ1 =λ, λj = j−1
X
k=1
(λkQ[k, j]) (3.8)
for 1< j ≤J and J=6 is the number of stations in the queuing model. Qis the one step probability matrix corresponding to the queuing model, that is,Q[i, j] the probability that a job departing station igoes to station j. The mean response time for calls is by Little’s law R= Nλ. The authors assumed the service rate is fixed at 0.5ms−1 and the arrival rate at 0.3ms−1.
Guillet et al. [22] proposed a mutual authentication mechanism and also discussed sev-eral possible security attacks on SIP endpoints and SIP proxy server. They proposed a mutual authentication mechanism within HTTP Digest, provides meaning and semantic to some of the parameters values generated by the participating end-points during SIP session establishment, particularly the nonce values. They claimed that their approach helps in reducing DoS (Denial of Service) attacks, detects server identity spoofing and ensures basic mutual authentication with comparison to HTTP digest.
Yonik et al. [63] studied the SIP proxy server performance and authentication cost for four different SIP proxy server software. SIP proxy server is based on several factors such as SIP stack parsing, processing time and queuing time, they compared the performance of four different well-known SIP proxy server software.
Kim et al. [33] analyzed and implemented security protocols for SIP based VoIP and studied the performance of their security protocol implementation. Their implementation is partly based on TLS. Implemented new security mechanism to protect the SIP signaling and RTP session. Applied their implementation to VoIP hardware such as SIP phones, SIP proxy and evaluated the performance about call setup delay and voice quality.
Ram et al. [46] found while comparing the performance of the OpenSER SIP proxy server software [30] on UDP versus TCP, and concluded the software implementation causing the TCP to perform poorly. They found principal reason for the poor performance of TCP is architecture of the SIP proxy server that supports connection-less protocol such as UDP than a connection-oriented protocol such as TCP. They also addressed the issue with the software and proved the performance of TCP is better than before.
Chapter 4
Performance Modeling and
Measurements of IPTEL SPS
the [25] model and then proposed an alternative analytical model with M/D/1 queues.
4.1
M/M/
1
-Network Model Emulation
To assess the usefulness of the queuing model proposed by Gurbani et al. [25], first we studied this model to validate their results with our new analytical and experimental results (the authors of [25] only provided the analytical model and its consequences but did not provide a comparison with real, emulated, or simulated performance data). In this work, the SIP proxy server is modeled as open feed-forward queuing network as shown inFigure 4.1, in which incoming INVITE messages from UAC pass through a sequence of 6M/M/1 based queuing stations that corresponds to each SIP message as shown in Figure 2.6. All the incoming SIP packets are processed by executing the same SIP proxy server software module for each session to establish and tear down. To validate the analytical solution, several sets of experiments were conducted with the real SIP proxy server that is built with the SPS software, collected the data and compared that with the analytical results. SIP proxy server model and assumptions of [25] were;
• Service time 1/µis the mean service time to process the INVITE request at the SIP proxy server and that service rate is fixed at 0.5ms−1.
• Since UAS does not parse the SIP packets, the computation will be less, hence the service times are assumed as 0.7/µ for sending the 180 followed by 200 with 0.3/µor non 200 response with 0.5/µ. Analytical and experimental results are shown inTables 4.1, 4.2 andFigures 4.7, 4.8 and 4.9.
Figure 4.1: SIP Proxy Server M/M/1 Network Queuing Model
will receive a non-200 response.
4.2
Hardware and Lab setup
Figure 4.2: Experiment Setup and Call Flow diagram
various network elements such as User Agent Client (UAC) and other tools. SPS is loaded with SIP Express Router (SER) version 0.8.14 software [30], because SIP Express Router (SER) has high-performance, and easily configurable. SIP-P tool [29] on the server side with the listening port set to 5060 is started first during the test. Then another instance of SIP-p tool started from the UAC side which can make SIP calls with different call rates. For heavier traffic, we replaced SIP-p tool instances with JMeter traffic generator tool [5] to generate SIP calls from UAC. Performance Monitor (Perfmon) tool [14] was used from another HP 7825H2 server to monitor the traffic to and from the SIP proxy server. SIP proxy server software that can process the SIP messages are instrumented usingPerfmon
4.2.1 Sample UAC and UAS XML code used in SIP-p tool
<?xml version="1.0" encoding="ISO-8859-1" ?> <!DOCTYPE scenario SYSTEM "sipp.dtd">
<scenario name="Basic Sipstone UAC"> <send retrans="500">
<![CDATA[
INVITE sip:[service]@[remote_ip]:[remote_port] SIP/2.0
Via: SIP/2.0/[transport] [local_ip]:[local_port];branch=[branch] From: sipp <sip:sipp@[local_ip]:[local_port]>;tag=[call_number] To: sut <sip:[service]@[remote_ip]:[remote_port]>
Call-ID: [call_id] CSeq: 1 INVITE
Contact: sip:sipp@[local_ip]:[local_port] Max-Forwards: 70
Subject: Performance Test Content-Type: application/sdp Content-Length: [len]
v=0
o=user1 53655765 2353687637 IN IP[local_ip_type] [local_ip]
s=-c=IN IP[media_ip_type] [media_ip] t=0 0
a=rtpmap:0 PCMU/8000 ]]>
</send>
<recv response="100" optional="true"> </recv>
<recv response="180" optional="true"> </recv>
<recv response="200" rtd="true"> </recv>
<send>
<![CDATA[
ACK sip:[service]@[remote_ip]:[remote_port] SIP/2.0
Via: SIP/2.0/[transport] [local_ip]:[local_port];branch=[branch] From: sipp <sip:sipp@[local_ip]:[local_port]>;tag=[call_number] To: sut <sip:[service]@[remote_ip]:[remote_port]>[peer_tag_param] Call-ID: [call_id]
CSeq: 1 ACK
Contact: sip:sipp@[local_ip]:[local_port] Max-Forwards: 70
Content-Length: 0 ]]>
</send> <pause/>
BYE sip:[service]@[remote_ip]:[remote_port] SIP/2.0
Via: SIP/2.0/[transport] [local_ip]:[local_port];branch=[branch] From: sipp <sip:sipp@[local_ip]:[local_port]>;tag=[call_number] To: sut <sip:[service]@[remote_ip]:[remote_port]>[peer_tag_param] Call-ID: [call_id]
CSeq: 2 BYE
Contact: sip:sipp@[local_ip]:[local_port] Max-Forwards: 70
Subject: Performance Test Content-Length: 0
]]> </send>
<recv response="200" crlf="true"> </recv>
</scenario>
<?xml version="1.0" encoding="ISO-8859-1" ?> <!DOCTYPE scenario SYSTEM "sipp.dtd">
<recv request="INVITE" crlf="true"> </recv>
<send>
<![CDATA[
SIP/2.0 180 Ringing [last_Via:] [last_From:]
[last_To:];tag=[call_number] [last_Call-ID:]
[last_CSeq:]
Contact: <sip:[local_ip]:[local_port];transport=[transport]> Content-Length: 0
]]> </send>
<send retrans="500"> <![CDATA[
SIP/2.0 200 OK [last_Via:] [last_From:]
[last_To:];tag=[call_number] [last_Call-ID:]
Contact: <sip:[local_ip]:[local_port];transport=[transport]> Content-Type: application/sdp
Content-Length: [len] v=0
o=user1 53655765 2353687637 IN IP[local_ip_type] [local_ip]
s=-c=IN IP[media_ip_type] [media_ip] t=0 0
m=audio [media_port] RTP/AVP 0 a=rtpmap:0 PCMU/8000
]]> </send>
<recv request="ACK" optional="true" rtd="true" crlf="true"> </recv>
<recv request="BYE"> </recv>
<send>
<![CDATA[
[last_To:] [last_Call-ID:] [last_CSeq:]
Contact: <sip:[local_ip]:[local_port];transport=[transport]> Content-Length: 0
]]> </send>
</scenario>
4.3
Experiment procedure
Table 4.1: Experimental Data Set 1 results with SER SPS λ(calls/s) 200 300 400 450
L 0.82 1.49 3.28 5.68 W in ms 5.8 7.24 9.98 13.47 ρ in percent 28 46 64 75
Table 4.2: M/M/1 Performance Model Predicted Results λ(calls/s) 200 300 400 450
L 1.31 2.69 5.88 11.33 W in ms 7.63 9.86 15.87 26.47 ρ in percent 40 60 80 89
accuracy of the statistical data collected by theperfmontool. Refer toTable 4.1andFigure 4.7, 4.8 and 4.9 for the experimentalData Set 1 results. We verified the results collected using SIP-p and JMeter tool were identical for the same call rate.
4.4
Predictions from
M/M/
1
network model
4.5
Proposed
M/D/
1
Mathematical Model Formulation
Based on the experimental results we obtained during theM/M/1 SIP proxy server model, we observed that the effort required by the SIP proxy server to process all the SIP requests and responses are almost identical, since the length of the SIP packet for requests and responses to setup a SIP call is a constant. We proposed a new M/D/1 based SIP proxy server model with the arrival rateλand a constant service timeµfor all the SIP request and response messages. Using standard approaches, arrival times are exponentially distributed, service time have no variance and the average queue length is exactly half ofM/M/1 for a M/D/1 queuing model. Figure 4.5 represents the newly proposed SIP proxy server model based onM/D/1 queuing model. Our proposedM/D/1-Network model is exactly the same as the queueing network proposed by Gurbani et al, except that each queue is replaced by an M/D/1 queue. For each call, all the incoming SIP messages are processed by the SIP proxy server for all the SIP transactions (as shown in Figure 2.6). There are 6 or more queuing stations in tandem to process various SIP messages with the deterministic service time. The same SIP proxy server software module is executed to identify and process each SIP message based on the unique address for each session until the session is established and torn down.
The average response time, mean number of calls and other performance characteris-tics for an M/D/1 queuing system can be found in the standard derivations and refer to
Appendix Afor the step by step derivation.
P(0) = (1−ρ) (4.1)
P(N+ 1) ={P(N)−[P(0) +P(N)]×P(N, ρ)−
N
X
k=2
P(k)×P(N−k+ 1, ρ)} 1
P(0, ρ) (4.3)
Since the solution given by the above derivation is proven to be numerically unstable [1]. To yield a numerically stable solution, we instead used the normalized form of the equation based on the famous ”Pollaczek - Khinchin (PK)” formula to calculate the mean response time of an M/D/1 queue.
W = [1/µ+ λ(1 +C 2
s
2(µ)2(1−ρ)] (4.4)
Using Little’s law, we can simply get the mean number of calls in the system as;
L= [ρ+ ρ
2(1 +C2
s
2(1−ρ) ] (4.5)
where Cs is the coefficient of variation. Cs is zero for the deterministic distribution
M/D/1 queue.
We considered replacing the Gurbani et al. [25] queuing model withM/D/1 model with network of queues or simply replacing the entire model with a simple M/D/1 model with a single queue as shown in Figure 4.6for the following reasons:
• The effort required by the SIP proxy server to process all the SIP requests and re-sponses are almost identical or constant service time, whereas they assumed that the INVITE request needed more processing time than other SIP transactions while setting up the SIP call. There is no significant difference in the size of the packets.
Table 4.3: M/D/1 Performance Model Predicted Results
λ 50 100 150 200 250 300 350 400
L 0.11 0.23 0.36 0.53 0.75 1.1 1.6 2.5 W in ms 2.1 2.3 2.4 2.7 3 3.5 4.3 6
Figure 4.3: Proposed SIP Proxy Server M/D/1 Single Queue Model
requests and other SIP response messages.
4.6
Predictions from M/D/1 models
4.7
Comparative study on absolute Performance of the SPS
Performance of the SIP proxy servers varies from servers to servers depends on the hard-ware capacity, CPU, speed and other memory related parameters. The experiments are conducted in a commonly used industrial standard servers like 7825H2 HP hardware and SIP Express Router (SER) version 0.8.14 software [30] for the SIP proxy server.
• InM/M/1 model, we noticed, there are significant differences between the analytical data versus experimental data obtained from the SER real proxy server (see Figures 4.5 and 4.6), likely due to several assumptions and limitations made in the analytical model. More importantly, the difference is clearly not just one of scale, i.e. tuning the single µ parameter in the M/M/1 model proposed in previous work would not succeed in matching the experimental data for any value of µ.
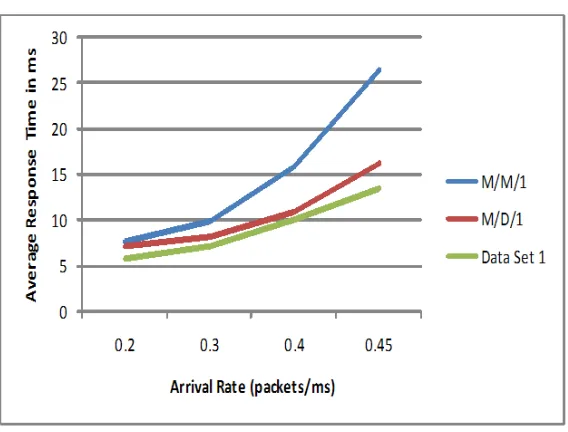
• The analytical solution that we obtained from the new proposedM/D/1 model with a constant service time for all SIP messages (SIP request and responses), have much better performance compared to the analytical data for the same input parameters and setup used originally for M/M/1 based queuing model. The average response times are in the range of 7.63 to 26.47 ms and mean number of calls are in the range of 1.31 to 11.33 calls (as shown inFigures 4.5 and 4.6) in the system in case ofM/D/1 model compared to average response time of 7.16 to 16.16 ms and mean number of calls is in the range of 1.03 to 6.3 calls, incase of M/D/1 for the same call arrival rates.
• The average response time to establish a SIP session inM/D/1 is less than 50 percent compare to M/M/1 analytical results and the mean number of calls in the system is also significantly smaller inM/D/1 model compare to M/M/1 model as shown in
Figure 4.4: M/M/1 and M/D/1 ART versus Data set 1
• The performance of theM/D/1 model is better for lower arrival rates and goes down when the call arrival rate increases.
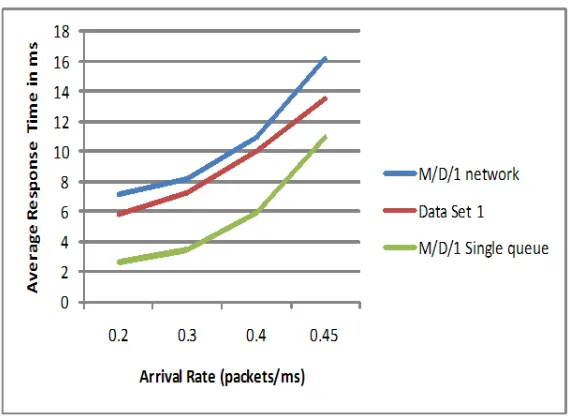
• While comparing the M/D/1 network model and M/D/1 single queue model with experimental Data set 1, we found that the M/D/1 single queue model has less significance and not very useful as shown inFigures 4.8 and 4.9.
4.8
Concluding Remarks
Figure 4.5: M/M/1 andM/D/1 MNC versus Data Set 1
Figure 4.7: M/D/1 Network andM/D/1 single queue ART versus Data set 1
Chapter 5
SPS Software Architecture Study
and sequentially, rather than using the older architecture of multiple, concurrently running modules for the various parts of the functionality, coupled by message queues. To best utilize the hardware, concurrency is introduced in these servers by simply spawning a large number of threads; each is identical, carrying SIP requests all the way through their processing. We obtained a much better understanding of the various processing modules, which we present below.
5.1
Address Translation
During address translation, SPS processes the request-URI of an incoming request and returns the list of contacts, each providing a URL for use in the outgoing request. If number expansion is enabled, SPS applies the global set of expansion rules to the user portion of the relevant URLs for which the host portion is the SPS. For REGISTER messages, this applies to the To, From, Contact, and (optionally) the authorization headers. For INVITE messages, this applies to the Request URI, from, and (optionally) proxy authorization headers [47]. SPS translation modules, in the order in which they are called by SPS, are as follows:
• Call Forward Unconditional
• Registry. The most common use of the translation phase is to perform registry lookups. Users within a domain may REGISTER contact addresses (URIs) for them-selves with the proxy. When requests are received in the format of user@localhost, the next hop will be selected from that user’s list of active registrations. This is the contact URI (from the header by that name in the REGISTER request).
• Gatekeeper Transaction Message Protocol (GKTMP).
The first module to return one or more contacts completes the translation step, and the remaining modules are not called. For example, if the Registry module returns a contact, then neither the ENUM nor the GKTMP module is called. If none of the translation modules returns a contact, the core proxy module returns a contact based on the incoming Request-URI; that Request-URI is then used in the next-hop routing step.
5.2
Next-Hop Routing
5.3
IP Resolution
5.4
SPS Components
• Redirect Servers: A redirect server is a UAS that generates 3xx responses to re-quests that it receives, directing the client to contact an alternate set of URIs. It receives requests, strips out the address in the request, checks its address tables for any other addresses that might be mapped to the one in the request, and returns the results of the address mapping to the client for the next one or more hops that a message should take. The client then contacts the next-hop server or UAS directly. Redirect servers are often co-located with proxy or registrar servers.
• Registry Servers: A registry server accepts REGISTER requests from UACs for registration of their current location. It places the information received in those requests into the location service for the domain that it handles. Registry servers are often co-located with proxy or redirect servers.
• Location Services: A location service is used by an SIP redirect or proxy server to obtain information about a called party’s possible locations. It contains a list of bindings of address-of-record keys to zero or more contact addresses. Bindings can be created and removed in many ways; the SIP specification defines a REGISTER method for updating bindings. Location services are often co-located with redirect servers.
GUI client. Information pertaining to a single registered user (SIP endpoint) is called a registration. The registry database is thus a collection of registrations.
• Routing Database: The routing database contains static route information that the proxy server uses to forward requests toward endpoints that are not registered with the local registrar server, reside within a different domain, or exist in the PSTN. Static routes are configured based on next-hop IP addresses or next-hop domains. Routing information is configured by means of the provisioning GUI client. As with the registry database, the routing database is stored in memory-mapped files in shared memory so that information persists between restarts.
5.5
Key SPS Functions
SPS performs the following steps to deliver messages from endpoint to endpoint:
• Address translation creates an outgoing request-URI from an incoming request-URI.
• Next-hop routing obtains a set of fully qualified domain names (FQDNs) or IP ad-dresses, along with transport type and port numbers, for each of the SIP entities found in the translation step. This step involves the following features, among oth-ers: 1. SRV lookup on the Static Route Next-Hop field if the Static Route Next-Hop Port field is not specified or is zero. 2. Registration, Admission, and Status Protocol (RAS). 3. Location Request (LRQ) message transmission to the H.323 gatekeeper to obtain the next-hop gateway transport address.
• IP resolution converts each next hop found in the next-hop route lookup step into an IP address.
the purpose of making requests on behalf of other clients. A proxy server primarily handles routing, ensuring that a request is sent to another entity closer to the targeted user. Proxy servers are also useful for enforcing policy (for example, ensuring that a user is allowed to make a call). A proxy server interprets, and, if necessary, rewrites specific parts of a request message before forwarding it. Proxy servers provide functions such as authentication, au-thorization, network access control, routing, reliable request retransmission, and security. They are often co-located with redirect or registrar servers. SPS can use any physical-layer interface in the server that supports Internet Protocol (IP).
Chapter 6
M/M/c
Based SPS Model
In light of the change in the SPS software architecture, we reexamine the problem of mod-eling the SPS in this chapter. During the course of this investigation, the open source SPS software we were previously using became obsolete and a version with the new architecture was not available to us for testing. We continued our investigation with SPS software man-ufactured by CISCO coroporation. This involves some loss of generality that we had hoped to retain by using the open source software, but on the other hand increases the realistic nature of the results greatly, since the data pertain to an actual commercial implementation of the SPS.
6.1
Contribution
iden-tifies and processes each SIP message based on the unique address for each session until the session is established and torn down. This creates a variation in queue occupancy at different queuing stations, while processing different SIP transactions, which increases the average response time to setup a session. In this second part of the research, we intend to provide a solution to the problem by proposing a less complex, more predictable, and more realistic SIP proxy server based onM/M/cqueuing model. This work was motivated by our understanding of the software system that realizes SIP proxy servers in practice, and we studied it analytically and experimentally. Current trends in server architectures makes this model more suitable than theM/D/1 model. In this work, we considered only a single proxy server for processing all the incoming SIP calls generated from SIP endpoints in a LAN environment, and hence assumed no delay due to proxy servers located at distant locations.
6.2
Proposed
M/M/c
based SPS Model
and forward each packet. There is further fine structure in the processing, some of which is shown inFigure 5.1.
Key observations are as follows: In earlier realizations of the SIP proxy server, it was typical to run each main stage of the processing as a separate standalone concurrent process. In such a realization, each such module is amenable to modeling as a queue, because the coupling between different modules is unsynchronized and through message passing. Such a realization is useful and efficient if the pattern of processing of different packets (i.e. which modules they go through and in what order) varies from packet to packet, and has some statistically (but not deterministically) characterizable patterns. However, it is not any more efficient than a synchronized (function call) processing if almost all packets are expected to go through the same sequence of processing, as is now understood to be the pattern of proxy processing for the INVITE packets which produce most stress on the server. (At best, it is equally efficient; at worst, it is significantly less efficient due to messaging and other overhead.)
Figure 6.1: SIP Proxy ServerM/M/cQueuing Model
and tore down (as shown in Figure 2.6). This process reduces the processing time of each SIP session and also increases the call arrival rate. This part of the research establishes the M/M/cmodel is an efficient and better performance model with analytical and experimental
Data Set 2results as shown in Table 6.1, 6.2 and Figures 6.4, 6.5 and 6.6.
The mean response time (W) and the mean number of calls (L) for theM/M/cqueuing based SIP proxy server model can be obtained from any standard work [2], [49] and are as follows: (For complete derivation, refer toAppendix A)
W = 1 µ + [
(λµ)cµ
(c−1)!(cµ−λ)2]p0 (6.1) L= λ
µ+ [
(λ µ)
cλµ
(c−1)!(cµ−λ)2]p0 (6.2) where c represents number of servers which is same as number of threads that can be allotted and executed dynamically while running the SIP proxy server software. The server provides independent and identically distributed exponential service at rate µas shown in
state of the system. When the number of requests resident in the proxy server is greater than c, all the servers are busy and the mean system output rate is equal to c times µ. When the number of requestsnis less thanc, then onlynout ofcservers are busy and the mean system output rate is equal to ntimesµ. Following usual birth-death derivation, the equilibrium probabilityp0 of the system being idle can be obtained using
[1 +
c−1
X n=1 (cρ)n n + (cρ)c c! 1 1−ρ]
−1 (6.3)
whereρ= cµλ <1
6.3
Experiment lab setup
6.4
Experiment procedure
Figure 6.2: Lab Experiment Automation Code Flow Chart
all the experiments. Also, monitored for any packet loss and validated the complete SIP call flow as shown inFigure 2.6for each SIP call during the experiment using “Wireshark” network protocol analyzer tool [60].
All the experiments conducted similar to M/M/1 model with the CISCO SIP proxy servers with all the simulation tool, data collection tool, hardware, CISCO SPS software, and used automated scripts to perform the experiments. Experimental results are shown in
Table 6.1
6.5
Predictions of
M/M/c
model
Figure 6.3: Experiment Setup and Call Flow diagram
Table 6.1: Experimental Data Set 2 Results
Table 6.2: M/M/c Performance Model Predicted Results λ(pks/ms) 0.2 0.3 0.4 0.5 0.6 0.7 0.8 0.9 1.0
L 1.2 1.8 2.5 3.1 3.9 4.7 5.7 7.0 8.7 W in ms 6.0 6.1 6.2 6.3 6.5 6.8 7.2 7.8 8.7 ρ in percent 13 20 26 33 40 46 53 60 66
QTP.dll files). The plug-ins are downloaded into Microsoft office library directory. All the queuing formula and the corresponding calculations are accessed through the spreadsheet from the “Formulas menu” option. By selecting the “Queuing ToolPak” from the category pull down menu and then selecting the appropriate queuing model, calculated the average response time, mean number of calls and server utilization data by providing appropriate input values such asλ,µ(obtained by calibration as before) andc(only in case ofM/M/c). The value of c= 3 (number of threads) and 0.5ms−1 was considered in ourM/M/c model calculations, based on the internal study done within CISCO development team on the proxy server optimal value for number of threads needed for processing the SIP packets. The predictions of M/M/c model is inline or very close to the experimental Data Set 2
in the real world experiments and in absolute numerical values. The predicted results are shown in Table 6.2.
6.6
Scalability of
M/M/c
based SPS
Figure 6.4: M/M/c ART versus Experimental Data Set 2
Figure 6.6: M/M/cSU versus Experimental Data Set 2
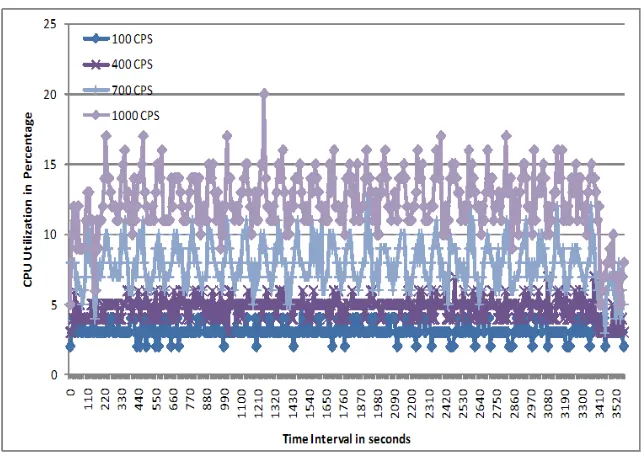
presented in Figures 6.7 to 6.11. In these graphs, Y-axis represents the memory and CPU and the x-axis represents the polling interval at 10 seconds per interval, meaning, every 10s the (Perfmon) tool, poll the SPS server and extract the data.
6.6.1 SPS Scalability Result Comparisons
• The server utilization predicted by theM/M/c queueing model are in general agree-ment with the experiagree-mental results, as shown inFigures 6.7, 6.8, 6.9 and 6.10. This clearly indicates that the M/M/cmodel can successfully predict server utilization of the SPS, under varying conditions of load.
• The CPU and memory utilization increases when the arrival rate increases as predicted and it is peaked between 2.5 - 16 percent range for the dual core 4 processor server as shown in Figures 6.7 and 6.11for 1000 cps without any call loss is a good indicator how many calls that this SPS server can handle. This further validates that the multi-threaded SPS realization is scalable.
• In case of memory data, another key observation, for each arrival rate after reaching 180s interval, the curve stays flat (Figure 6.11) because the calls that are active in the system is equal to λ×CHT (180 seconds), so number of calls active in the system for each arrival rate is a constant. This flat curve also indicates there is no memory leaks in the system.
• Memory cost average per SIP call is measured as 2.92 Kilo Bytes and average CPU cost per SIP is measured as 0.00625 percent per call, which is acceptable to most industry standards. This clearly indicates the multi- threaded SPS realization is scalable and have a better performance.
Figure 6.7: CPU Utilization Chart (other 6 cps rates are NOT shown for clarity)
predicted.
6.7
Comparative Study on Absolute Performance of SPS
Performance of the SIP proxy servers varies from servers to servers depending on the hard-ware capacity, CPU, speed and other memory related parameters. The experiments are conducted with a single SIP proxy server in local LAN environment.
Figure 6.8: CPU Utilization 100 CPS Predicted and Experimental comparison
Figure 6.10: CPU Utilization 1000 CPS Predicted and Experimental comparison
matching the experimental data for any value ofµ.
• In M/M/c model, the experimental results obtained is slightly better than the ana-lytical results, approximately 10-15 percent as shown inFigure 6.4 6.5 and 6.6, since there are very limited assumptions made in our analytical model. When the call ar-rival rate increases, then the average response time and the mean number of calls increase. This confirms the intuition that the M/M/c model better represents the correct architecture of the SIP proxy server.
• In case ofM/M/1 model, there are 6 queuing stations processing all the incoming SIP packets, and the average response time to establish each SIP session is in the range between 9.8 to 26.5 milliseconds whereas in case ofM/M/cmodel with a single queue with 3 servers, is in the range between 6 to 6.3 milliseconds for the same cps rates with the experiments conducted on a real SIP proxy server. This indicates M/M/c model showed a significant performance improvement compared toM/M/1 model.
• Incase ofM/M/1 model, the number of calls in the system (1.31 to 11.3 calls) is much higher than the M/M/c model (1.2 - 2.7 calls). Again M/M/c model is 75 percent better than M/M/1 model as shown inFigure 6.5.
• During the experiments, it was observed that theData Set 2 performed much better compared toData Set 1when the incoming arrival packet rate increases. InData Set 1, maximum call rate achieved was 450 cps, whereasData Set 2, the call rate achieved was 1000 cps as shown in Figures 6.4, 6.5 and 6.6.
• The maximum call rate (in cps) that the M/M/1 model can process is 50 percent lower thanM/M/cmodel as shown in Tables 4.1, 6.1, and 6.2.