ABSTRACT
SWEET, WILLIAM VANDERVEER. Mechanisms of Variability within the Upper Ocean of the Galápagos Archipelago. (Under the co-direction of John M. Morrison & Lian Xie).
Five hydrographic surveys (March 2005, November 2005, June 2006, November 2006, and May 2007) and four continuous moored time series document changes of the surface-layer properties within the Galápagos Archipelago from 2005 to 2007. The March 2005, November 2005, and June 2006 surveys are used to describe the annual cycle within the archipelago. Changes include those of the sea surface temperature (SST), which cools in the Garúa season (June – November) when the southeast trades and South Equatorial Current (SEC) strengthen and the Equatorial Undercurrent (EUC) is weaker and deeper. Opposite conditions occur in the wet season (December – May). Sea surface salinity (SSS) freshens in the wet season from local rainfall as the Inter-tropical Convergence Zone (ITCZ) nears and in the late Garúa season from influxes of the North Equatorial Countercurrent (NECC). The SSS is high in the latter half of the wet season when the EUC strengthens and flows near the surface. The SSS is normally higher west of Isabela where the EUC collides/upwells and when advected from the Cold Tongue westward by the SEC into the archipelago. Surface chlorophyll a (Chl a) concentrations
are highest where the thermocline (20°C isotherm) is shallowest.
increased across the archipelago by 25 – 40% above its 2004 – 2006 mean and nearly 25% above its 1998 – 2007 mean. The much larger Chl a concentrations near/within the
archipelago as compared to 95° and 110°W implicate an iron-enriched upwelling within the island platform.
Effects from the El Niño Southern Oscillation (ENSO) produce significant variations within the surface-layer properties of the Galápagos Archipelago during the last two hydrographic surveys that occurred November 2006 and May 2007. The 2005 – 2007 ENSO cycle is indexed by the SST anomalies within the Niño Region 3.4. The water-column response is quantified through comparison to the results from the November 2005 and June 2006 surveys, which occurred during similar times of the year but very different by the ENSO cycle. Downwelling Kelvin waves promoting the warm 2006/07 El Niño and an upwelling Kelvin wave promoting the cool 2007/08 La Niña cause significant variations within the archipelago. During the ENSO-warm surveys, the survey-mean thermocline depth deepens between 10 and 25 m, which results in a >2°C rise in the SST. The SSS and water-mass classification remain relatively unchanged. Mean Chl a concentrations decline by >0.2 mg m-3, or a >15% drop from the respective
Mechanisms of Variability within the Upper Ocean of the Galápagos Archipelago
by
William VanderVeer Sweet
A dissertation submitted to the Graduate Faculty of North Carolina State University
in partial fulfillment of the requirements for the Degree of
Doctor of Philosophy
Marine, Earth and Atmospheric Sciences
Raleigh, North Carolina
2008
APPROVED BY:
___________________ ___________________ Dan Kamykowski Ping-Tung Shaw
___________________ ___________________ Lian Xie Blake A. Schaeffer (Co-chair of Advisory Committee)
___________________ John M. Morrison
BIOGRAPHY
William Sweet was raised in a family that encouraged exploration of the mind, body, and soul. Years spent in the backyard creek led to his fascination with water and its creatures. An undergraduate degree in physics exposed many wonders associated with the earth’s processes. An influential conversation in 1993 with his astronomy professor at UNC Chapel Hill directed him to the marine sciences. His awakening occurred during the summer of 1994 at NCSU where he met his future academic adviser studying remotely sensed data and participated on a couple field cruises to deploy and recover experimental trawl-proof instrument housings. It was under the hot sun and rolling waves that he realized he belonged in the field to study first hand the marine environment. He spent the next 10 years as an operational field scientist involved with numerous mooring and survey projects. His experiences include work on the Carolina’s Ocean Margins Program (OMP), the Joint Global Oceanographic Flux Survey (JGOFS) in the Ross Sea of Antarctica, and the Carolina-based CaroCOOPS and CORMP components of the Integrated Ocean Observing System. Another field endeavor sampled and documented a series of physical forces that sequenced prior to a large fish kill in the Neuse River Estuary and was the topic for his Master’s degree in 2000. He jumped at the chance to participate in a biophysical investigation of the Galápagos Archipelago for his Ph.D. program in 2005. Here, he made some lifelong memories and friends deploying moorings and surveying the archipelago with a boatload of high-tech gear, buoys, hot sauce and rice.
ACKNOWLEDGEMENTS
I would like to thank the many former and current faculty and staff of NCSU’s Department of Marine, Earth and Atmospheric Sciences, who have afforded me many opportunities to work and study. I would especially like to thank my co-adviser, John Morrison, for the many once-in-a-lifetime opportunities (from Antarctica to the Galápagos) that he has been involved and shared with me. Also, I thank my committee for their insightful conversations and comments, which have helped clear my focus and reveal many wonderful biophysical complexities. Lastly, I thank my family who has lead by example and my wife, Whitney, who has made my time in school an unforgettable experience full of colorful memories.
TABLE OF CONTENTS
List of Tables . . . vi
List of Figures . . . vii
Project Overview . . . 1
Chapter 1 Water Mass Seasonal Variability in the Galápagos Archipelago . . . 2
Abstract . . . . 3
Introduction . . . . 3
Data . . . 5
Results . . . . 6
March 17-28, 2005 Survey . . . . 7
November 22 – December 2, 2005 Survey . . . 9
June 26 – July 4, 2006 Survey . . . 11
Biological Response . . . 13
Discussion . . . 13
Conclusions . . . . 14
Acknowledgements . . . 15
References . . . 15
Chapter 2 Tropical Instability Wave Interactions within the Galápagos Archipelago . . . 16
Abstract . . . 17
Introduction . . . 17
Results . . . . 21
Discussion . . . 24
Conclusions . . . . 27
Acknowledgements . . . 27
References . . . 28
Chapter 3 El Niño Southern Oscillation Related Water Mass Variability in the Galápagos Archipelago . . . 41
Abstract . . . 41
Introduction . . . . 41
Data . . . 44
Results . . . 45
Background Conditions: The 2006/06 El Niñoand the 2007/08 La Niña . . . 45
November 14-23, 2006 Survey . . . . 47
May 17-27, 2007 Survey . . . 48
Survey Comparison . . . . 49
Discussion . . . 50
Conclusions . . . . 53
Acknowledgements . . . 54
References . . . 55
LIST OF TABLES
Chapter 1
Table 1 EUC characteristics and thermocline depths . . . 6
Chapter 2
Table 1 SeaWiFS mean Chl a concentrations . . . . 33
Chapter 3
LIST OF FIGURES
Chapter 1
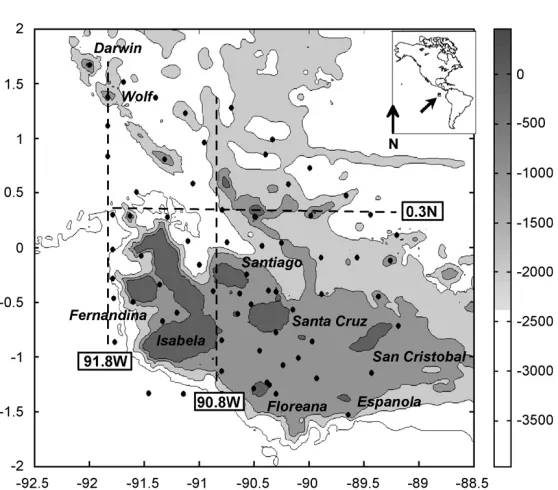
Figure 1. Map of study site and sampling stations . . . . 4
Figure 2. 2002 – 2006 monthly mean conditions . . . 6
Figure 3. March 2005 survey temperature maps . . . . . . 7
Figure 4. March 2005 survey salinity maps . . . 8
Figure 5. November 2005 survey temperature maps . . . . . . 9
Figure 6. November 2005 survey salinity maps . . . . . . . 10
Figure 7. June 2006 survey temperature maps . . . 11
Figure 8. June 2006 survey salinity maps . . . . . . 12
Figure 9. Thermocline depth vs. Chl a . . . 13
Chapter 2 Figure 1. Map of study site and sampling stations . . . 34
Figure 2. 2002 – 2006 monthly mean conditions . . . 35
Figure 3. Mean SST and meridional currents at 0°, 110°W . . . . . . . 36
Figure 4. TAO array and archipelago power spectral densities . . . 37
Figure 5. Aug – Dec 2005 time series at 0°, 110°W . . . . . . 38
Figure 6. Aug – Dec 2005 time series at 0°, 95°W and the archipelago . . . . 39
Figure 7. Argo profiles and Aug – Dec 2005 SeaWiFS Chl a . . . . 40
Chapter 3 Figure 1. Map of study site and sampling stations . . . 60
Figure 2. 2002 – 2007 monthly mean conditions . . . 61
Figure 3. Longitude vs. time plot of sea surface height anomaly along the equator . . . 62
Figure 4. Longitude vs. time plot of zonal wind and thermocline depth anomaly along the equator . . . 63
Figure 5. Lowpass temperature time series at the TAO array and in the archipelago . . . . . . . 64
Figure 6. November 2006 and May 2007 temperature and thermocline depth anomalies along the equator . . . 65
Figure 7. November 2006 survey temperature maps . . . . 66
Figure 8. November 2006 survey salinity maps . . . 67
Figure 9. November 2006 survey Chl a maps . . . 68
Figure 10. May 2007 survey temperature maps . . . . 69
Figure 11. May 2007 survey salinity maps . . . . . . 70
Figure 12. May 2007 survey Chl a maps . . . 71
Project Overview
The following work is part of the Connectivity and Upwelling Dynamics in the
Galápagos Marine Reserve project, a cooperative program by the University of North
Carolina at Wilmington (UNCW), North Carolina State University (NCSU), the National Aeronautics and Space Administration (NASA) Goddard Space Flight Center (GSFC), the Charles Darwin Research Station (CDRS), and the Galápagos National Park Service (GNP). The program is researching variability that occurs within the upper ocean and its effects upon the biodiversity of the Galápagos. While considerable effort is given to studying the biodiversity and ecology of the Galápagos, little systematic effort has gone into studying the oceanographic setting. No complete understanding of biological variability in the ocean will be forthcoming without complementary knowledge of the physical processes acting upon it. One of the focuses of the program is to better understand the spatial and temporal presence of Equatorial Undercurrent (EUC) filaments as they propagate across and upwell within the Galápagos Archipelago. Quite probably these features are the most important physical process supplying nutrients to the surface and stimulating the archipelago’s very high local primary production that feeds its extreme biodiversity.
The following three manuscripts describe mechanisms causing annual to inter-annual variability within the upper ocean of the GalápagosArchipelago. The findings are based on
in-situ observations collected during the 2005 – 2007 field campaign as well as a suite of
complimentary moored and remotely-sensed data. Specifically, the dissertation documents the upper ocean variability that occurs 1) annually as the seasons change and those changes that are superimposed and driven by 2) tropical instability waves (TIW) and 3) the El Niño Southern Oscillation (ENSO). These results compliment the other concurrent geochemical, surface plankton, and circulation modeling components of the NASA-funded program, which aims to provide an integrated understanding of the ecology and enhance the predictive capabilities for management of the newly formed Galápagos Marine Reserve (GMR).
Chapter 1
Water Mass Seasonal Variability in the Galápagos Archipelago
W.V. Sweeta,*, J.M. Morrisonb, D. Kamykowskia, B. Schaeffera, S. Banksc, A. McCullocha aNorth Carolina State University, Dept. of Marine, Earth & Atmospheric Sciences, Raleigh, NC, USA
bUniveristy of North Carolina Wilmington, Dept. of Physics & Phys. Oceanography, Wilmington, NC, USA cCharles Darwin Research Station, Galápagos Islands, Ecuador
Published in
Deep-Sea Research I
Deep-Sea Research I 54 (2007) 2023–2035
Water mass seasonal variability in the Gala´pagos Archipelago
W.V. Sweeta,, J.M. Morrisonb, D. Kamykowskia, B.A. Schaeffera, S. Banksc, A. McCullocha
aDepartment of Marine, Earth, and Atmospheric Sciences, North Carolina State University, Raleigh, NC, USA bDepartment of Physics and Physical Oceanography, University of North Carolina Wilmington, Wilmington, NC, USA
cCharles Darwin Research Station, Gala´pagos Islands, Ecuador
Received 1 November 2006; received in revised form 18 September 2007; accepted 24 September 2007 Available online 2 October 2007
Abstract
Three hydrographic surveys were conducted within the Gala´pagos Archipelago during 2005–2006. The surveys captured the surface properties (o80 m) near the extremes and midpoint of the annual cycle of the mean sea surface temperature (SST) and winds. A cooler SST occurs in boreal summer and fall as the southeast trades strengthen. Current data at 1101W show that this coincides with the Equatorial Undercurrent (EUC) becoming weaker and deeper below a strengthening westward South Equatorial Current (SEC). Opposite conditions are generally found in the spring. Meanwhile, the sea surface salinity (SSS) freshens in late winter/spring when the archipelago receives large rainfalls as the Intertropical Convergence Zone (ITCZ) shifts southward, or in late fall when receiving large influxes from the North Equatorial Countercurrent (NECC). As a result, Tropical Surface Waters (TSW) with salinity (S)o34 fill the archipelago from the late fall through early spring. The SSS becomes saltiest in late spring/early summer as the EUC strengthens, resulting in Equatorial Surface Waters (ESW),S434, throughout the archipelago. Equatorial Surface Waters are present west of Isabela, where the EUC upwells as it interacts with the Gala´pagos platform. They also are found east of the archipelago in the cold tongue, which extends westward from South America, and therefore may be advected by the SEC into the archipelago. The upwelling west of Isabela creates a consistently shallow 201C isotherm (thermocline), which remains elevated across the archipelago. Linear extrapolation of the thermocline depth along the equator from 110 to 951W gives a good approximation of the thermocline depth within the archipelago from 92 to 891W.
Published by Elsevier Ltd.
Keywords:Gala´pagos; Eastern pacific; Equatorial Undercurrent; Upwelling; Water masses
1. Introduction
The Gala´pagos Archipelago (Fig. 1) lies within the eastern Pacific, near the Equatorial Front (EF), the divide separating the warm and low-salinity (So34) Tropical Surface Waters (TSW) in the north
and the colder and saltier (S434) Equatorial Surface Waters (ESW) of the east Pacific cold tongue to the south (Wyrtki, 1966; Fiedler and Talley, 2006). The core of the eastward-flowing Equatorial Undercurrent (EUC) rises within the equatorial thermocline (Wyrtki and Kilonsky, 1984), feeding the Ekman divergence of the cold tongue with high salinity (S35.2) Subtropical Underwater (STUW). When the EUC runs into ARTICLE IN PRESS
www.elsevier.com/locate/dsri
0967-0637/$ - see front matter Published by Elsevier Ltd. doi:10.1016/j.dsr.2007.09.009
Corresponding author. Fax: +1 919 515 7802.
E-mail address:[email protected] (W.V. Sweet).
and through the Gala´pagos platform, it further upwells from their topographic blockage ( Houve-naghel, 1978;Eden and Timmermann, 2004). At the surface, the westward-flowing South Equatorial Current (SEC) flows weakly across the archipelago to depths between 20 and 50 m (Knauss, 1960), before splitting into northward and southward lobes west of Isabela (Kessler, 2006). Along the equator, the SEC is variable to1251W due to momentum and mass exchange with the underlying EUC (Wyrtki and Kilonsky, 1984). The upwelled waters of the EUC supply the majority of the SEC’s volume (Wyrtki, 1966, 1981), which also receives inputs from the eastward North Equatorial Coun-tercurrent (NECC) to the north (Kessler, 2006) and equatorial and coastal upwelling of thermocline waters to the east.
The strength and depth of the EUC affect the water properties within the archipelago. In the central Pacific, Wyrtki and Kilonsky (1984) ob-served the EUC core near the 201C isotherm (thermocline). At 125, 110, and 951W, Johnson et al. (2002) reported a 15-year mean of the EUC core between the 17 and 201C isotherms along the equator at 80, 60, and 40 m, respectively, with eastward surface currents. At 921W, Steger et al.
(1998) noted the EUC within the 14–201C iso-therms and driving an eastward surface current during a November survey. At this time, the EUC had upwelled much of its volume before splitting north and south around Isabela, where it continued beneath the 30-m deep thermocline across the archipelago.
A strong seasonal variability affects the archipe-lago (Houvenaghel, 1984). During the dry, Garu´a season (May–November), the Intertropical Conver-gence Zone (ITCZ) is well north of the equator, the SE trades strengthen, and the sea surface tempera-ture (SST) decreases. Garu´a, the Spanish word for mist, forms when warm air masses move over a much cooler SST causing moisture to condense out of the atmosphere. During the hot, wet season (December–April) when locally heavy rainfalls are possible, the ITCZ nears the equator, the SE trades subside, the SST warms from both reduced Ekman divergence and evaporative cooling (Xie, 1994).Yu and McPhaden (1999) and Johnson et al. (2002)
have quantified the annual response within the eastern Pacific. Observations at 1101 and 951W indicate maximum southeasterly winds, shallowest thermocline and strongest SEC in early fall and opposite conditions in mid/late spring. In mid ARTICLE IN PRESS
Fig. 1. Bathymetry (m) of the Gala´pagos Archipelago, sampling stations and presented vertical profiles at 91.81W, 0.31N, and 90.81W.
spring, the EUC is strongest (speed and transport), shallowest, and has highest salinity (S35.2), which becomes weakest, deepest, and freshest (S34.9) towards late fall. The SST is431C higher in early spring than in early fall. The sea surface salinity (SSS) is generally freshest, in phase with the warmest SST, but becomes saltiest towards late spring from enhanced transport within the EUC/ thermocline and from the northward migration of the ITCZ. By late fall, the SSS freshens throughout the eastern, equatorial Pacific as the NECC strengthens and increasingly feeds the SEC (Kessler, 2006).
Other mechanisms affecting the water masses around the archipelago include the strong inter-annual variations of the El Nin˜o/Southern Oscilla-tion (ENSO) cycle that may increase the SST by 411C, leave the SSS relatively unchanged, depress the thermocline, and reduce the SEC and EUC during the warm phase (El Nin˜o). The opposite conditions are brought about during the cool La Nin˜a (Johnson et al., 2002; Fiedler and Talley, 2006). In addition, shearing of the major zonal currents can create tropical instability waves (TIW), which meridionally distort the EF by advecting warm waters to the south and cool waters to the north (Philander, 1978; Willett et al., 2006).
In March 1998, Ecuador created the Gala´pagos Marine Reserve (GMR) in order to help preserve its unique and juxtaposed warm- and cold-water ecosystems (Bustamante et al., 1999). Amazingly enough, little to no systematic studies have been made of the oceanographic regime of the GMR. A few studies have quantified surface plankton around the archipelago, noting highest concentrations west of Isabela (Feldman, 1986; Feldman et al., 1984). The upwelling EUC (Steger et al., 1998) and regional shallow thermocline support high plank-ton concentrations throughout the archipelago (Palacios, 2002). Intensive sampling of the macro-invertebrates and reef-fish communities (Edgar et al., 2004) has created maps of the distinctive biodiversity central to the management of the GMR. A detailed physical description of the water masses incident upon the archipelago is lacking, and essential if GMR managers are to better predict the ecosystem response to an environmental stress. The primary focus of this paper is the identification of the seasonal characteristics of the archipelago’s surface waters made during three hydrographic surveys between 2005 and 2006.
2. Data
The data presented here were collected during a study of key ecological processes that affect the biodiversity within the archipelago. These cruises were a cooperative effort by the University of North Carolina Wilmington (UNCW), North Carolina State University (NCSU), the National Aeronautics and Space Administration (NASA) Goddard Space Flight Center (GSFC), the Charles Darwin Re-search Station (CDRS), and the Gala´pagos Na-tional Park Service (GNP). AddiNa-tional papers will discuss the biochemical and planktonic properties of the archipelago and a circulation modeling effort.
Data were collected during three surveys (Fig. 1) conducted March 17–28, 2005 (March 2005), November 22–December 3, 2005 (November 2005) and June 26–July 4, 2006 (June 2006) on the patrol launch of the Gala´pagos National Park Service, the
M/N Sierra Negra. Surface data included underway measurements of salinity, temperature, and fluores-cence with a Seabird Electronics SBE 19+ (CTD) and a WetLab BB2F fluorometer averaged over 30-min intervals. Vertical profiles to approximately 80 m were made at each station with an identical system, deployed by hand in the 2005 surveys and by a small winch during the 2006 survey. Tempera-ture-salinity (TS) diagrams of the CTD data averaged every 2 m show the water-mass types of
Wyrtki (1966). For this study, although, if the SSS is
434 the water mass will be considered ESW, and if it is o34 it will be considered TSW, regardless of the SST.
Wind and SST data were obtained from the Physical Oceanography Distribution Active Archive Center’s (PO.DAAC) Ocean Earth Science Infor-mation Partner (ESIP) Tool (POET). Mean 8-day infrared imagery of SST from the MODIS Aqua sensor (4-km resolution) close in time to each survey period provided large-scale views (51N–51S, 95–801W) of the region. Mean monthly Reynolds/ NCEP (NCEP) SST (11) and its anomaly from a 25-year mean and a monthly mean of daily winds (0.251) from NASA’s microwave scatterometer (QSCAT) were averaged between 21N and 21S and between 92 and 881W. The ENSO SST anomalies from Nin˜o region 3.4 (51N–51S, 170–1201W) were obtained from the National Oceanic and Atmo-spheric Administration (NOAA) Climate Prediction Center. Ocean current (1101W) and temperature (110 and 951W) profiles from the Tropical Atmo-sphere Ocean (TAO) array along the equator ARTICLE IN PRESS
assisted in the interpretation of the EUC and thermocline.
3. Results
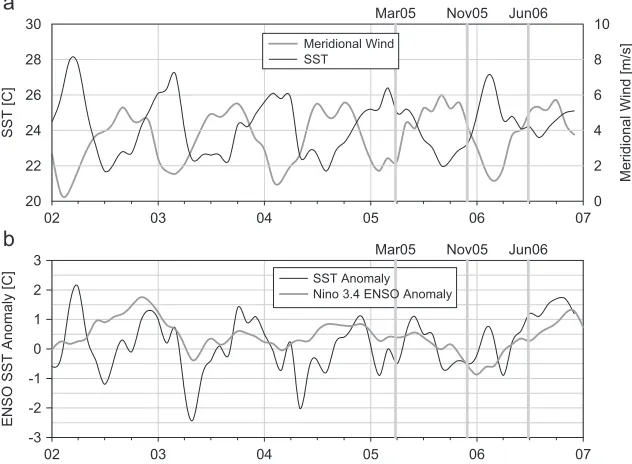
The three surveys March 2005, November 2005, and June 2006 occurred during a mid-wet, a late-Garu´a, and an early-Garu´a season, respectively. The annual cycle of the monthly mean (Fig. 2a) reveals minimum winds and maximum SST in the winter/spring and opposite conditions in the sum-mer/fall. Fig. 2b shows the SST anomaly (0.4,
0.5, and 1.21C) and the ENSO SST anomaly (0.4, 0.5, and 0.31C) for the three cruises. Table 1
shows the mean of the daily values for each survey period of the depth (speed) of the EUC at its core and the thermocline depth at 1101W, the depth (temperature) of the upper surface of the EUC at 1101W, the depth of the thermocline at 951W, and the thermocline depth at 110 and 951W linearly extrapolated to 921W. Also shown is a mean thermocline depth from CTD profiles for each survey computed from stations within 70.51 of the equator between 89 and 921W.
ARTICLE IN PRESS
02 03 04 05 06 07
ENSO SST Anomaly [C]
-3 -2 -1 0 1 2 3
02 03 04 05 06 07
Meridional Wind [m/s]
0 2 4 6 8 10 SST [C] 20 22 24 26 28 30
Mar05 Nov05 Jun06 Mar05 Nov05 Jun06
Meridional Wind SST
SST Anomaly Nino 3.4 ENSO Anomaly
Fig. 2. 2002–2006 monthly mean (92–881W, 21N–21S) of (a) meridional wind (QSCAT) and SST (NCEP) and (b) SST (NCEP) and ENSO
(Nin˜o region 3.4) anomaly.
Table 1
Survey mean of daily values at 1101W of (1) EUC depth (velocity) at its core, (2) the depth of the thermocline (EUC velocity), (3) the depth
(temperature) at the surface of the EUC, (4) thermocline depth at 951W, (5) thermocline depth at 1101and 951W linear extrapolated to
921W, and (6) mean thermocline depth from CTD profiles70.51off of the equator
1101W 951W 921W Galapagos
(1) EUC core, m (velocity, cm/s)
(2) Thermocline, m (velocity, cm/s)
(3) EUC surface, m
(temperature,1C)
(4) Thermocline (m) (5) Predicted thermocline (m) (6) CTD thermocline (m)
March 2005 83 (155) 76 (147) o10 (25.62) 30 21 16
November 2005
87 (85) 45 (7) 45 (20.04) 20 15 23
June 2006 67 (146) 62 (138) o0 (24.12) 45 42 44
3.1. March 17– 28, 2005 survey
The mean SST is high (251C) and the winds light (2 m/s), both typical of the wet season and near their annual extremes (Fig. 2a). It should be noted that torrential downpours inundated the island of Santa Cruz for 2 days prior to the survey. Further observations of regionally heavy rainfall were recorded by the Tropical Rainfall Measuring Mission (TRMM) satellite available at http://
www.remss.com. The SST during this survey was close to the climatological mean (0.41C) at the end of the weak 2004–2005 El Nin˜o (Fig. 2b). The EUC at 1101W is quite strong (155 cm/s), has its core just below the thermocline, and drives an eastward flow near surface at 1101W (Table 1). The thermocline shoals to 30 m at 951W,20 m at 921W, and within the archipelago iso20 m.
A large-scale view of the SST for the eastern Pacific (Fig. 3a) shows very warm water from 85 to ARTICLE IN PRESS
-92 -91.5 -91 -90.5 -90 -89.5 -89 Mar05 Surface Temp [C]
-1.5 -1 -0.5 0 0.5 1 1.5
-92 -91.5 -91 -90.5 -90 -89.5 -89 Mar05 Thermocline Depth [m]
-1.5 -1 -0.5 0 0.5 1 1.5
-91.5 -91 -90.5 -90 -89.5 Longitude
March 2005 Temp [C], 0.3N
-80 -60 -40 -20 0 Depth [m]
-95 -92 -89 -86 -83 -80 Mar05 MODIS SST [C]
-4 -2 0 2 4
-92 -91.5 -91 -90.5 -90 -89.5 -89 Mar05 20-m Temp [C]
-1.5 -1 -0.5 0 0.5 1 1.5
-0.5 0 0.5 1.5 Latitude
Mar05 Temp [C], 91.8 W
-80 -60 -40 -20 0 Depth [m] 1
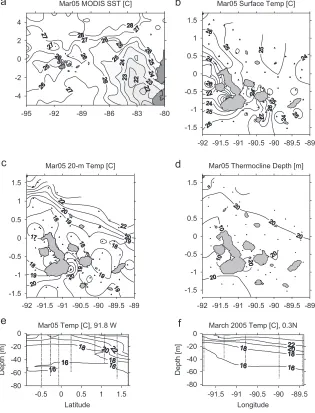
Fig. 3. March 2005 survey of (a) MODIS 8-day mean (14–21 March) SST, (b) CTD SST, (c) 20-m temperature, (d) thermocline depth,
(e) temperature at 91.81W, and (f) temperature at 0.31N.
921W covering the archipelago and separating cooler regions of equatorial upwelling to the west and cold tongue waters eastward towards South America. Within the archipelago the SST is warmest (4261C) north and south and coolest (o201C) west of Isabela (Fig. 3b). Cool temperatures (o191C) exist centrally across a NW/SE span at the 20-m depth (Fig. 3c), warmer to the north and coldest (o171C) west of Isabela. The thermocline is near the surface west of Isabela and reflects the
NW/SE span of cool water at the 20-m depth across the archipelago (Fig. 3d). Vertical temperature profiles along 91.81W (Fig. 3e) reveal a lifting of the isotherms4161C south of11N, while along 0.31N (Fig. 3f), all isotherms have a downward gradient heading east across the archipelago.
Higher salinity at the surface and 20 m (Fig. 4a and b) generally corresponds to lower temperatures (r2¼0.47 and 0.61). Freshest waters (So33) are found towards the north and south, with the highest ARTICLE IN PRESS
Mar05 TS Diagram
Salinity
32 33 34 35 36
Temperature [C] 12 14 16 18 20 22 24 26 28 30 TSW ESW
-92 -91.5 -91 -90.5 -90 -89.5 -89 Mar05 20-m Salinity
-1.5 -1 -0.5 0 0.5 1 1.5
-91.5 -91 -90.5 -90 -89.5 Longitude
Mar05 Salinity, 0.3 N
-80 -60 -40 -20 0 Depth [m]
-0.5 0 0.5 1 1.5 Latitude
Mar05 Salinity, 91.8 W
-80 -60 -40 -20 0 Depth [m]
-92 -91.5 -91 -90.5 -90 -89.5 -89 Mar05 Surface Salinity
-1.5 -1 -0.5 0 0.5 1 1.5 35.2
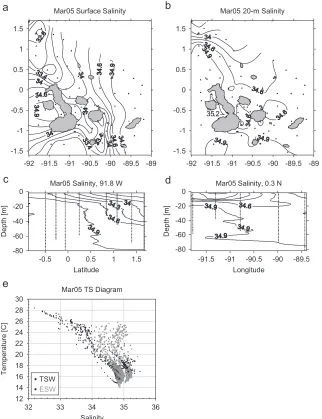
Fig. 4. March 2005 survey of (a) SSS, (b) 20-m salinity, (c) salinity at 91.81W, (d) salinity at 0.31N, and (e) TS diagram.
salinity (S434.9) found west of Isabela and within a surface plume in the east. A transect along 91.81W (Fig. 4c) reveals high salinity (S434.9) shoaling to 10 m west of Isabela to 0.51N, where a strong meridional gradient exists heading north. The transect along 0.31N (Fig. 4d) shows the fresher waters north of Isabela and higher salinity in the east that are part of the surface plume. The TS diagram inFig. 4eshows warm TSW and the ESW
found west of Isabela and to the east in the salty (SSS434.9) surface plume.
3.2. November 22– December 3, 2005 survey
The mean SST is low (231C) and the SE trades are of intermediate strength (4 m/s), reflecting a shift from the Garu´a to the wet season (Fig. 2a). The mean SST is0.51C below the climatological ARTICLE IN PRESS
-92 -91.5 -91 -90.5 -90 -89.5 -89 Nov05 Surface Temp [C]
-1.5 -1 -0.5 0 0.5 1 1.5
-92 -91.5 -91 -90.5 -90 -89.5 -89 Nov05 Thermocline Depth [m]
-1.5 -1 -0.5 0 0.5 1 1.5
-91.5 -91 -90.5 -90 -89.5 Longitude Nov05 Temp [C], 0.3 N
-80 -60 -40 -20 0 Depth [m]
-95 -92 -89 -86 -83 -80 Nov05 MODIS SST [C]
-4 -2 0 2 4
-92 -91.5 -91 -90.5 -90 -89.5 -89 Nov05 20-m Temp [C]
-1.5 -1 -0.5 0 0.5 1 1.5
-0.5 0 0.5 1.5 Latitude
Nov05 Temp [C], 91.8 W
-80 -60 -40 -20 0 Depth [m] 1
Fig. 5. November 2005 survey of (a) MODIS 8-day mean (25 November–2 December) SST, (b) CTD SST, (c) 20-m temperature,
(d) thermocline depth, (e) temperature at 91.81W, and (f) temperature at 0.31N.
mean during the transition, which is also reflected in the ENSO anomaly (Fig. 2b). The EUC at 1101W is relatively weak (87 cm/s), and its core is 40 m below the thermocline. Above the thermocline, westward flow of the SEC is observed (Table 1). The thermocline shoals to the east, reaching20 m at 951W, and remains approximately at this depth across the archipelago.
The EF crosses the archipelago (Fig. 5a), with the SST (Fig. 5b) warmer (4241C) to the north
and cooler (o221C) to the south. The near surfacing of the thermocline west of Isabela is quite obvious in the SST (Fig. 5b), while Fig. 5c
shows cooler waters (o201C) south of the equator at 20 m. The depth of the thermocline (Fig. 5d) is shallow over the cooler waters found at 20 m, and deepens north of the equator. A transect at 91.81W (Fig. 5e) shows a strong lateral gradient within the EF, increasing 41C to the north. A transect at 0.31N (Fig. 5f) shows the thermocline slightly ARTICLE IN PRESS
Nov05 TS Diagram
Salinity
32 33 34 35 36
Temperature [C] 12 14 16 18 20 22 24 26 28 30
-92 -91.5 -91 -90.5 -90 -89.5 -89 Nov05 20-m Salinity
-1.5 -1 -0.5 0 0.5 1 1.5
-91.5 -91 -90.5 -90 -89.5 Longitude
Nov05 Salinity, 0.3 N
-80 -60 -40 -20 0 Depth [m]
-0.5 0 0.5 1 1.5 Latitude
Nov05 Salinity, 91.8 W
-80 -60 -40 -20 0 Depth [m]
-92 -91.5 -91 -90.5 -90 -89.5 -89 Nov05 Surface Salinity
-1.5 -1 -0.5 0 0.5 1 1.5 35 35.2 TSW ESW
Fig. 6. November 2005 survey of (a) SSS, (b) 20-m salinity, (c) salinity at 91.81W, (d) salinity at 0.31N, and (e) TS diagram.
shallower in the west nearing the cooler upwelling region.
Higher salinity at the surface and 20 m (Fig. 6a and b) generally corresponds to lower temperatures (r2¼0.46 and 0.83, respectively). Highest SSS
(S34.6) is west of Isabela, freshening to So33 towards the east and across the EF. The vertical sections at 91.81W and 0.31N (Fig. 6c and d) show upwelling of waters with S434.6 west of Isabela and strong gradients north and east across the EF,
where the SSS freshens. TSW cover much of the archipelago, with SST241C and SSSo34 (Fig. 6e), while pockets of ESW are found west of Isabela and south, where SSS is434 (Fig. 6a).
3.3. June 26– July 4, 2006 survey
The mean SST (Fig. 2a) is relatively low (241C) and the SE trades are strong (5 m/s), both close to their seasonal peaks respective to the Garu´a season. ARTICLE IN PRESS
-92 -91.5 -91 -90.5 -90 -89.5 -89 Jun06 Surface Temp [C]
-1.5 -1 -0.5 0 0.5 1 1.5
-92 -91.5 -91 -90.5 -90 -89.5 -89 Jun06 20-m Temp [C]
-1.5 -1 -0.5 0 0.5 1 1.5
-92 -91.5 -91 -90.5 -90 -89.5 -89 Jun06 Thermocline Depth [m]
-1.5 -1 -0.5 0 0.5 1 1.5 -95 -92 -89 -86 -83 -80
Jun06 MODIS SST [C]
-4 -2 0 2 4
-1 -0.5 0 0.5 1 Latitude
Jun06 Temp [C], 90.8 W
-80 -60 -40 -20 0 Depth [m]
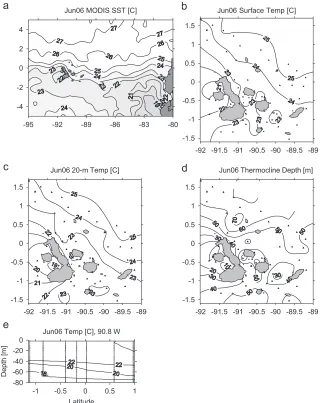
Fig. 7. June 2006 survey of (a) MODIS 8-day mean (26 June–3 July) SST, (b) CTD SST, (c) 20-m temperature, (d) thermocline depth, and
(e) temperature at 90.81W.
The SST is significantly (+1.21C) above its climatological mean (Fig. 2). The EUC at 1101W (Table 1) has a strong core velocity (146 cm/s) near the thermocline (62 m). This results in an eastward flow near the surface at 1101W. Heading east, the thermocline shoals to45 m at 951W and remains close to this depth across the archipelago.
The archipelago lies within the cold tongue, which reaches to the coastal upwelling zone off of the coast of South America (Fig. 7a). The SST (Fig. 7b) is highest (4251C) northeast, cooler towards the southwest, and coldest (o211C) within the upwelling zone west of Isabela. At 20 m, the structure is quite similar to that of the SST (Fig. 7c), as the thermocline (Fig. 7d) is very deep (450 m), except slightly shallower in the central archipelago and where it nearly surfaces west of Isabela. Unfortunately, because of mechanical problems, numerous stations were not sampled, prohibiting direct comparison to the transects at 91.81W and
0.31N shown for the other two surveys; a substitute transect composed of stations nearing 90.81W (Fig. 7e) shows a deep thermocline that shoals slightly from north to south.
The salinities at the surface and 20 m are nearly identical (Fig. 8a and b) due to a mixed-layer depth420 m, as discussed above by the deep thermocline depth. Higher salinity correlates with lower temperatures (r2¼0.73 and 0.65, respec-tively). Freshest waters (S34) are found towards the northeast and steadily increase to the southwest, reaching a maximum (S35.2) west of Isabela. The 90.81W transect (Fig. 8c) shows a vertically homo-geneous water column south of the equator with high salinity (S434.9) that lessens slightly at the surface towards the north. The TS diagram reflects the high salinity throughout the archipelago (Fig. 8d), indicating that the surface waters of the archipelago are dominated by a mixed layer of ESW.
ARTICLE IN PRESS
June 06 TS Diagram
Salinity
32 33 34 35 36
Temperature [C] 12 14 16 18 20 22 24 26 28 30 ESW -92 -91.5 -91 -90.5 -90 -89.5 -89
Jun06 Surface Salinity
-1.5 -1 -0.5 0 0.5 1 1.5
-92 -91.5 -91 -90.5 -90 -89.5 -89 Jun06 20-m Salinity
-1.5 -1 -0.5 0 0.5 1 1.5
-1 -0.5 0 0.5 1 Latitude
Jun06 Salinity, 90.8 W
-80 -60 -40 -20 0 Depth [m] TSW
Fig. 8. June 2006 survey of (a) SSS, (b) 20-m salinity, (c) salinity at 90.81W, and (d) TS diagram.
3.4. Biological response
The mean surface chlorophyll a (Chl a) values over the archipelago are 0.9270.70 mg/m3 for
March 2005, 0.9870.59 mg/m3 for November
2005, and 1.1671.06 mg/m3 for June 2006. No statistical differences were found between Chl a
levels within the ESW and TSW around the archipelago, although values were usually highest within the ESW west of Isabela. Schaeffer et al. (in review) report generally higher Chlawithin low SST, high SSS, and high, but a slightly reduced, surface nitrate. The relationship presented here (Fig. 9) compares the thermocline depth to surface Chlavalues for the three surveys (exponential decay fit, with r2¼0.21, 0.18, and 0.24). Although yielding statistically insignificant correlations, the relationships illustrate the tendency for increased Chlaover a shallow thermocline, a factor that helps explain Chlalevels in the eastern equatorial Pacific and the archipelago (Palacios, 2002).
4. Discussion
The results of the present study provide snap-shots of the surface water (480 m) properties over the archipelago during the hot and calm extremes of the wet season (December–April), the cooler and windier conditions of the Garu´a (May–November), and conditions transitioning between the two. The observed responses largely
reflect the annual cycle of the eastern equatorial Pacific (Yu and McPhaden, 1999; Johnson et al., 2002); they may also be modified by the ENSO cycle (Fiedler and Talley, 2006).
The March 2005 survey occurred near the peak of the wet season but may still be affected by the later stages of the weak 2004–2005 El Nin˜o, which ended the month prior. The March 2005 survey featured large rainfalls as a result of the close proximity of the ITCZ, resulting in TSW in the central portion of the archipelago (Fig. 4a). The EUC is strong and shallow, with its core near the thermocline (Table 1), which shoals to the east, nearly surfacing west of Isabela (Fig. 3b, d, and e). Within the archipelago, the thermocline is20-m deep and is indicative of eastward flow of the EUC, or at least reflects the distribution of its upwelling. ESW with a SSS35.2 west of Isabela (Fig. 4a) define the maximum value of the EUC (Fig. 4e), butS434.9 appears more suggestive of the EUC’s presence within the archipelago (Fig. 4c). Fig. 4a reveals a large, shallow plume of ESW with SSS434.9 in the TS diagram (Fig. 4e). This feature is indicative of upwelling that has occurred somewhere towards South America, with the upwelled waters being advected westward with the SEC into the eastern portion of the archipelago. This idea is supported in
Fig. 4d, where both the surface and 80-m depth are shown to haveS434.9 at89.51W.
The November 2005 survey occurred during a transition from the Garu´a to the wet season. Conditions are intermediate in terms of the annual cycle (Fig. 2a) and cool with regards to ENSO (0.51C). As the SE trades are still moderately strong, surface currents are of the westward SEC at 1101W. Beneath the thermocline, a relatively weak and deep EUC core is observed (Table 1). With stronger winds during this seasonal transition period, there is a greater evaporative cooling (Xie, 1994) and Ekman divergence, which produce a regionally pronounced cold tongue and EF that crosses the archipelago (Fig. 5a). ESW are found west of Isabela, where the EUC upwells and raises the SSS; ESW are also found south of Isabela, more so where the thermocline is shallow. The remainder of the archipelago is covered by TSW (Fig. 6e) that originate in the fresher NECC, which is strongly developed during this time of year (Kessler, 2006). Salinity 434.9 in the TS diagram (Fig. 6e) is the EUC, which consistently maintains a depth430 m across the archipelago (Fig. 6c and d). The reduced SSS west of Isabela and across the archipelago as ARTICLE IN PRESS
Thermocline Depth [m]
0 10 20 30 40 50 60 70
Chl a [mg/m 3] 0 2 4 6 8 10 Mar05 Nov05 Jun06
Fig. 9. Depth of thermocline vs. Chlafor the three surveys.
compared to March 2005 is indicative of a less vigorous EUC, which is deeper and upwells less, but is also fresher because of a reduced transport within the thermocline during the late fall (Johnson et al., 2002). It should be noted that the SST recorded by the TRMM satellite revealed limited TIW activity (Legeckis, 1977), though substantially less than the seasonal maximum of September–October 2005. Because of this, it is possible that some of the mean values reported here could be slightly aliased by the physical processes of the 20-day periodicity associated with TIW activity along the equator (Halpern et al., 1988).
The June 2006 survey is interesting in that its winds (5 m/s) are the highest, while its SST has a value between those of the other surveys (Fig. 2a); yet both quantities are near their annual maximum and minimum, respectively, typical of the Garu´a season. The reason may be related to the forth-coming 2006–2007 El Nin˜o that diminishes the ensuing annual cycles. Already, the mean SST is significantly (+1.21C) above climatology in the archipelago (Fig. 2b). The EUC characteristics at 1101are similar to those of March 2005, when it had a strong core velocity centered near the thermocline. Different is the tilt of the thermocline during June 2006 (March 2005), whose depth of 67 m (83 m) at 1101W shoals to only 45 m (30 m) at 951W, where it remains centrally throughout the archipelago, ex-cept west of Isabela. It is assumed that the eastward EUC flows above the thermocline within the archipelago, similar to the March 2005 survey. The SSS maximum of 35.2 west of Isabela (Fig. 8a) is of the EUC (Fig. 7d). The strong signature of the ESW within the TS diagram reflects the salt content of the eastward-flowing EUC as well as the SEC flowing above it, which would be composed largely of the same EUC/thermocline waters upwelled somewhere east of the archipelago and warmed slightly at the surface.
5. Conclusions
Surface water properties of the Gala´pagos Archi-pelago reflect the degree that TSW and ESW are formed within and delivered to the archipelago. Tropical Surface Waters (SSSo34) form when rain-fall locally increases as the ITCZ nears, or when largely diluted by the relatively fresh waters of the NECC. Tropical Surface Waters partially covered the archipelago during March 2005 from large rain inputs and substantially during the November 2005
survey from large inputs of NECC waters. Equatorial Surface Waters (SSS434) will emerge when the EUC is strongly developed to the west, the thermocline/ EUC upwells locally by topographic blockage of the EUC, or within the cold tongue to the east, which advects west within the SEC into the archipelago. Conversely, ESW may be more prevalent when the sources of fresher water are removed, i.e., when the ITCZ/rainfall migrates northward or in the spring when the NECC is weak (Kessler, 2006). Equatorial Surface Waters were present because of a combina-tion of all these processes in June 2006, as well as in the March 2005 survey, but large rainfalls introduced TSW to the central archipelago during this survey. The results of this project are unique to the Gala´pagos but largely follow with the annual hydrography and circulation patterns for the eastern equatorial Pacific (Yu and McPhaden, 1999;Johnson et al., 2002;Fiedler and Talley, 2006;Kessler, 2006). The ENSO cycle and TIW activity are both capable of modifying the annual cycle of the surface properties within the archipelago; however, further work needs to be performed in order to better quantify locally these responses.
Upwelling was observed consistently west of Isabela, attributed to the topographic blockage of the EUC. In addition, a relatively shallow thermo-cline is maintained centrally within the archipelago, usually south of the equator. Linear extrapolation of the thermocline depth along the equator from 110 to 951W gives a good approximation of the thermocline depth within the archipelago from 92 to 891W. Without direct current measurements, distinguishing the EUC flow path is difficult, although the thermocline is a good indicator of its thermal influence and locations of its upwelling. Fluctuations that occur have consequences in both the vertical and horizontal. Vertical thermocline fluctuations deliver nutrients (iron) that influence the primary production at the surface (Palacios, 2002), while horizontal thermocline fluctuations are important to recruitment and the maintenance of cold-water and productive environments, such as those in the western archipelago associated with highest fish endemism (Edgar et al., 2004). There is difficulty attributing Chlaconcentrations about the archipelago to any of the measured physical parameters, although higher Chl a values were measured over shallow thermoclines. The difficulty may stem from the uncoupling between the SEC and its Chlaexpression and between the EUC and its nutrient supply (Palacios, 2004).
ARTICLE IN PRESS
Acknowledgments
This project was supported by NASA’s Biodi-versity and Ecological Forecasting grant NNG04GL98G, Counterpart US-AID no. 518-A-00-03-00152-00 to the Charles Darwin Research Station and UK Darwin Initiative project no. 14-048. We would like to thank the Gala´pagos National Park (GNP) Marine Resources Head Mario Piu, the GNP Science Coordinator Eduardo Espinoza, the GNP Science Consultant Godfrey Merlen, the captain and crew of the M/N Sierra Negra, and the scientific dive team from CDRS, Marianna Vera, Marco Tosca, Julio Delgado, Natalia Tirado, Roberto Pepolas, and Diego Ruiz. Lastly, we thank William Kessler and two anon-ymous reviewers for their constructive comments.
References
Bustamante, R., Collins, K.J., Bensted-Smith, R., 1999. Biodi-versity conservation in the Gala´pagos Marine Reserve. Entomologie Supplement 68, 45–52.
Eden, C., Timmermann, A., 2004. The influence of the Gala´pagos Islands on tropical temperatures, currents and the generation of tropical instability waves. Geophysical Research Letters 31, L15308.
Edgar, G.J., Banks, S., Farina, J.M., Calvopina, M., Martınez, C., 2004. Regional biogeography of shallow reef fish and macro-invertebrate communities in the Gala´pagos Archipe-lago. Journal of Biogeography 31, 1107–1124.
Feldman, G.C., 1986. Patterns of phytoplankton production around the Gala´pagos Islands. In: Bowman, M.J., Yentsch, C.M., Peterson, W.T. (Eds.), Tidal Mixing and Plankton Dynamics. Lecture Notes on Coastal and Estuarine Studies, vol. 17. Springer, Berlin, pp. 77–106.
Feldman, G., Clark, D., Halpern, D., 1984. Satellite color observations of the phytoplankton distribution in the eastern equatorial Pacific during the 1982–1983 El Nin˜o. Science 226 (4678), 1069–1071.
Fiedler, P.C., Talley, L.D., 2006. Hydrography of the eastern tropical Pacific: a review. Progress in Oceanography 69 (2–4), 143–180.
Halpern, D., Knox, R.A., Luther, D.S., 1988. Observations of 20-day period meridional current oscillations in the upper
ocean along the Pacific equator. Journal Physical Oceano-graphy 18, 1514–1534.
Houvenaghel, G.T., 1978. Oceanographic conditions in the Gala´pagos Archipelago and their relationships with life on the islands. In: Boje, R., Tomczak, M. (Eds.), Upwelling Ecosystems. Springer, Berlin, pp. 181–200.
Houvenaghel, G.T., 1984. Oceanographic setting of the gos Islands. In: Perry, R. (Ed.), Key Environments, Gala´pa-gos. Pergamon Press, Oxford, pp. 43–54.
Johnson, G.C., Sloyan, B.M., Kessler, W.S., McTaggart, K.E., 2002. Direct measurements of upper ocean current and water properties across the tropical Pacific during the 1990s. Progress in Oceanography 52, 31–61.
Kessler, W.S., 2006. The circulation of the eastern tropical Pacific: a review. Progress in Oceanography 69 (2–4), 181–217.
Knauss, J.A., 1960. Measurements of the Cromwell Current. Deep-Sea Research 6, 265–286.
Legeckis, R., 1977. Long waves in the eastern equatorial Pacific Ocean: a view from a geostationary satellite. Science 197, 1179–1181.
Palacios, D.M., 2002. Factors influencing the island-mass effect of the Gala´pagos Islands. Geophysical Research Letters 29 (23), 2134.
Palacios, D.M., 2004. Seasonal patterns of sea-surface tempera-ture and ocean color around the Gala´pagos: regional and local influences. Deep-Sea Research II 51, 43–57.
Philander, S., 1978. Instabilities of zonal equatorial currents— Part 2. Journal of Geophysical Research 83, 3679–3682. Steger, J.M., Collins, C.A., Chu, P.C., 1998. Circulation in the
Archipelago de Colon (Gala´pagos Islands), November 1993. Deep-Sea Research II 45, 1093–1114.
Willett, C.S., Leben, R., Lavin, M.F., 2006. Eddies and mesoscale processes in the eastern tropical Pacific: a review. Progress in Oceanography 69 (2–4), 218–238.
Wyrtki, K., 1966. Oceanography of the eastern equatorial Pacific Ocean. Oceanography and Marine Biology Annual Review 4, 33–68.
Wyrtki, K., 1981. An estimate of equatorial upwelling in the Pacific. Journal of Physical Oceanography 11, 1205–1214. Wyrtki, K., Kilonsky, B., 1984. Mean water and current structure
during the Hawaii-to-Tahiti shuttle experiment. Journal of Physical Oceanography 14, 242–254.
Xie, S.P., 1994. Oceanic response to the wind forcing associated with the Intertropical Convergence Zone in the northern-hemisphere. Journal of Geophysical Research—Oceans 99, 20393–20402.
Yu, X.R., McPhaden, M.J., 1999. Seasonal variability in the equatorial Pacific. Journal of Physical Oceanography 29, 925–947.
ARTICLE IN PRESS
Chapter 2
Tropical Instability Wave Interactions within the Galápagos Archipelago
W.V. Sweeta,*, J.M. Morrisonb, D. Kamykowskia, B.A. Schaefferc, S. Banksd
a
North Carolina State University, Dept. of Marine, Earth & Atmospheric Sciences, Raleigh, NC, USA
b
University of North Carolina Wilmington, Dept. of Physics & Phys. Oceanography, Wilmington, NC, USA
c
US Environmental Protection Agency, Gulf Ecology Division, Gulf Breeze, FL USA
d
Charles Darwin Research Station, Galápagos Islands, Ecuador
Submitted for Publication
Deep-Sea Research I
Chapter 2
Tropical Instability Wave Interactions within the Galápagos Archipelago
Abstract
In the boreal fall of 2005, the effects of tropical instability waves (TIW) appear as oscillations within the sea surface temperature (SST), meridional current (Vy), and thermocline (20°C) in the eastern equatorial Pacific. The Vy oscillations of the equatorial front (EF) by the TIW are observed in the SST at 0°, 110°W, but not at 0°, 95°W, where the SST changes concurrently to changes in the thermocline depth. Within the Galápagos Archipelago, a strong 3-wave succession of TIW in Sep and Oct 2005 registered large 15-day period oscillations in temperature and water level time series recorded at a 5-m depth at four mooring locations. Upwelling speeds of ~5.0 m day-1 are estimated for the central archipelago during the TIW, dropping temperatures by ~7°C within a week. A significant biological response to the TIW is observed throughout the archipelago. Coincident with coldest temperatures, the chlorophyll a (Chl a) increased across the archipelago by 25 – 40%
above its 2004 – 2006 mean and nearly 25% above its 1998 – 2007 mean. The much larger Chl a levels near/within the archipelago as compared to 95° and 110°W implicate that the
island platform itself further iron-enriched the upwelling waters.
Introduction
Tropical instability waves (TIW) are westward-propagating oscillations common July – February during non-El Niño conditions (Contreras 2002). In the eastern Pacific, TIW are readily observed in the sea surface temperature (SST) along the Equatorial Front (EF) (Legeckis 1977). In-situ measurements further refine TIW as oscillations with periods of 15-23 (~17) days detectable ±2° of the equator and of 28-35 (~33) days found ~5°N (Lyman et al. 2007). The ~17-day TIW has strong meridional current (Vy) oscillations that
(SECN) and the eastward Equatorial Undercurrent (EUC) just north of the equator (Luther and Johnson 1990; Qiao and Weisberg 1995). Prior studies (Halpern et al. 1988; Qiao and
Weisberg 1995; Lyman et al. 2007) along the equator between ~150° and 95°W contribute
to the following description of the ~17-day TIW. Oscillations of the Vy occur mainly ±1° of the equator and are strongest within the surface layer and decrease rapidly towards the EUC/thermocline (20° isotherm). The vertical penetration of the oscillation decreases to the west as does the wave period. The Vy at the equator are associated with oscillations within the subsurface temperature between ~2°S and 2°N. Downwelling (upwelling) occurs north (south) of the equator when Vy is northward, and the opposite conditions occur when Vy is southward. The off-equator temperature response lags the Vy at the equator by ~90° and is opposite across its latitudinal scale.
Within the high-nutrient, low-chlorophyll (HNLC) conditions of the iron-limited, equatorial Pacific (Martin et al. 1991), upwelling supplies the surface waters with
iron-saturated waters from the EUC core (Barber et al. 1996). Upwelling within 17- and 33-day
TIW can reach speeds >10 m day-1 (Kennan and Flament 2000; Weisberg and Qiao 2000; Menkes et al. 2006), contributing to areas with elevated primary production and chlorophyll
a (Chl a) values an order of magnitude greater than the ~0.2 µg l-1 baseline for the equatorial
Pacific (Murray et al. 1994; Foley et al. 1997; Strutton et al. 2001). These rate changes also
affect the zooplankton and higher tropic levels as well (Murray et al. 1994; Roman et al.
1995; Menkes et al. 2002). The heightened biological processes have been observed most
often in regions of strong Vy and SST gradients making convergent (Yoder et al. 1994;
Chavez et al. 1999; Kennan and Flamment 2000) and divergent (Strutton et al. 2001) zones
of the TIW. There is some doubt as to whether there is an annual mean stimulus to the Chl a
concentrations by TIW. Gorgues et al. (2005) actually estimates that there is a net 10%
decrease in Chl a near the equator where the meridional advection of TIW are ~5 times
greater than their vertical advection, diluting the upwelled inputs with the oligotrophic waters from north of the EF.
Long-term concentrations of Chl a in the equatorial Pacific are consistently higher
EUC with the island platform (Feldman 1986; Gordon et al. 1998; Steger et al. 1998;
Palacios 2002). Surface levels of Chl a diminish eastwards across the archipelago (Lindley
and Barber 1998) because the SECN is iron limited when it enters the archipelago (Gordon
et al. 1998). There are “hot spots” with high Chl a concentrations often near north and
south-facing sides of the individual islands (Schaeffer et al. Accepted) and/or in areas with a
shallow thermocline (Palacios 2002; Sweet et al. 2007). Inter-annual changes of the El Niño
Southern Oscillation (ENSO) can alter the spatial patterns of EUC upwelling and Chl a
concentrations throughout the archipelago, as happened at the climax of 1982-83 El Niño (Feldman et al. 1984). Annually, the Chl a increases within the archipelago when the cold
tongue magnifies in the latter half of the year (Palacios 2004). Short-period (<10 min) and intense (0.3 m s-1) upwelling can cause large (9°C) temperature variability along island walls that enhance larval recruitment of benthic invertebrates, but are too short to affect surface biomass (Whitman and Smith 2003).
Quantifying the mechanisms responsible for the observed phytoplankton biomass in the Galápagos is important since it feeds the archipelago’s biodiversity. Current assessments of the underwater communities are providing baseline information used to create complex mass-balance tropic models (Okey et al. 2004) to improve the predictive
efforts by managers of the Galápagos Marine Reserve (GMR) under changing environmental conditions. In this study, we utilize remote and in-situ observations to assess the vertical pumping associated with the ~17-day TIW from 110°W east into the Galápagos Archipelago. Specifically, the study highlights the passage of three prominent TIW from Aug 28 and Oct 13, 2005 and the biological response they create near and within the archipelago.
Data
the three successive TIW from Aug 28 to Oct 13, 2005 that created large temperature oscillations. The YSI WL (temperature) sensors have a resolution of 0.001 m (0.01°C) and accuracy of ±0.02 m (±0.15°C). Hourly data has been lowpass filtered (half power period = 38 hours), and unless otherwise stated, the presented data has been bandpass filtered (10- and 40-day period passed) to highlight TIW dynamics. Additional time series include daily ocean currents, thermocline depth, SST and dynamic height (DH) data from the Tropical Atmosphere Ocean (TAO) array along the equator at 110° and 95°W. The TAO data were similarly bandpass filtered. Power spectrum density (PSD) estimates of the time series were performed using the multitapering MATLAB function PMTM with the time bandwidth parameter NW set to two (Mathworks 2007). Standard 95% confidence intervals for the spectra were computed using the chi-squared approach and all peaks referred to in the text achieve the 95% level.
Wind and SST data were obtained from the Physical Oceanography Distribution Active Archive Center’s (PO.DAAC) Ocean Earth Science Information Partner (ESIP) Tool (POET). Mean monthly Reynolds/NCEP (NCEP) SST (1°) and its anomaly from a 25-year mean (Reynolds et al. 2002) and a monthly mean of daily winds (0.25°) from NASA’s
microwave scatterometer (QSCAT) were averaged between 2°N and 2°S and between 92° and 88°W to provide a climatological setting for the Galápagos. Mean 8-day, longitudinal vs. time SST (NCEP) anomalies were averaged between 1° and 2°N. This data was bandpass filtered zonally (444-km and 2220-km cutoff) from 150° to 90°W to produce a time vs. longitude plot (Hovmoller diagram) to quantify the TIW propagation. The ENSO SST anomalies from Niño region 3.4 (5°N-5°S, 170°-120°W) were obtained from the National Oceanic and Atmospheric Administration (NOAA) Climate Prediction Center.
In addition, 3-day mean snapshots of the SST (0.25° resolution) were obtained from the Advanced Microwave Scanning Radiometer (AMSR-E) satellite to provide a clear image of the TIW features. Eight-day composites of Chl a (0.1° resolution) from the Sea-viewing
Wide Field-of-view Sensor (SeaWiFS) were obtained from Giovanni. Mean Chl a is
(0.5°N-1°S, 91.2°-89.7°W) zone. In addition, Chl a is computed within a 1° box around the
TAO buoy locations on the equator (i.e., 0.5°N-0.5°S, 95.5°-94.5°W). The Chl a valuesare
temporally centered in their 8-day composites, and the values have been averaged for 1998 – 2007 (10-yr) and 2004 – 2006 (3-yr) periods to provide long-term means. Water-column profiles in the archipelago were obtained by the Argo project.
Results
The annual cycle of the monthly mean (92°-88°W, 2°N-2°S) of SST and meridional winds (Vy) is shown in Fig. 2. Mean Vy winds are maximum (~6 m s-1) and the SST is minimum (~22°C) in the boreal summer/fall. Opposite conditions generally occur in the winter/spring. Also shown in Fig. 2 is the SST anomaly of the El Niño Southern Oscillation (ENSO) within region 3.4 (5°N-5°S, 170°-120°W). The 5-year ENSO SST anomaly shows a few El Niño events and the absence of any cool La Niña events. A mild El Niño ended in early 2005, and the region continued to cool throughout 2005, reaching a -0.8° anomaly by the year’s end (although not classified as a La Niña). Warming occurs at the start of 2006 and becomes a classified El Niño by August 2006.
The SST images (Fig. 3a) show the EF stretching from the South American coast across the archipelago and into the central equatorial Pacific where the TIW oscillations become accentuated. Time series from Jun 2005 through Feb 2006 show oscillations ±4° of the equator in the SST (http://www.remss.com) and ocean color (http://oceancolor.gsfc.nasa.gov). The SST oscillations are most notable Sep through Nov 2005 near the Galápagos, and this study focuses primarily on that period. A Hovmoller diagram (not shown) of the SST anomaly indicate westward TIW with a ~48km day-1 phase speed and a range of wavelengths from 900 to 1400 km and periods of 19 to 29 days in Sep and Oct 2005.
peaks at ~20.5 days at 110°W and ~16.5 days at 140°W (Fig. 4a). In-situ measurements at 0°, 110°W show the water column response to the TIW Vy oscillations (Fig. 5). Data gaps occurred when some of the in-situ sensors stopped reporting. Northward (southward) Vy oscillations lag by ~5 days the upwelling (downwelling) of the thermocline, which changes by ~40 m, or ~3.5 m day-1. Concurrent to the thermocline rise (fall) is a ~9 dyn-cm increase (decrease) in the DH of the upper 500 m of the water column. The changes in the SST decrease (increase) ~3°C nearly simultaneous with the northward (southward) Vy oscillations. The mean Chl a at 0°, 110°W steadily decreases from ~0.4 ug l-1 in August,
which is a remnant of the large-scale equatorial bloom (Ryan et al. 2006) and oscillates ±
0.06 µg l-1 in Oct 2005 close to its 3-yr and 10-yr means of 0.23 and 0.25 µg l-1, respectively.
At 0°, 95°W, the TIW produce a series of 14 to 17 (~16) day oscillations in the SST, highlighted by the 16-day peak in the PSD for Jun 2005 – Mar 2006 (Fig. 4b). The SST changes are concurrent to the thermocline/DH oscillations (Fig. 6a). For example, from Sep 23 – Oct 1, 2005, the SST drops from ~24°C to 19°C. The thermocline (unfiltered daily values, not shown) upwells from 40 (25) to 15 (0) m, or ~3.1 m day-1, lowering the DH by ~4 dyn-cm. During the TIW, the daily SST was often <20°C indicating that the thermocline had surfaced. However, the mean adjustment from the bandpass data shows the thermocline below the surface during these periods (Fig. 6a). Oscillations of the daily values of the 18°C isotherm at this location confirm upwelling of ~25 m over the same period (not shown).
at Isabela are largely concurrent to those of the SST at 95°W. The WL oscillates <6 cm and leads the temperature by ~4 days in Sep 2005, but often the two signal are fairly concurrent. The PSD of WL at Isabela has a peak at ~13.5 days for Jun to Dec 2005 period, though it is less pronounced than Santiago (Fig. 4b).
Three temperature and salinity profiles (Figs. 7a, b) were made during the passage of the TIW in Sep 2005 by Argo drifters in the archipelago near Santiago and Wolf (Fig. 1). Two profiles captured water-column conditions slightly south (Sep 8) and north (Sep 11) of the EF near the warm peak of a TIW (Fig. 6b). The Sep 8 (Sep 11) profile indicates a deep layer below ~50 m (30 m) with a temperature <16°C (16°) and salinity of ~35.05 (34.95) that mixes into a ~20-m (10-m) thick surface layer with a temperature of 21°C (25°) and a salinity of 34.6 (33.8). Lowpass temperatures similar to the Sep 8 (Sep 11) profile are reported at Santiago (Wolf and Genovesa) in Fig. 6b. A later profile occurred on Sep 18 near Santiago and the very close to the Sep 8 profile. The Sep 18 profile was south of the EF like the Sep 8 profile, but it happened during the subsequent cold peak of the TIW. The Sep 18 profile indicates upwelling of the deeper layer to ~20 m and whose SST of ~17°C is also reported at Santiago (Fig. 6b). Upwelling rates are estimated by the vertical excursion of the pre (post) isotherm structure of the Sep 8 and 11 (Sep 18) profiles as determined by the 7-day drop in temperature at each YSI location between the warm (Sep 11) and the cold (Sep 18) peak of the TIW. The lowpass temperature change (mean isotherm excursion, upwelling rate) at a 5-m depth at Santiago is ~24° to 17°C (35 m, ~5.0 m day-1), at Genovesa ~25° to 19°C (25 m, ~3.5 m day-1), and at Wolf ~25.4° to 22.4°C (20 m, ~2.9 m day-1). Upwelling rates near Isabela are not estimated since the temperature series (Fig. 6a) are much below the range reported in the Argo profiles.
Large increases of Chl a are observed near/within the archipelago coincident with
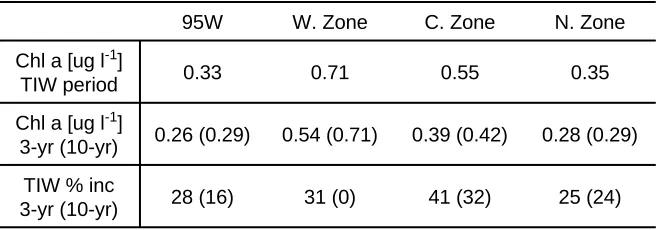
the cold peaks of the TIW (Figs. 6b, 7c). Table 1 gives the mean of the SeaWiFS Chl a
values within the Aug 28 to Oct 13, 2005 (1.5-month) period when three prominent TIW passed over the archipelago. Also listed are the 3-yr and 10-yr means to compare the TIW-related contribution to the long-term Chl a levels. Highest Chl a (~1.03 µg l-1) occurs in two
three peaks to ~0.72 µg l-1 in early Oct 2005, and its 1.5-month mean of 0.55 µg l-1 is a 41% (32%) increase over its 3-yr (10-yr) mean. In the northern zone, Chl a initially rises to ~0.5
µg l-1 at the start of Sep 2005 and declines; its 1.5-month mean of 0.35 µg l-1 is a 25% (24%) increase over its 3-yr (10-yr) mean. At 95°W, the increase of Chl a happens later and it
oscillates less, rising to ~0.4 µg l-1 in early Oct 2005; its 1.5-month mean of 0.33 µg l-1 is a 28% (16%) increase over its 3-yr (10-yr) mean.
Discussion
The relatively cold ENSO conditions in the latter half of 2005 (Fig. 2) favor a pronounced TIW season (Contreras 2002), as was observed in the eastern equatorial Pacific starting in late Aug 2005. Images of the SST show large undulations of the EF that repeatedly cross over the Galápagos Archipelago (Fig 3a). The TIW propagate westward at ~48 km day-1 as quantified by a Hovmoller diagram of the SST, which may contain features of both the ~17 and ~33-day oscillations (Lyman et al. 2007) and may explain the range of
computed periods (~19 to 29 days) and wavelengths (~900 to 1400 km). Of more interest to this study are the in-situ measurements of the TIW, such as the strong (0.75 m s-1) meridional currents (Fig. 3b) and their prominent ~20.5 (~16.5) day oscillations at 0°, 110°W (140°) in Fig. 4a, which are very similar to past studies (Halpern et al. 1988; Qiao
and Weisberg 1995; Lyman et al. 2007).
It is evident that TIW-induced flows result in a combination of vertical and meridional responses. At 0°, 110°W, the SST signal is largely regulated by and concurrent to the Vy oscillations, both of which lag ~5 days (~90°) the ~3.5 m day-1 upwelling (downwelling) of the thermocline (Fig. 5). Such a response is typical for an area exposed to large meridional oscillations of the EF, and is analogous to the 90° phase lag of SST to the sea surface height (SSH) observed in satellite data of TIW (Polito et al. 2001; Pezzi et al.
Within the Galápagos Archipelago, the remote SST images do not resolve the TIW motions, but the in-situ measurements do and indicate the presence of both a meridional and vertical response. The oscillations of the 5-m temperature signal at Isabela (Fig. 6a) are nearly concurrent to the SST 95°W, though are much colder (~15°C) and indicative of the EUC. The WL signal at Isabela occasionally leads its temperature signal, and sometimes is nearly concurrent. The phase changes between the signals might reflect the meridional motion of the EUC that cause a topographic shift in its upwelling intensity. Within the interior of the archipelago (Fig. 6b), the ~15-day swings in temperature are largest (~7°C) centrally near Santiago and are slightly diminished at Genovesa and Wolf. The WL oscillations at Santiago lead the temperature and unlike at 95°W, affirm the presence of the north/south oscillations of the SST gradient (EF) within the archipelago.
It was fortuitous that a number of Argo profiles occurred near the moored sensors at Wolf and Santiago during the passage of the TIW (Fig. 1). The profiles establish the water-column conditions before and after the passage of a TIW and help determine the extent of localized upwelling that occurred. The Argos profiled slightly north (Sep 11) and south (Sep 8) of the EF near a warm peak of a TIW and south of the EF (Sep 18) during a subsequent cold peak at a location close to the Sep 8 profile (Figs. 7a, b). Maximum upwelling speeds of ~5.0 m day-1 are estimated near Santiago during passage of the TIW. The upwelling estimates from isotherm excursions are only approximate since there is uncertainty of the contribution to the vertical profile by Vy advections. It is clear, though, from the isohaline structure of the Sep-18 profile that the deep layer with salinity (temperature) of ~35 (16°C) has upwelled from ~50 m to ~18 m, and that this water is attributable to the EUC (Sweet et al. 2007).
Large Chl a peaks are observed within the archipelago coincident with the
cold-water peaks of the TIW that passed between August 28 and Oct 13, 2005 (Fig. 7c). The zones to illustrate the SeaWiFS data are somewhat arbitrary, but the spatial response of the Chl a further supports localized TIW upwelling (Table 1). For instance, in the northern
archipelago there exists a stronger stratification, warmer temperatures (Wolf lowpass data >21°C), and weaker oscillations from the TIW (Fig. 6b). The smaller Chl a response in the
production. Any southward meridional advection of Chl a from the north during the TIW
oscillations could not have caused the much greater Chl a response in the central zone.
Also, the Chl a response in the western zone is similar to the central zone, but is ~0.3 µg l-1
greater. This trend also occurs under normal flow conditions, stimulated by the topographic upwelling of iron by the EUC west of Isabela (Feldman 1986; Palacios 2002). Normal during high TIW activity are strong southeasterly trade winds and the presence of the westward SECN, which would inhibit an eastward advection of high Chl a into the central
archipelago fromthewest of Isabela.
The 10-yr (1998 – 2007) mean concentration of Chl a increases from 110°W to the
archipelago near the equator, as does the 1.5-month (Aug 28 – Oct 13, 2005) mean during the passage of the TIW. The long-term trend is attributed to the eastward rise of the thermocline/EUC that feeds the surface divergence in the cold tongue and its high Chl a
levels. The short-term trend during the TIW simply accentuates the likelihood and frequency of surface exposure to the EUC/thermocline towards the east under comparable upwelling conditions (>3 m d-1). However, the disproportionate Chl a response within the
archipelago when compared to 95°W distinguishes the importance of upwelling that occurs specifically within the bounds of the archipelago platform. For instance, at 95°W the daily SST and sea surface salinity (SSS, not shown) on Sep 8 and 18 are 21°C and 34.6 and 18.7°C and 35.0, respectively. These values are nearly identical to the Argo profiles (Figs. 7a, b) and lowpass temperatures at Santiago for the same days (Fig. 6b). The argument could be made that surface waters at 95°W and Santiago are largely of the same water mass, whose temperature (<20°C) and salinity (~35) on Sep 18 are characteristic of the EUC surface (~20°C) at 110°W. Yet the Chl a response is remarkably different, and substantially
higher along the western and within the central zones of the archipelago (Fig. 7c). It is supposed that the vertical pumping of the TIW upwelled waters of the EUC to the surface in both locations, but the iron enhancement from the archipelago spurred a greater Chl a


![Figure 1: Bathymetry [m] of the Galápagos Archipelago, time series locations,](https://thumb-us.123doks.com/thumbv2/123dok_us/1567599.1192698/43.612.131.521.87.428/figure-bathymetry-m-galapagos-archipelago-time-series-locations.webp)
