GraphTiles: Visualizing Graphs on Mobile Devices
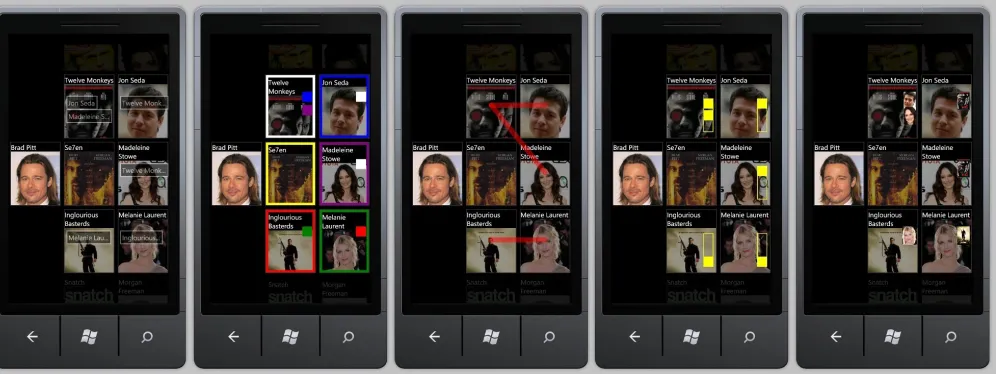
Figure 1: Different explicit link representations forGraphTiles. (a)text: nodes with the same name are linked. (b)color:nodes with the same color are linked. (c)connectedness:nodes with lines between them are linked. (d)proximity:nodes at/containing the same vertical position are linked. (e)texture:nodes with/containing the same image are linked.
ABSTRACT
Our society will soon generate and consume over one zettabyte of information each year [1]. A great deal of this information is con-sumed using mobile devices, which unlike PCs are always with us. We often use mobile devices to explore graphs: for example IMDb [2] links movies to actors to movies, Pandora [4] links songs to artists to songs, and LinkedIn [3] connects professionals. Existing techniques for graph visualization are not a good fit for mobile de-vices, which have very limited input and output surfaces, and which typically support light interactions like casual browsing or answer-ing fairly specific questions. In this paper, we introduce Graph-Tiles, a visual interface supporting mobile information seeking be-havior on graphs. Starting from a central location accessed using search,GraphTileslets users browse the surrounding graph neigh-borhood. It displays nodes using small thumbnails or icons, and arranges them into a gridded layout with each column representing an increasing number of links away from the central location. As a testbed for design and evaluation, we used IMDb. Our design study evaluated several explicit link representations, finding that lines support information seeking better than other representations. Our summative evaluation found that users can find information much more quickly withGraphTilesthan with IMDb’s mobile site. IMDb’s movie-to-actor graph is bipartite. To demonstrate Graph-Tiles’ use with a non-bipartite graph, we also show visualizations of the Seattle Band Map’s [5] band-to-band graph.
Index Terms: K.6.1 [Management of Computing and Information Systems]: Project and People Management—Life Cycle; K.7.m [The Computing Profession]: Miscellaneous—Ethics
1 INTRODUCTION
The majority of new computing devices sold are smartphones [6, 7]. Much of the information accessed with these mobile de-vices is in graph format, including IMDb (movies to crew), Pandora (songs to artists) and Facebook (friends to friends). Most graph vi-sualizations using nodes and links or matrices are not designed for mobile usage scenarios, which include small display and input sur-faces and distracting settings.
GraphTilesis a graph visualization technique for mobile scenar-ios, carefully designed to strike a good compromise between sev-eral often conflicting mobile constraints. As with most other mo-bile apps, these constraints argue for an overall simplicity that is reflected inGraphTiles’ layout (Figure 1), which visualizes only an incomplete portion of a local graph neighborhood: the central node alone in the left column, some nodes one link away in the mid-dle column, and other nodes two links away in the right column. To see the complete neighborhood, users can scroll the central and right columns vertically.
While this layout by itself implies many links, it does not in-dicate exactly where the links are between the second and third columns. Users can reveal these locations by selecting a node from these columns, triggering aninteractive reorderingthat highlights nodes linked to the selection and places them onscreen or nearly so. Users can restore the original (better known) order by deselecting the node, or to increase link visibility,GraphTilescan display links explicitly, when linked nodes are both onscreen. We tested several explicit link representations, finding that a simple line worked best, despite any confusion introduced by link crossings.
behav-ior, finding that users found information faster withGraphTilesthan than with IMDb’s own mobile web interface.
IMDb is a largely a bipartite graph, with movies linking only to crew members and vice versa. GraphTilesquite appropriately exploits this in its interface, putting movies in one column, crew in the next, and assuming that there are no links between nodes in the same column. When graphs are not bipartite, representing within-column links explicitly is awkward at best. We generalize GraphTilesto all graphs by relying on interactive reordering alone, and demonstrate this with a second database, the Seattle Band Map. While GraphTiles is not a complete replacement for existing graph visualizations, we believe it provides useful support in mobile device usage scenarios. To our knowledge it is unique, and may be worth examining for use in less distracting settings, and with larger devices.
2 CONSTRAINTS FOR MOBILE VISUALIZATION
Before designing GraphTiles, we carefully considered the con-straints of mobile usage. First, mobile devices are little enough to fit in users’ pockets, so visual features on their displays will be harder to see than they would be on desktop displays. Add in glare, instability, distraction and grime, and it is clear that mobile visu-alizations shoulddisplay information efficiently, and filter to main-tain clarity. Second, mobile input is dominated by touch, and given small mobile displays, navigating and filtering interactions are cru-cial. This makes mobile visualization still more difficult, since information display must not only be clear and succinct, but also afford touch interaction, requiring interface elements much larger than mice do. Third, given all the interaction mobile users need to see their data, mobile visualization mustmaintain visual continuity. Fortunately, users know that finding information with mobile devices is more difficult than with desktop machines, and have adapted their use of mobile devices accordingly. Both Cui and Roto [10] and Church and Oliver [9] found that mobile users effectively limit their expectations by posing either fairly specific queries or ex-tremely broad ones. Browsing can easily satisfy very broad queries, while search can quickly answer very specific queries.
However, Lee et al. [14] point out that human queries are often ill-formed and refined iteratively on the basis of intermediate query results. In a typical case, a user knows what they seek, but does not know the keyword that would retrieve it. Some search engines offer partial solutions by showing auto-completed keyword sets in real time (e.g. Bing’s search suggestions), or by displaying related facts from a database (e.g. Google’s Knowledge Graph). Even so, users are often forced to perform several searches to help them find the appropriate keywords for their search.
Supporting intensive data analysis on mobile devices is unreal-istic. But we believe that well-designed mobile visualizations can not only be an entertaining medium for casual browsing, but also help users answer their (in technological terms at least) ill-formed queries. Mobile visualizations shouldsupport casual data explo-ration, andanswer user questions by displaying local data neigh-borhoods.
3 MOBILE GRAPH VISUALIZATION
There has been little work specifically addressing mobile visualiza-tion [8], and even less work offering techniques specialized toward the visualization of graphs on mobile devices. Karstens [13] pro-poses node-link diagrams of hierarchies arranged around a rectan-gle to make efficient use of display space. He displayed nearly 1000 nodes, each represented with a very small circle. Hao and Zhang [12] propose a space-filling sunburst display of hierarchies. Their larger nodes are easier to interact with, but their graphs are much smaller. Pattathet al. [15] visualize general graphs numbering just a few dozen nodes using node-link diagrams. Finally, in work most
closely related to our own, Da Lozzoet al. [11] use node-link dia-grams centered around a specific node, again with very small nodes. To recognize mobile constraints, we limit visualization to a graph neighborhood as do Da Lozzoet al., but like Hao and Zhang we display many links implicitly.
4 THEGRAPHTILES VISUALIZATION
With GraphTiles (Figure 1), we assume that users will employ search to find a locality of concern around a central node (e.g. for IMDb, “near John Wayne”). As discussed above, position in the layout reflects link distance from the center. When necessary, users can drag a non-central node to the left to change the central node.We display links largely implicitly: every node in the middle column has an implied link to the central node, and every node in the right column is reachable from the middle column. To repre-sent links between the middle and right columns we support both explicit link display and interactive reordering around a selected link. Explicit links appear only when both linked nodes are cur-rently displayed. Reordering has the added benefit of accelerating access to off-screen nodes.
We considered a circular (or rectangular) layout to make better use of the blank space in the left column, with a scroll around the central node rather than along it, but discarded it so that we could provide a glimpse of a larger two-link neighborhood. A circular layout with a two-link neighborhood would require much smaller nodes (difficult to touch with a finger tip), and would fit poorly in rectangular mobile displays.
5 EXPERIMENT1: COMPARISON OF EXPLICIT LINK REPRE-SENTATIONS
We began by considering how to display links explicitly. It might be tempting simply to draw lines between linked nodes (Figure 1c), butGraphTileshas unique characteristics that could make this solu-tion untenable. As users scroll, nodes appear and disappear, mean-ing that linkmean-ing lines do as well. Scrollmean-ing also causes the lines to move when they are onscreen, occluding a variety of other nodes and dynamically relocating link crossings (making a well-known drawback of link lines still worse). All of this dynamic behavior does not exist in most graph visualizations and could be quite dis-orienting.
In creating alternative designs for displaying explicit links, we were (loosely) inspired by the grouping principles of Gestalt psy-chology [16]. Theproximityprinciple places nearby items in the same group. Because we could not use proximity alone to display complex many-to-many relationships, we approximated proximity with an iconic representation of the neighboring column (Figure 1(d)). Rectangles in the representation indicate the presence of links to the node in the same position in the neighboring column. Similaritygroups items that have similar properties such as color or texture (Figure 1(b) and 1(e)). Here, nodes containing the outline color or a thumbnail of a neighboring node are linked to that node. Like link lines (which use the Gestalt principle ofconnectedness), all of these representations must dynamically change as the user scrolls and nodes move, but the changes are much more restrained.
5.1 Methods
Using IMDb as a testbed, we compared connectedness-inspired lines to our alternative designs in a controlled experiment, and in-cluded a text-based link display (Figure 1(a)) as a control condition. In this condition, nodes with the same text were linked. Note that because we were testing only explicit link representations, we did not enable interactive reordering in this experiment.
movie, nor the name of any actors in that movie. They do however know that one of the actors in the movie was also in a movie they know. They move from movie to actor to movie, as did participants in the first of our experimental tasks. Movie buffs also often try their hand at casting future films. They cannot remember the ac-tor’s name, nor the name of the movie they remember them from. But, they do remember the name of a second actor in that movie. They move from actor to movie to actor, just as in the second of our experimental tasks.
We expected that connectedness-, color- and texture-inspired links would perform better than text-based or proximity-inspired links. Because of the unique dynamic qualities of theGraphTiles visualization, we did not attempt to predict which link representa-tion would be best.
5.1.1 Design
We used a fully crossed within subjects 5×2×2 design. Link Depictionhad five levels: text-based as well as proximity-, color-, texture-color-, and connectedness-inspired representations.QueryType, or the type of question asked, had two levels: a movie-person-movie (MPM) query or a person-movie-person (PMP) query. Size, or the rough size of the surrounding graph neighborhood, had two levels: small or below median, and large or above median.
5.1.2 Participants and procedure
We had ten participants, all university students with normal or corrected-to-normal vision. We obtained informed consent from the participants, and asked them to read the instructions for the experi-ment. We then familiarized them with the task and link depictions using 10 training datasets, one for each combination of link Depic-tion and QueryType. Participants were free to ask verbal quesDepic-tions during training.
Participants then each performed 120 information seeking tasks, each using a different graph neighborhood in the IMDb database, with median size of 115 nodes. On average, they completed all their tasks in one hour. Every participant performed six trials with each of the 5×2×2=20 experimental treatments. We formed five blocks of 24 trials each, each block corresponding to one Depiction. Thus participants performed all trials with the current Depiction before moving on to the next. To combat the effects of fatigue and learning, we sampled all the orderings of Depiction using a 5×5 Latin Square. Within each of these Depiction blocks, we formed two 12-trial QueryType blocks. Half of the participants performed MPM questions first, half performed PMP questions first. Within each QueryType block, participants performed 6 trials with small neighborhoods and 6 with large neighborhoods. We randomized the order of these trials. To avoid any confound between treatments and graph neighborhoods, we randomized the match of graph to treatment. Each participant saw each neighborhood only once.
For each task, participants answered a question displayed on a nearby monitor. If QueryType was PMP, we asked participants to find the movie on which two given people collaborated. In this case, the central node at the left of the visualization was always a person. To answer the question, participants used a phone to scroll in the right column to find the second person’s node, select it, and then scroll in the middle column to find the movie connecting the two people, and select it. If QueryType was MPM, we asked par-ticipants to find the person who worked in two given movies. In this case, the central neighborhood node was always a movie. We recorded the time to complete each trial, and whether or not the participant performed the trial correctly. Participants were paid $10 for their effort.
5.1.3 Apparatus
We implemented our visualization on three Samsung SGH-i917 phones running Windows Phone 7.5, with an AMOLED display
and a full capacitive touch screen. The monitor used to display questions was a 1920×1200 pixel Dell 24”. Participants interacted with the visualization on a phone by scrolling with a swipe gesture or selecting nodes with a long tap.
We obtained our IMDb graph neighborhoods using the official IMDb API, obtaining a large cross section of its database (approx-imately 3GB in size). We then randomly selected 60 nodes within the IMDb graph describing well known actors (supporting PMP queries), and 60 nodes describing well known movies (supporting MPM queries). We then sampled the two-link neighborhood around each actor (PMP) node by adding the top movies linked to it as in-dicated by IMDb’s own API call; and then for each of those top movies, adding its top actors, again as indicated by IMDb’s API call. We created two-link neighborhoods around movie (MPM) nodes similarly. The number of top movies returned by IMDb’s API was generally much lower than the number of top actors.
5.2 Results
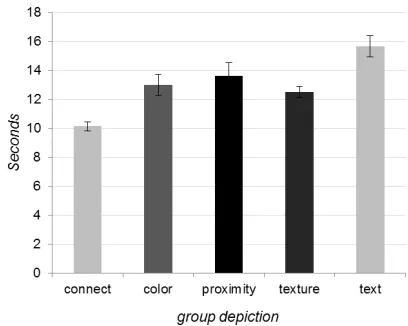
Figure 2: Average task completion times per depiction for the first experiment.
All participants completed all trials correctly, so we report only on completion time here. On completion times, we performed a single, three-factor repeated measures ANOVA. All single variable effects were significant.
The connectedness-inspired link Depiction indeed supported the fastest information seeking performance (F(4,36) =4.942,p<
0.005). Average completion times in seconds for each Depiction were: connectedness 10.1s, texture 12.5s, color 13.0s, proximity 13.6s, and text 15.7s. We show the same times in Figure 2, along with standard error. Despite their drawbacks, link lines also have strengths: they are familiar to most viewers; and they are simple, introducing only one primitive per link, while other representations require changes at both linked nodes.
Participants were much faster when asked to locate a person (the MPM QueryType) than when asked to locate a movie (PMP) (F(1,9) =43.869,p<0.001). Average completion times for per-son queries were 10.5s, and for movies 15.5s. This is likely an effect of graph size rather than some more subtle task difference. Recall that IMDb’s API returned many more top actors working on a movie than top movies in which an actor worked. This meant that PMP neighborhoods contained many more nodes than MPM neighborhoods.
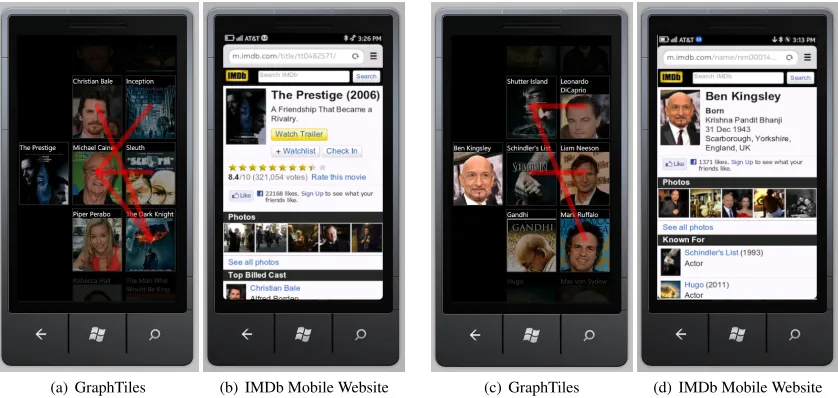
(a) GraphTiles (b) IMDb Mobile Website (c) GraphTiles (d) IMDb Mobile Website
Figure 3: ComparingGraphTileswith IMDb’s mobile website. (a) and (b): The Person QueryType; (c) and (d): the Movie QueryType.
The only significant interaction occurred between the QueryType and Size variables (F(1,9) =25.824,p=0.001). When partici-pants were asked to find movies in PMP neighborhoods, increas-ing graph Size had a large effect on completion times (13.4s vs. 17.6s). When they were asked to find persons in MPM neighbor-hoods, Size’s effect was minor (10.1s vs. 10.9s). In PMP neighbor-hoods, graphs were larger, so increasing Size had a larger effect.
5.3 Discussion
Results largely matched our expectations, with text-based and proximity-inspired links performing worst, texture- and color-inspired link Depictions performing better, and connectedness-inspired link lines performing best. However, users were only about 20% faster with link lines than with texture-inspired links contain-ing thumbnails.
6 EXPERIMENT2: COMPARISON TOIMDB’S MOBILE SITE As a summative evaluation, we comparedGraphTiles to IMDb’s mobile site. InGraphTiles, we used both interactive reordering and the best explicit link representation from our first experiment (link lines). We again focused on answering imprecise queries of the same type used in our first experiment. (We are quite willing to stipulate that IMDb’s mobile web app is the better solution for more precise queries such as “The movies that John Wayne has acted in”). Figure 3 shows a comparison of the visuals used inGraphTiles and IMDb’s mobile website to answer the person-movie-person and movie-person-movie QueryTypes.
We expected thatGraphTileswould allow users to find answers to imprecise queries more quickly than IMDb’s web app.
6.1 Methods
We comparedGraphTilesto IMDb’s mobile site in an experiment with twenty participants, all of them employees at a large corporate research center. Each participant performed 120 information seek-ing tasks, usseek-ing the same graph neighborhoods we used in our first experiment. In what follows, we note only the differences between that first experiment and this summative experiment.
We used a fully crossed within subjects 2×2 design. As partici-pants performed the tasks, we systematically altered two variables. Interface, or the tool used to access the IMDb information, had two levels:GraphTilesand the IMDb web app. QueryType, as before, had two levels: PMP or MPM. In addition to displaying link lines,
GraphTileshere implemented interactive reordering, which high-lights nodes’ links to a selected node and moves them onscreen. Every participant performed 30 trials with each of the 2×2=4 experimental treatments. We grouped trials by Interface into two blocks of 60 trials each. Thus participants performed all trials with the current Interface before moving on to the next. To combat the effects of fatigue and learning, we used complete counterbalancing across participants: half of them performed theGraphTilesblock first, the other half the web app block first. Within each of these blocks, we randomly ordered the levels of QueryType. We again randomized the order of graph neighborhoods without replacement, so that each participant saw each neighborhood exactly once.
6.2 Results and discussion
Again all participants performed all trials correctly, so we report only completion times here. We tested significance using a two-factor repeated measures ANOVA. Only the two single variable ef-fects were significant; they did not interact.
When using GraphTiles, participants were significantly (F(1,19) =2291.833,p<0.001) faster than when using the IMDb web app. Average completion time withGraphTileswas 18.2s (SD 5.27), while with IMDb web app, it was 31.5s (SD 5.26).
Although its effect was significant (F(1,19) =11.27, p<
0.005), QueryType’s effect was not meaningful. The difference in completion times when participants looked for movies rather than persons was 0.6s: (25.0s for movies, 24.4s for persons). Query-Type’s effect was likely diminished by the use of IMDb’s web app, which was not as severely affected by QueryType asGraphTiles.
Readers may wonder why average times in this experiment with GraphTileswere so much larger than they were in our first experi-ment. One cause may be the reduced practice withGraphTiles(60 vs. 120 trials) that participants had in this experiment.
Results in fact exceeded our expectations, withGraphTilesusers almost twice as fast as IMDb web app users. GraphTileswas de-signed for imprecise queries; IMDb probably was not. What re-mains to be seen is whether or not a single interface can support both precise and imprecise queries well.
7 GENERALIZING GRAPHTILES TO NON-BIPARTITE
GRAPHS
appropri-(a) Band and artist relationship (b) Band relationship (c) Interactive reordering with dimmed image when not re-lated.
Figure 4: ApplyingGraphTilesto Seattle’s music band data.
ately exploits this structure, placing people and movies in different columns. However ifGraphTilesis to find use with more general vi-sualization applications, it must be tested with non-bipartite graphs. With this goal in mind, we usedGraphTilesto visualize the Seat-tle Band Map [5]. In this database, music bands from the Pacific Northwest are linked if they share band members or have collab-orated with one another. By preprocessing the database, we could create a bipartite graph of musicians and bands (Figure 4(a)), but that is not our purpose here.
Figure 4(b) shows a non-bipartite band-band layout using lines to represent links. The challenge here is representing links that start and end within the sameGraphTilescolumn, which do not exist in bipartite graphs. Lines and most of the other explicit link repre-sentations we discussed perform poorly in such cases, since they are only displayed when both endpoints are onscreen, which will happen only rarely within the same column.
We believe interactive reordering is the best solution to this prob-lem. In Figure 4(c), the user selects the band ‘The Fartz’, bring-ing all related bands onscreen or nearly so. Unrelated bands are dimmed out in the interface to further accentuate band connections.
8 CONCLUSION AND FUTURE WORK
As mobile devices become the dominant form of computing, mo-bile visualization will become increasingly important. In this pa-per we describedGraphTiles, a new graph visualization specifi-cally designed to support imprecise mobile queries on large graph databases. In an experimental evaluation, accessing the IMDb graph withGraphTileswas nearly twice as fast as with the exist-ing IMDb mobile web app.
GraphTilescould use design improvements to maintain visual continuity. When users change the central node, they can quickly become disoriented. Future experiments might study how well GraphTilessupportsbothprecise and imprecise queries, as well as non-bipartite graphs.
We also plan to evaluateGraphTiles on other devices such as tablets, where we might display larger neighborhoods. The com-parative merits of each of our explicit link display techniques might be different when many more links must be displayed at the same time. It may also be interesting to study the use toGraphTileson the desktop, and compare it to more traditional graph representa-tions such as matrices and node-link diagrams.
REFERENCES
[1] http://www.cisco.com/en/US/solutions/
collateral/ns341/ns525/ns537/ns705/ns827/VNI_ Hyperconnectivity_WP.html.
[2] Internet movie database (imdb).http://www.imdb.com. [3] Linkedin.http://www.linkedin.com.
[4] Pandora.http://www.pandora.com.
[5] The seattle band map.http://www.seattlebandmap.com. [6] Android rises, symbian and windows phone 7 launch as
world-wide smartphone shipments increase 87.2% year over year. febru-ary 7, 2011. 2012. http://www.idc.com/about/ viewpressrelease.jsp?containerId=prUS22689111. [7] Pc market records modest gains during fourth quarter of 2010.
january 12, 2011. 2012. http://www.idc.com/about/ viewpressrelease.jsp?containerId=prUS22653511. [8] L. Chittaro. Visualizing information on mobile devices. Computer,
39(3):40–45, 2006.
[9] K. Church and N. Oliver. Understanding mobile web and mobile search use in today’s dynamic mobile landscape. InProceedings of the 13th International Conference on Human Computer Interaction with Mobile Devices and Services, MobileHCI ’11, pages 67–76, New York, NY, USA, 2011. ACM.
[10] Y. Cui and V. Roto. How people use the web on mobile devices. In Proceedings of the 17th international conference on World Wide Web, WWW ’08, pages 905–914, New York, NY, USA, 2008. ACM. [11] G. Da Lozzo, G. Di Battista, and F. Ingrassia. Drawing graphs on a
smartphone. 6502:153–164, 2011. 10.1007/978-3-642-18469-7-14. [12] J. Hao and K. Zhang. A mobile interface for hierarchical information
visualization and navigation. InConsumer Electronics, 2007. ISCE 2007. IEEE International Symposium on, pages 1–7. IEEE, 2007. [13] B. Karstens. Visualization of complex structures on mobile handhelds.
InIn Proceedings of International Workshop on Mobile Computing, pages 17–18, 2003.
[14] U. Lee, H. Kang, E. Yi, M. Yi, and J. Kantola. Understanding mobile q&a usage: an exploratory study. InSIGCHI ’12: ACM SIGCHI Con-ference on Human Factors in Computing Systems, pages 3215–3224, 2012.
[15] A. Pattath, D. S. Ebert, R. A. May, T. F. Collins, and W. Pike. Real-time scalable visual analysis on mobile devices. volume 6821, page 682102. SPIE, 2008.