ISSN(Online): 2320-9801
ISSN (Print): 2320-9798
I
nternational
J
ournal of
I
nnovative
R
esearch in
C
omputer
and
C
ommunication
E
ngineering
(An ISO 3297: 2007 Certified Organization)
Vol. 3, Issue 7, July 2015
Image Processing For Oil Pipeline Using Edge
Detection Algorithm and Mobile Robots by
Replacing the Existing Digital Camera
Dr.A.Prema Kirubakaran
Associate Professor, Department of Computer Applications, Annai Violet arts and Science College, Chennai, India
ABSTRACT:Neural units with higher-order diffusion between cracks, consisting of a minute gap across which
impulses pass has to undergo operations to evaluate good computational properties in information processing and control applications. This paper presents neural units with high order synaptic operations for image processing applications. Edge detection operations are carried out by high order synaptic performances and the results are observed through Hough transformation principles. The digital camera that is implemented to fetch pictures is based on the high order synaptic operations to solve the routing problems that arise during pixel calculations.The sample results show that the proposed neural units with high order synaptic operations are efficient for image processing, analyzing and pixel routing of the images.This research paper is a novice technique to replace the existing digital camera with a mobile robot.
KEYWORDS:MobileRobots,EdgeDetection,Pixel,Prewittfilter,Gaussian filter
I.INTRODUCTION
The idea of replacing a digital camera to robot budded with the hazards that rose during the intervention of the camera in the oil pipeline path.The pixel images were disturbed by the surface ruptures and the pixel flow was not smooth.This resulted in the uneven distribution of pixels in the images sent by the camera.To resolve this problem,a mobile robot was planned to replace the existing digital camera.A Mobile robot requires the following equipment attached to it a multiple sensored CCD Camera,ultrasonic and infrared sensors to locate its position to avoid snags and to find a proper path leading to the destination to detect the cracks.The Robot connects all the information acquired from these sensors and makes decision to control its direction and speed.
The CCD camera serves as a visual sensor for the wide range decision of mobile robot routing functions.One of the most important job of CCD camera and the processor is to capture and process images and to reject the perils in the paths.Edge detection is a simple and efficient method for mobile robot routing problems.An edge is always defined as meeting of the vertical and horizontal surfaces. Edges for a mobile robot mean to say about the path where it starts and the wall or peril starts or where the path and the peril intersect.Edges always emerge as pixel intensity discontinuities within an image.In changing light or dim situations edge detection is not easy where as it is very effective in high density situations.Edge features are used to identify the possible paths and junctions or crossings using the on-board CPU.
Through this research paper the problem of vision based routing for mobile robots using a high order neural unit is stated.Samples used for testing the required condition shows that the proposed neural units with higher order synaptic operations performed well for image processing mobile Robot routing functions.
II.BACKGROUND WORK
Proposed Mobile Robot with edge detection implementation
ISSN(Online): 2320-9801
ISSN (Print): 2320-9798
I
nternational
J
ournal of
I
nnovative
R
esearch in
C
omputer
and
C
ommunication
E
ngineering
(An ISO 3297: 2007 Certified Organization)
Vol. 3, Issue 7, July 2015
an image. The discontinuities are abrupt changes in pixel intensity which characterize boundaries of objects in a scene. Classical methods of edge detection involve convolving the image with an operator (a 2-d filter), which is constructed to be sensitive to large gradients in the image while returning values of zero in uniform regions. There are extremely large numbers of edge detection operators available, each designed to be sensitive to certain types of edges. Variables involved in the selection of an edge detection operator include:
Edge orientation: the geometry of the operator determines a characteristic direction in which it is most
sensitive to edges. Operators can be optimized to look for horizontal, vertical, or diagonal edges.
Noise environment: edge detection is difficult in noisy images, since both the noise and the edges contain
high-frequency content. Attempts to reduce the noise result in blurred and distorted edges. Operators used on noisy images are typically larger in scope, so they can average enough data to discount localized noisy pixels. This results in less accurate localization of the detected edges.
Edge structure: not all edges involve a step change in intensity. Effects such as refraction or poor focus can
result in objects with boundaries defined by a gradual change in intensity. The operator needs to be chosen to be responsive to such a gradual change in those cases. Newer wavelet-based techniques actually characterize the nature of the transition for each edge in order to distinguish, for example, edges associated with hair from edges associated with a face.
There are many ways to perform edge detection to analyze the given image. The majority of different methods may be grouped into two categories:
Gradient: the gradient method detects the edges by looking for the maximum and minimum in the first
derivative of the image.
Laplacian: the laplacian method searches for zero crossings in the second derivative of the image to find
edges. An edge has the one-dimensional shape of a ramp and calculating the derivative of the image can highlight its location.
III.SCOPE OF RESEARCH
Performance of Edge Detection Algorithms
Gradient-based algorithms such as the prewitt filter have a major drawback of being very sensitive to noise. The size of the kernel filter and coefficients are fixed and cannot be adapted to a given image. An adaptive edge-detection algorithm is necessary to provide a robust solution that is adaptable to the varying noise levels. Gradient-based algorithms such as the prewitt filter have a major drawback of being very sensitive to noise. The size of the kernel filter and coefficients are fixed and cannot be adapted to a given image. An adaptive edge-detection algorithm is necessary to provide a robust solution that is adaptable to the varying noise levels of these images to help distinguish valid image contents from visual artifacts introduced by noise.
The performance of the canny algorithm depends heavily on the adjustable parameters, σ, which is the standard deviation for the Gaussian filter, and the threshold values, ‘t1’ and ‘t2’. Σ also controls the size of the Gaussian filter. The bigger the value for σ, the larger the size of the Gaussian filter becomes. This implies more blurring, necessary for noisy images, as well as detecting larger edges. As expected, however, the larger the scale of the Gaussian, the less accurate is the localization of the edge. Smaller values of σ imply a smaller Gaussian filter which limits the amount of blurring, maintaining finer edges in the image. The user can tailor the algorithm by adjusting these parameters to adapt to different environments.
ISSN(Online): 2320-9801
ISSN (Print): 2320-9798
I
nternational
J
ournal of
I
nnovative
R
esearch in
C
omputer
and
C
ommunication
E
ngineering
(An ISO 3297: 2007 Certified Organization)
Vol. 3, Issue 7, July 2015
Fig 1.Pipeline Showing Crack with Measurement (PictureCourtesy-SADARA, KSA)
A diagram showing the implementation of an edge detection algorithm.
IV.DISCUSSION
Smoothing of an Image
In image processing, to smooth a data set is to create an approximating function that attempts to capture important patterns in the data, while leaving out noise or other fine-scale structures or rapid phenomena. In smoothing, the data points of a signal are modified so individual points (presumably because of noise) are reduced, and points that are lower than the adjacent points are increased leading to a smoother signal. Smoothing may beused in two important ways that can aid in data analysis
Being able to extract more information from the data as long as the assumption of smoothing is reasonable
Being able to provide analyses that are both flexible and robust.
Image noise is a random (not present in the object imaged) variation of brightness or color information in images, is usually an aspect of electronic noise. It can be produced by the sensor and circuitry of a scanneror digital camera.
Goals of Edge Detection
i. Produce a line drawing of a scene from an image of that scene.
ii. Important features can be extracted from the edges of an image (e.g., corner, lines, curves -these features are used by higher-level computer vision algorithms (e.g., recognition).
Data Processing Techniques Involved in Image Analysis Processing
ISSN(Online): 2320-9801
ISSN (Print): 2320-9798
I
nternational
J
ournal of
I
nnovative
R
esearch in
C
omputer
and
C
ommunication
E
ngineering
(An ISO 3297: 2007 Certified Organization)
Vol. 3, Issue 7, July 2015
discussed and developed to carry out this for a better implementation, with morphological operators and edge detection principles. Below several systems related with image analysis are described briefly,
Enhancement
Enhancement programs make information more visible.
Histogram equalization-redistributes the intensities of the image of the entire range of possible intensities (usually 256 gray-scale levels).
Unsharp masking-subtracts smoothed image from the original image to emphasize intensity changes.
Convolution
Convolution programs are 3-by-3 masks operating on pixel neighborhoods.
High pass filter-emphasizes regions with rapid intensity changes.
Low pass filter-smooth’s images, blurs regions with rapid changes.
Math processes
Math processes programs perform a variety of functions.
Add images-adds two images together, pixel-by-pixel.
Subtract images-subtracts second image from first image, pixel by pixel.
Exponential or logarithm-raises e to power of pixel intensity or takes log of pixel intensity. Nonlinearly accentuates or diminishes intensity variation over the image.
Scalar add, subtract, multiply, or divide-applies the same constant values as specified by the user to all pixels, one at a time. Scales pixel intensities uniformly or non-uniformly
Dilation-morphological operation expanding bright regions of image.
Erosion-morphological operation shrinking bright regions of image.
Noise filters
Noise filters decrease noise by diminishing statistical deviations.
Adaptive smoothing filter-sets pixel intensity to a value somewhere between original value and mean value corrected by degree of noisiness. Good for decreasing statistical, especially single-dependent noise.
Median filter-sets pixel intensity equal to median intensity of pixels in neighborhood. An excellent filter for eliminating intensity spikes.
Sigma filter-sets pixel intensity equal to mean of intensities in neighborhood within two of the mean. Good filter for signal-independent noise.
Trend Removal
Trend removal programs remove intensity trends varying slowly over the image.
Row-column fit-fits image intensity along a row or column by a polynomial and subtract fit from data. Chooses row or column according to direction that has the least abrupt changes.
Edge detection for bright images:Edge detection programs sharpen intensity-transition regions.
First difference-subtracts intensities of adjacent pixels. Emphasizes noise as well as desired changes.
SOBEL operator-3-by-3 mask weighs inner pixels twice as heavily as corner values. Calculates intensity differences.
Morphological edge detection-finds the difference between dilated (expanded) and eroded (shrunken) version of image.
V.SIMULATION RESULTS
ISSN(Online): 2320-9801
ISSN (Print): 2320-9798
I
nternational
J
ournal of
I
nnovative
R
esearch in
C
omputer
and
C
ommunication
E
ngineering
(An ISO 3297: 2007 Certified Organization)
Vol. 3, Issue 7, July 2015
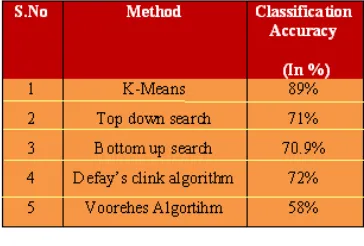
Table 3.3 Accuracy Classification Percentage
Fig 2.Accuracy Classification Percentage
After repeated process with different levels of algorithm for cluster evaluation, k-means algorithm is accepted to satisfy the need of this proposed research work.
Figure 3. Estimation of Time and Distance of an Image
Figure 4. Performances of the Identified and Unidentified Clusters
The simulation studies involve the deterministic small cluster topology with cracks as shown in Fig.1. The proposed k-cluster algorithm is implemented with MATLAB. Same sizes of pixel images were taken for sample reading.Images were classified using the algorithm and a clear pixel reading is proposed.
ISSN(Online): 2320-9801
ISSN (Print): 2320-9798
I
nternational
J
ournal of
I
nnovative
R
esearch in
C
omputer
and
C
ommunication
E
ngineering
(An ISO 3297: 2007 Certified Organization)
Vol. 3, Issue 7, July 2015
We considered the simulation time as a pixel lifetime and pixel lifetime is a time when no point is available to analyze the cluster. Simulation time is calculated through the CPUTIME function of MATLAB. The results show that the total cluster analysis energy performs better than the maximum number of pixels with defects in terms of clusterlifetime. The time and distance graph showed in Fig.3 is able to show the pixel evaluation with travelling distance of the mobile robot inside the oilpipeline. If the distance is less time taken to evaluate the cluster region reduces and vice versa.
VI.CONCLUSIONS
The drawbacks of the existing model and the amount of human error caused while analyzing a pipeline manually motivated to implement this research work. The characteristics of modeling this research work using the combination of cluster analysis, mathematical morphological operator and edge detection principles opens up the idea of designing a computer based monitoring system (CBMS), to detect the holes, cracks or any other flaws in an oil pipeline. The existing model performs the same operation but not time consuming, men and material wastage is more. In the existing model, the restriction also lies in the usage of more number of devices to perform the task of finding the defects. This CBMS uses only minimized physical devices and it is cost effective. The algorithms developed give a clear image analysis and processing to achieve the goal of defect free image of a pipe line. This can be extensively implemented for any kind of pipeline that carries liquids or gases. The memory area used to store the bit values is also temporary, so after mathematical evaluation, the buffer area can be removed, according to the user need. There is no question of bit bouncing, because of this nature of handling the memory area. The proposed CBMS model is faster and time consuming than the existing manual model.
REFERENCES
1.ARM System Developers Guide Designing and optimizing system software Andrew N. Sloss, Dominic Symes, Chris Wright
2.Computer Organization and Embedded Systems Carl Hamacher, ZvonkoVranesic, SafwatZaky, NaraigManjikian
3.Circuit Design-Know it all Darren Ashby, Bonnie Baker, Stuart Ball, J. Crowe, Barrie Hayes-Gill, Ian Hickman, Walt Kester, Ron Mancini, Ian
Grout, Robert A. Pease, Mike Tooley, Tim Williams, Peter Wilson, Bob Zeidman
4.Build Your Own Low-Power Transmitters Rudolf F. Graf, William She
5.Robot Building for Beginners David Cook
6.Intermediate Robot Building avid Cook
7.Robot Builder’s Bonaza Gordon McComb, MykePredko
8.Autonomous Mobile Robots Roland Siegwart, Illah R. Mourbakhsh
9.Principles of Robot Motion: Theory, Algorithms, and Implementations Howie Choset, Kevin M. Lynch, Seth Hutchinson, George A. Kantor,
Wolfram Burgard, Lydia E. Kavraki, Sebastia
10.A Computational approach to edge detection J.Canny
BIOGRAPHY